Grenada: Fire Incidents, Mississippi (MS)
Where are fire incidents reported in Grenada, MS
Something went wrong! Please refresh the page.
| Fire incidents reported | |
|---|---|
| Sreet name | Count |
| SUNSET DR | 222 |
| INTERSTATE 55 | 90 |
| COMMERCE ST | 76 |
| GOVAN ST | 72 |
| I-55 | 46 |
| WASHINGTON ST | 46 |
| LEVEE ST | 44 |
| SWEETHOME RD | 40 |
| HWY 51 | 38 |
| MONROE ST | 38 |
| POPLAR ST | 38 |
| HWY 8 EAST | 36 |
| I55 | 36 |
| CARROLLTON RD | 32 |
| HWY 51 SOUTH | 30 |
| PERRY RD | 30 |
| RAYFORD ST | 30 |
| ADAMS ST | 26 |
| CHERRY ST | 26 |
| HWY 7 | 26 |
| LAKEVIEW DR | 26 |
| PEARL ST | 26 |
| RAILROAD AVE | 26 |
| SCENIC LOOP 333 | 26 |
| SUNSET DRIV | 26 |
| TIE PLANT RD | 26 |
| DEAN DR | 24 |
| MOOSE LODGE RD | 24 |
| MOUND ST | 24 |
| SOUTH ST | 24 |
| Other | 1,654 |
2002 - 2018 National Fire Incident Reporting System (NFIRS) incidents
- Incident types reported to NFIRS in Grenada, MS
- 2,92847.5%Fire
- 1,09517.8%Hazardous Condition
- 77812.6%False Alarm
- 5278.6%Rescue & EMS
- 4457.2%Good Intent Call
- 3095.0%Service Call
- 380.6%Overpressure Rupture
- 210.3%Severe Weather
- 180.3%Special Incident
- Fire incident types reported to NFIRS in Grenada, MS
- 1,11338.0%Outside Fires
- 1,04935.8%Structure Fires
- 63921.8%Mobile Property/Vehicle Fires
- 1274.3%Other
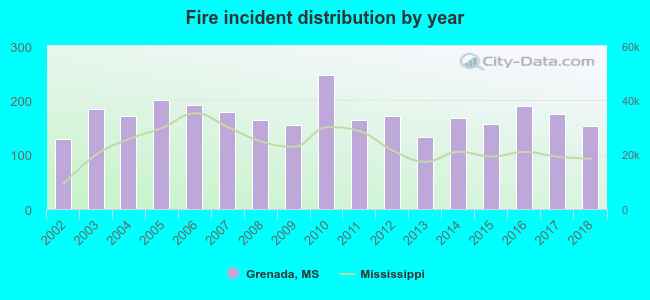 Based on the data from the years 2002 - 2018 the average number of fire incidents per year is 172. The highest number of reported fires - 247 took place in 2010, and the least - 128 in 2002. The data has an increasing trend.
The average number of yearly fire incidents per 10k residents in Grenada, MS compared to nearest cities:
(Note: Based on data for the last 3 years, including only cities with population 5,000 and above)
| Grenada: | 133.0 |
| Greenwood: | 73.3 |
| Batesville: | 247.3 |
| Oxford: | 98.1 |
| Kosciusko: | 78.3 |
| Clarksdale: | 74.5 |
| Cleveland: | 91.8 |
 The median response time based on all reported fire incidents is 4 minutes. This is lower than the state median value.
The median response time in Grenada, MS compared to nearest cities:
(Note: Based on data for all years, including only cities with at least 500 fire incidents)
| Grenada: | 4 minutes |
| Winona: | 5 minutes |
| Charleston: | 9 minutes |
| Greenwood: | 5 minutes |
| Water Valley: | 7 minutes |
| Calhoun City: | 6 minutes |
| Bruce: | 10 minutes |
| Pope: | 12 minutes |
| Courtland: | 12 minutes |
 Based on the data from the years 2002 - 2018 the average number of fire-related fatalities per year is 1. The highest number of reported deaths - 8 took place in 2007, and the lowest - 0 in 2006. The data has a decreasing trend.
The average number of deaths per 1,000 fires is 7. This indicator was the highest - 45 in 2007, and the lowest 0 in 2006. The trend for deaths per 1,000 fires is declining. Compared to the Mississippi value the number of fatalities per 1,000 incidents is much higher.
Based on the data from the years 2002 - 2018 the average number of fire-related fatalities per year is 1. The highest number of reported deaths - 8 took place in 2007, and the lowest - 0 in 2006. The data has a decreasing trend.
The average number of deaths per 1,000 fires is 7. This indicator was the highest - 45 in 2007, and the lowest 0 in 2006. The trend for deaths per 1,000 fires is declining. Compared to the Mississippi value the number of fatalities per 1,000 incidents is much higher.Deaths per 1,000 incidents in Grenada, MS compared to nearest cities:
(Note: Based on data for all years, including only cities with at least 2,500 fire incidents)
| Grenada: | 6.5 |
| Batesville: | 2.7 |
| Oxford: | 2.5 |
| Clarksdale: | 3.1 |
 Based on the data from the years 2002 - 2018 the average number of fire-related yearly casualties is 2. The highest number of injuries - 6 took place in 2008, and the lowest - 0 in 2004. The data has a growing trend.
The average number of casualties per 1,000 fires is 10. This indicator was the highest - 37 in 2008, and the lowest 0 in 2004. The trend for casualties per 1,000 fires is growing. Compared to the Mississippi value the number of injuries per 1,000 fires is much higher.
Based on the data from the years 2002 - 2018 the average number of fire-related yearly casualties is 2. The highest number of injuries - 6 took place in 2008, and the lowest - 0 in 2004. The data has a growing trend.
The average number of casualties per 1,000 fires is 10. This indicator was the highest - 37 in 2008, and the lowest 0 in 2004. The trend for casualties per 1,000 fires is growing. Compared to the Mississippi value the number of injuries per 1,000 fires is much higher.Casualties per 1,000 incidents in Grenada, MS compared to nearest cities:
(Note: Based on data for all years, including only cities with at least 500 fire incidents)
| Grenada: | 9.6 |
| Winona: | 0.0 |
| Charleston: | 2.0 |
| Greenwood: | 0.9 |
| Water Valley: | 3.0 |
| Calhoun City: | 0.0 |
| Bruce: | 0.0 |
| Pope: | 0.0 |
| Courtland: | 1.4 |
 32.9% incidents where reported in the morning and 67.1% in the evening. The most fires (15.9%) took place on Saturday, and the least (12.5%) on Tuesday.
 According to the 2,928 reports from years 2002 - 2018 most fires (11.7%) took place during March, and the least (6.5%) in June.
 Out of all 6,159 cases reported during the years 2002 - 2018, the most belonged to the categories: Fire (47.5%), Hazardous Condition (17.8%), and False Alarm (12.6%).
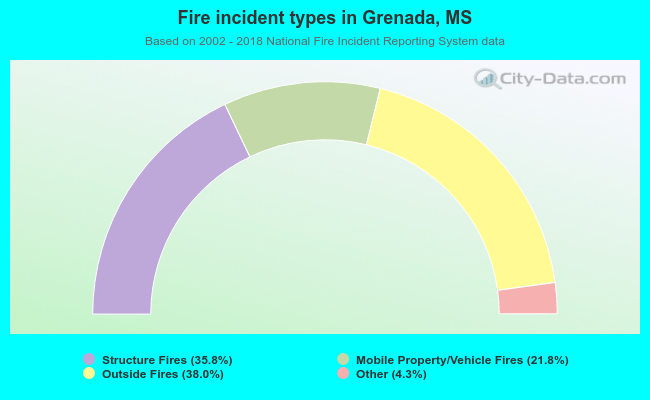 When looking into fire subcategories, the most incidents belonged to: Outside Fires (38.0%), and Structure Fires (35.8%).