Grantsville: Fire Incidents, Utah (UT)
Where are fire incidents reported in Grantsville, UT
Something went wrong! Please refresh the page.
|
| |||||||||||||||||||||||||||||||||||||||||||||||||||||||||||||||||||||||||||||||||||||||||||||||||||||||||||||
2002 - 2018 National Fire Incident Reporting System (NFIRS) incidents
- Incident types reported to NFIRS in Grantsville, UT
- 24255.0%Fire
- 8619.5%Good Intent Call
- 7416.8%Rescue & EMS
- 133.0%Hazardous Condition
- 102.3%False Alarm
- 92.0%Service Call
- 61.4%Special Incident
- Fire incident types reported to NFIRS in Grantsville, UT
- 13455.4%Outside Fires
- 6125.2%Structure Fires
- 4418.2%Mobile Property/Vehicle Fires
- 31.2%Other
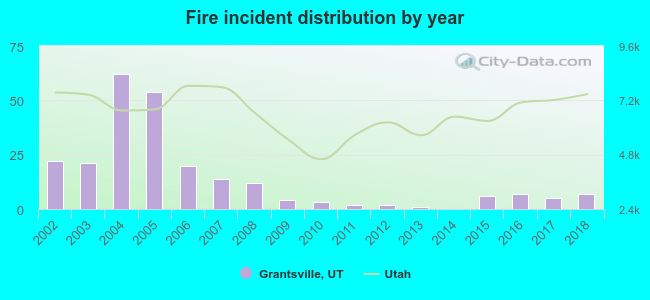 According to the data from the years 2002 - 2018 the average number of fire incidents per year is 14. The highest number of reported fires - 62 took place in 2004, and the least - 0 in 2014. The data has a dropping trend.
The average number of yearly fire incidents per 10k residents in Grantsville, UT compared to nearest cities:
(Note: Based on data for the last 3 years, including only cities with population 5,000 and above)
| Grantsville: | 6.4 |
| Stansbury Park: | 21.4 |
| Tooele: | 2.4 |
| Magna: | 32.1 |
| Herriman: | 16.2 |
| Kearns: | 20.0 |
| West Valley City: | 29.0 |
| West Jordan: | 11.0 |
| South Jordan: | 9.0 |
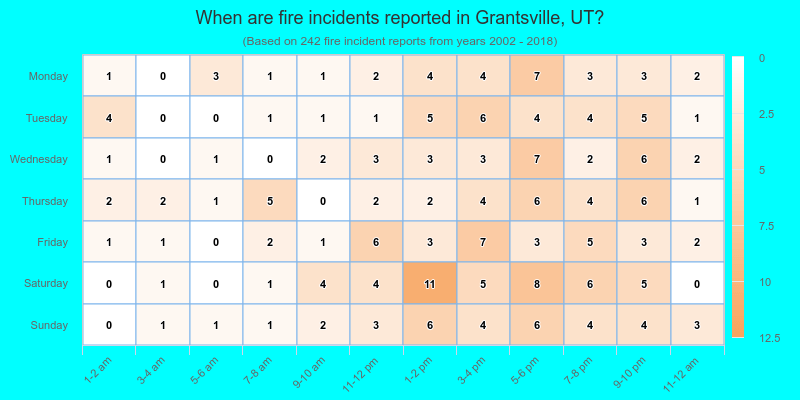
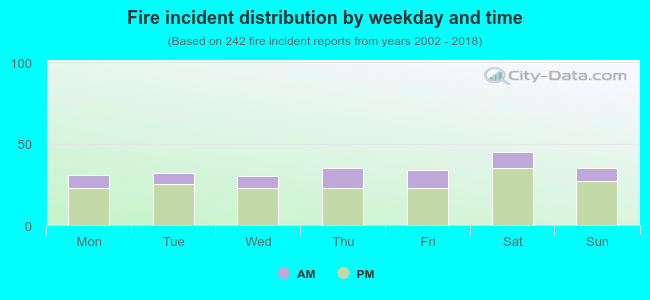 26.0% incidents where reported in the morning and 74.0% in the evening. The most fires (18.6%) took place on Saturday, and the least (12.4%) on Wednesday.
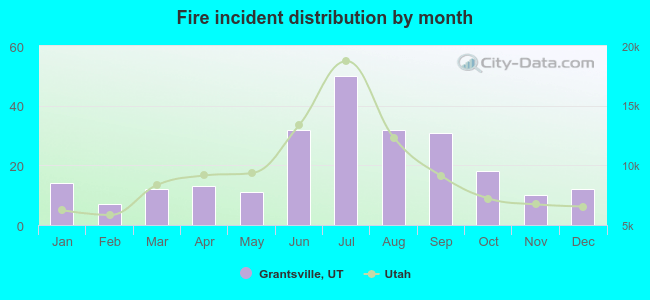 According to the 242 fire incidents from years 2002 - 2018 most fires (20.7%) took place during July, and the least (2.9%) in February.
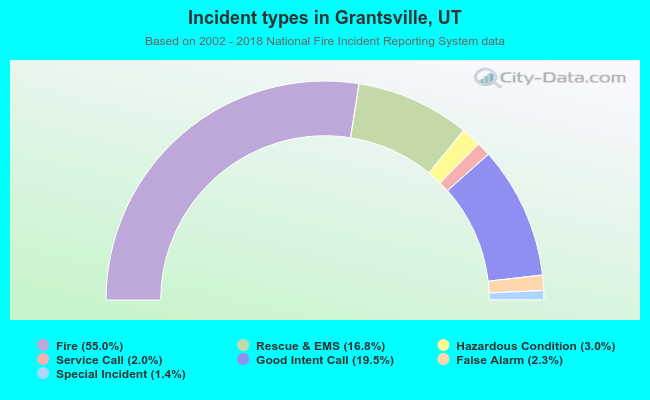 Out of all 440 cases reported during the years 2002 - 2018, the most belonged to the categories: Fire (55.0%), Service Call (19.5%), and Overpressure Rupture (16.8%).
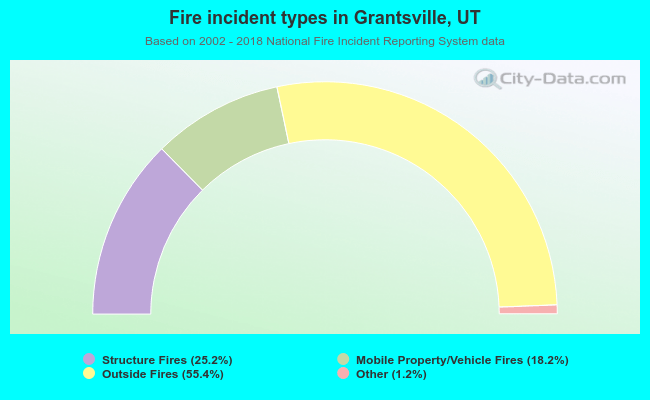 When looking into fire subcategories, the most incidents belonged to: Outside Fires (55.4%), and Structure Fires (25.2%).