Golden Hills: Fire Incidents, California (CA)
Where are fire incidents reported in Golden Hills, CA
Something went wrong! Please refresh the page.
|
| |||||||||||||||||||||||||||||||||||||||||||||||||||||||||||||||||||||||||||||||||||||||||||||||||||||||||||||
2005 - 2017 National Fire Incident Reporting System (NFIRS) incidents
- Incident types reported to NFIRS in Golden Hills, CA
- 63139.0%Rescue & EMS
- 35021.6%Good Intent Call
- 24014.8%Hazardous Condition
- 21213.1%Fire
- 1036.4%Service Call
- 553.4%False Alarm
- 241.5%Special Incident
- 20.1%Overpressure Rupture
- Fire incident types reported to NFIRS in Golden Hills, CA
- 10147.6%Outside Fires
- 8741.0%Structure Fires
- 2210.4%Mobile Property/Vehicle Fires
- 20.9%Other
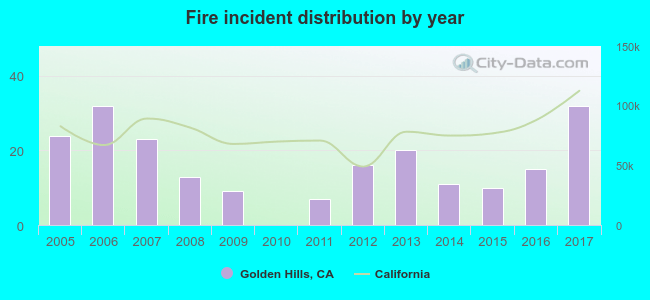 According to the data from the years 2005 - 2017 the average number of fires per year is 16. The highest number of fires - 32 took place in 2006, and the least - 0 in 2010. The data has a rising trend.
The average number of yearly fire incidents per 10k residents in Golden Hills, CA compared to nearest cities:
(Note: Based on data for the last 3 years, including only cities with population 5,000 and above)
| Golden Hills: | 27.1 |
| Tehachapi: | 34.8 |
| Bear Valley Springs: | 1.9 |
| Arvin: | 37.7 |
| Lamont: | 28.2 |
| Rosamond: | 40.2 |
| Bakersfield: | 64.4 |
| California City: | 5.8 |
| Oildale: | 38.1 |

 34.9% incidents where reported in the morning and 65.1% in the evening. The most fires (21.2%) took place on Sunday, and the least (9.0%) on Friday.
 According to the 212 fires from years 2005 - 2017 most fires (12.7%) took place during June, and the least (4.2%) in April.
 Out of all 1,617 cases reported during the years 2005 - 2017, the most belonged to the categories: Rescue & EMS (39.0%), Good Intent Call (21.6%), and Hazardous Condition (14.8%).
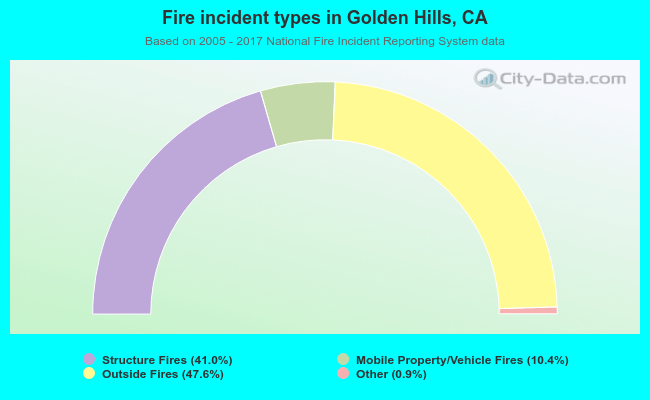 When looking into fire subcategories, the most reports belonged to: Outside Fires (47.6%), and Structure Fires (41.0%).