Fremont: Fire Incidents, Ohio (OH)
Where are fire incidents reported in Fremont, OH
Something went wrong! Please refresh the page.
| Fire incidents reported | |
|---|---|
| Sreet name | Count |
| STATE ST | 206 |
| HAYES AVE | 82 |
| FIFTH ST | 70 |
| FRONT ST | 70 |
| OHIO AVE | 54 |
| BUCHANAN ST | 48 |
| OHIO TURNPIKE | 46 |
| CROGHAN ST | 44 |
| OAK HARBOR RD | 40 |
| DICKINSON ST | 38 |
| NORTH ST | 38 |
| WOOD ST | 38 |
| FOURTH ST | 34 |
| MORRISON ST | 34 |
| BUCKLAND AVE | 32 |
| MAJESTIC DR | 30 |
| SR 53 | 30 |
| STONE ST | 30 |
| BIDWELL AVE | 28 |
| FANGBONER RD | 28 |
| MAY ST | 28 |
| NAPOLEON RD | 28 |
| PARK AVE | 28 |
| RAWSON AVE | 28 |
| TIFFIN ST | 28 |
| QUAIL DR | 26 |
| SEAN DR | 26 |
| SIXTH ST | 26 |
| COMMERCE DR | 24 |
| SOUTH ST | 24 |
| Other | 462 |
2002 - 2018 National Fire Incident Reporting System (NFIRS) incidents
- Incident types reported to NFIRS in Fremont, OH
- 1,85026.3%Rescue & EMS
- 1,74824.8%Fire
- 1,49221.2%Hazardous Condition
- 81711.6%False Alarm
- 71510.1%Service Call
- 3384.8%Good Intent Call
- 380.5%Severe Weather
- 270.4%Overpressure Rupture
- 200.3%Special Incident
- Fire incident types reported to NFIRS in Fremont, OH
- 72241.3%Outside Fires
- 69039.5%Structure Fires
- 31818.2%Mobile Property/Vehicle Fires
- 181.0%Other
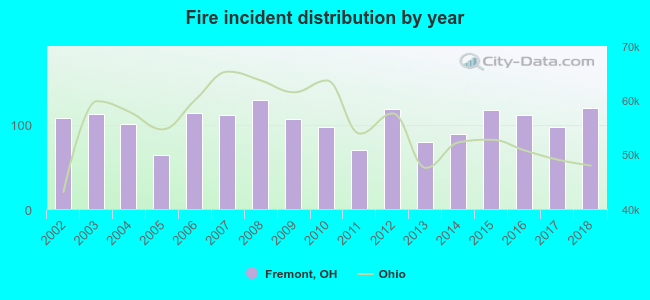 Based on the data from the years 2002 - 2018 the average number of fires per year is 103. The highest number of reported fire incidents - 129 took place in 2008, and the least - 64 in 2005. The data has an increasing trend.
The average number of yearly fire incidents per 10k residents in Fremont, OH compared to nearest cities:
(Note: Based on data for the last 3 years, including only cities with population 5,000 and above)
| Fremont: | 66.5 |
| Clyde: | 56.5 |
| Port Clinton: | 97.6 |
| Bellevue: | 67.8 |
| Tiffin: | 61.1 |
| Fostoria: | 62.5 |
| Sandusky: | 81.4 |
| Northwood: | 84.3 |
| Norwalk: | 39.5 |
 The median response time based on all reported fire incidents is 4 minutes. This is lower than the Ohio median value.
The median response time in Fremont, OH compared to nearest cities:
(Note: Based on data for all years, including only cities with at least 500 fire incidents)
| Fremont: | 4 minutes |
| Clyde: | 6 minutes |
| Oak Harbor: | 8 minutes |
| Port Clinton: | 8 minutes |
| Bellevue: | 6 minutes |
| Tiffin: | 4 minutes |
| Fostoria: | 4 minutes |
| Sandusky: | 4 minutes |
| Northwood: | 7 minutes |
 According to the reports from the years 2002 - 2018 the average number of fire-related fatalities per year is 1. The highest number of deaths - 8 took place in 2008, and the lowest - 0 in 2003. The data has a decreasing trend.
 According to the data from the years 2002 - 2018 the average number of fire-related yearly casualties is 2. The highest number of reported injuries - 5 took place in 2003, and the lowest - 0 in 2011. The data has a declining trend.
The average number of casualties per 1,000 fire incidents is 22. This indicator was the highest - 63 in 2005, and the lowest 0 in 2011. The trend for casualties per 1,000 fires is declining. Compared to the Ohio value the number of injuries per 1,000 incidents is higher.
According to the data from the years 2002 - 2018 the average number of fire-related yearly casualties is 2. The highest number of reported injuries - 5 took place in 2003, and the lowest - 0 in 2011. The data has a declining trend.
The average number of casualties per 1,000 fire incidents is 22. This indicator was the highest - 63 in 2005, and the lowest 0 in 2011. The trend for casualties per 1,000 fires is declining. Compared to the Ohio value the number of injuries per 1,000 incidents is higher.Casualties per 1,000 incidents in Fremont, OH compared to nearest cities:
(Note: Based on data for all years, including only cities with at least 500 fire incidents)
| Fremont: | 21.2 |
| Clyde: | 14.0 |
| Oak Harbor: | 2.3 |
| Port Clinton: | 15.2 |
| Bellevue: | 15.4 |
| Tiffin: | 4.6 |
| Fostoria: | 14.7 |
| Sandusky: | 35.1 |
| Northwood: | 10.7 |
 31.0% incidents where reported in the morning and 69.0% in the evening. The most fires (15.7%) took place on Saturday, and the least (12.8%) on Thursday.
 Based on the 1,748 fires from years 2002 - 2018 most fires (12.3%) took place during April, and the least (6.1%) in February.
 Out of all 7,045 cases reported during the years 2002 - 2018, the most belonged to the categories: Rescue & EMS (26.3%), Fire (24.8%), and Hazardous Condition (21.2%).
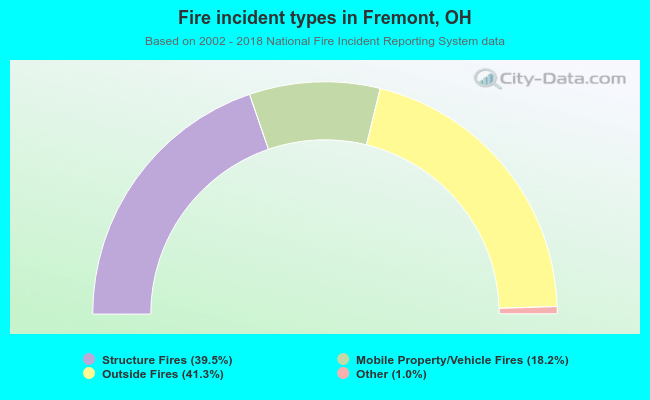 When looking into fire subcategories, the most incidents belonged to: Outside Fires (41.3%), and Structure Fires (39.5%).