Franklin: Fire Incidents, Massachusetts (MA)
Where are fire incidents reported in Franklin, MA
Something went wrong! Please refresh the page.
| Fire incidents reported | |
|---|---|
| Sreet name | Count |
| WEST CENTRAL ST | 92 |
| EAST CENTRAL ST | 84 |
| FRANKLIN VILLAGE DR | 44 |
| POND ST | 44 |
| BEAVER ST | 40 |
| MAIN ST | 40 |
| KING ST | 38 |
| UNION ST | 38 |
| WASHINGTON ST | 38 |
| MAPLE ST | 32 |
| FISHER ST | 28 |
| POPULATIC ST | 28 |
| SUMMER ST | 28 |
| LINCOLN ST | 26 |
| FORGE PKWY | 22 |
| GLEN MEADOW RD | 22 |
| PLEASANT ST | 22 |
| 495 SOUTH 1716 | 20 |
| GROVE ST | 20 |
| ELM ST | 18 |
| OAK ST | 18 |
| 495 NORTH 16-17 | 16 |
| 495 NORTH 1617 | 16 |
| 495 SOUTH 1615 | 14 |
| BROOK ST | 14 |
| CHESTNUT ST | 14 |
| HAYWARD ST | 14 |
| MAIN ST | 14 |
| PROSPECT ST | 14 |
| CONSTITUTION BLVD | 12 |
| Other | 141 |
2002 - 2018 National Fire Incident Reporting System (NFIRS) incidents
- Incident types reported to NFIRS in Franklin, MA
- 10,51964.6%Rescue & EMS
- 1,75410.8%False Alarm
- 1,3028.0%Hazardous Condition
- 1,0116.2%Fire
- 8215.0%Service Call
- 8185.0%Good Intent Call
- 320.2%Special Incident
- 200.1%Severe Weather
- Fire incident types reported to NFIRS in Franklin, MA
- 43743.2%Structure Fires
- 42542.0%Outside Fires
- 11211.1%Mobile Property/Vehicle Fires
- 373.7%Other
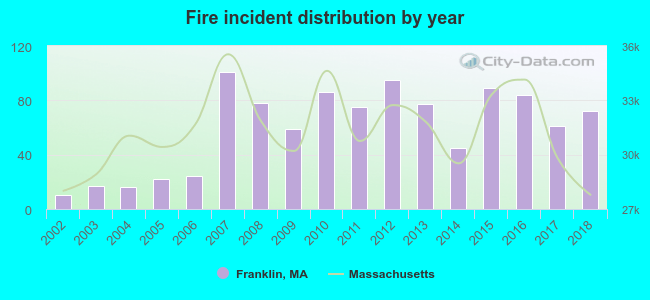 According to the data from the years 2002 - 2018 the average number of fires per year is 59. The highest number of reported fire incidents - 101 took place in 2007, and the least - 10 in 2002. The data has an increasing trend.
The average number of yearly fire incidents per 10k residents in Franklin, MA compared to nearest cities:
(Note: Based on data for the last 3 years, including only cities with population 5,000 and above)
| Franklin: | 22.5 |
| Wrentham: | 20.1 |
| Norfolk: | 60.0 |
| Medway: | 42.1 |
| Millis: | 6.3 |
| Plainville: | 44.0 |
| Milford: | 41.4 |
| Mendon: | 15.4 |
| Holliston: | 5.2 |
 The median response time based on all reported fire incidents is 6 minutes. This is higher compared to the state median value.
The median response time in Franklin, MA compared to nearest cities:
(Note: Based on data for all years, including only cities with at least 500 fire incidents)
| Franklin: | 6 minutes |
| Bellingham: | 7 minutes |
| Wrentham: | 2 minutes |
| Norfolk: | 3 minutes |
| Plainville: | 4 minutes |
| Milford: | 5 minutes |
| Blackstone: | 5 minutes |
| Foxborough: | 5 minutes |
| Walpole: | 3 minutes |
 According to the data from the years 2002 - 2018 the average number of fire-related casualties per year is 0. The highest number of reported injuries - 1 took place in 2003, and the lowest - 0 in 2002. The data has a constant trend.
The average number of casualties per 1,000 fires is 5. This indicator was the highest - 59 in 2003, and the lowest 0 in 2002. The trend for injuries per 1,000 incidents is constant. Compared to the state value the number of injuries per 1,000 fire incidents is much lower.
According to the data from the years 2002 - 2018 the average number of fire-related casualties per year is 0. The highest number of reported injuries - 1 took place in 2003, and the lowest - 0 in 2002. The data has a constant trend.
The average number of casualties per 1,000 fires is 5. This indicator was the highest - 59 in 2003, and the lowest 0 in 2002. The trend for injuries per 1,000 incidents is constant. Compared to the state value the number of injuries per 1,000 fire incidents is much lower.Casualties per 1,000 incidents in Franklin, MA compared to nearest cities:
(Note: Based on data for all years, including only cities with at least 500 fire incidents)
| Franklin: | 3.0 |
| Bellingham: | 12.0 |
| Wrentham: | 0.0 |
| Norfolk: | 15.0 |
| Plainville: | 7.6 |
| Milford: | 25.0 |
| Blackstone: | 15.5 |
| Foxborough: | 5.5 |
| Walpole: | 12.4 |
 31.6% incidents where reported in the morning and 68.4% in the evening. The most fires (16.1%) took place on Sunday, and the least (12.2%) on Wednesday.
 Based on the 1,011 incident reports from years 2002 - 2018 most fires (12.8%) took place during April, and the least (5.5%) in February.
 Out of all 16,284 cases reported during the years 2002 - 2018, the most belonged to the categories: Rescue & EMS (64.6%), False Alarm (10.8%), and Hazardous Condition (8.0%).
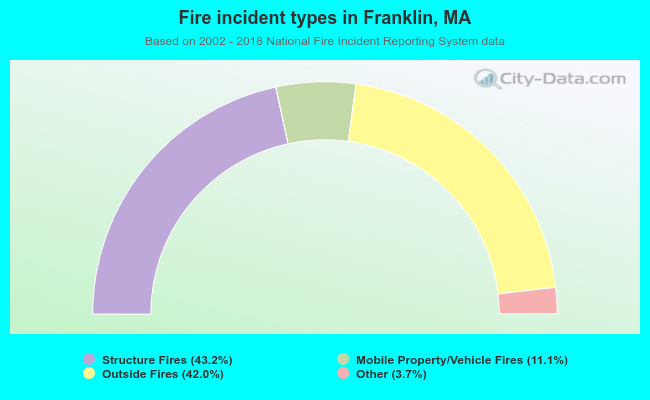 When looking into fire subcategories, the most reports belonged to: Structure Fires (43.2%), and Outside Fires (42.0%).