Fond du Lac: Fire Incidents, Wisconsin (WI)
Where are fire incidents reported in Fond du Lac, WI
Something went wrong! Please refresh the page.
| Fire incidents reported | |
|---|---|
| Sreet name | Count |
| MAIN ST | 166 |
| JOHNSON ST | 148 |
| DIVISION ST | 100 |
| PIONEER RD | 94 |
| HICKORY ST | 74 |
| FOREST AVE | 72 |
| ROLLING MEADOWS DR | 62 |
| PETERS AVE | 58 |
| ARNDT ST | 56 |
| SCOTT ST | 56 |
| PARK AVE | 48 |
| 41 HWY | 44 |
| MARR ST | 42 |
| MILITARY RD | 40 |
| SEYMOUR ST | 40 |
| 2ND ST | 36 |
| 3RD ST | 34 |
| DOTY ST | 34 |
| WESTERN AVE | 34 |
| VAN DYNE RD | 32 |
| 13TH ST | 30 |
| 1ST ST | 30 |
| 6TH ST | 28 |
| LAKESHORE DR | 28 |
| 4TH ST | 26 |
| 9TH ST | 24 |
| LOST ARROW RD | 24 |
| MERRILL AVE | 24 |
| NATIONAL AVE | 24 |
| COUNTY ROAD T | 22 |
| Other | 590 |
2002 - 2018 National Fire Incident Reporting System (NFIRS) incidents
- Incident types reported to NFIRS in Fond du Lac, WI
- 12,31757.4%Rescue & EMS
- 2,21010.3%Hazardous Condition
- 2,1209.9%Fire
- 2,0859.7%Service Call
- 1,5157.1%False Alarm
- 1,0965.1%Good Intent Call
- 470.2%Overpressure Rupture
- 360.2%Special Incident
- Fire incident types reported to NFIRS in Fond du Lac, WI
- 1,03849.0%Structure Fires
- 63429.9%Outside Fires
- 31314.8%Mobile Property/Vehicle Fires
- 1356.4%Other
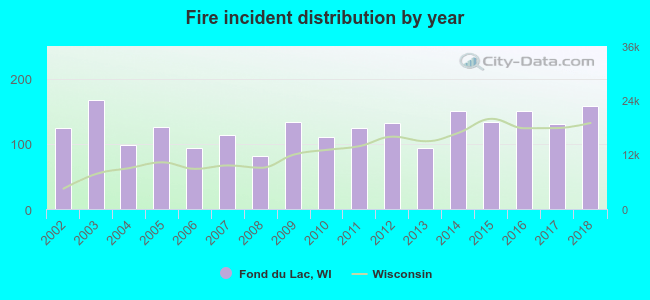 Based on the data from the years 2002 - 2018 the average number of fire incidents per year is 125. The highest number of reported fires - 167 took place in 2003, and the least - 82 in 2008. The data has a rising trend.
The average number of yearly fire incidents per 10k residents in Fond du Lac, WI compared to nearest cities:
(Note: Based on data for the last 3 years, including only cities with population 5,000 and above)
| Fond du Lac: | 34.1 |
| North Fond du Lac: | 20.6 |
| Waupun: | 33.4 |
| Oshkosh: | 18.1 |
| Mayville: | 64.6 |
| Ripon: | 49.3 |
| Plymouth: | 77.1 |
| Neenah: | 32.4 |
| West Bend: | 28.4 |
 The median response time based on all reported fire incidents is 5 minutes. This is lower compared to the state median value.
 Based on the data from the years 2002 - 2018 the average number of fire-related casualties per year is 1. The highest number of reported injuries - 4 took place in 2002, and the lowest - 0 in 2004. The data has a decreasing trend.
The average number of injuries per 1,000 fire incidents is 5. This indicator was the highest - 32 in 2002, and the lowest 0 in 2004. The trend for injuries per 1,000 fire incidents is declining. Compared to the state value the number of casualties per 1,000 fires is much lower.
Based on the data from the years 2002 - 2018 the average number of fire-related casualties per year is 1. The highest number of reported injuries - 4 took place in 2002, and the lowest - 0 in 2004. The data has a decreasing trend.
The average number of injuries per 1,000 fire incidents is 5. This indicator was the highest - 32 in 2002, and the lowest 0 in 2004. The trend for injuries per 1,000 fire incidents is declining. Compared to the state value the number of casualties per 1,000 fires is much lower.
 33.3% incidents where reported in the morning and 66.7% in the evening. The most fires (15.6%) took place on Saturday, and the least (12.0%) on Thursday.
 Based on the 2,120 fire incident reports from years 2002 - 2018 most fires (12.5%) took place during April, and the least (5.8%) in February.
 Out of all 21,441 cases reported during the years 2002 - 2018, the most belonged to the categories: Rescue & EMS (57.4%), Hazardous Condition (10.3%), and Fire (9.9%).
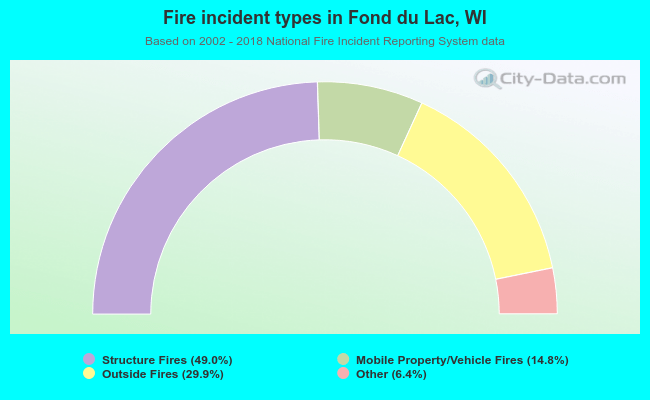 When looking into fire subcategories, the most incidents belonged to: Structure Fires (49.0%), and Outside Fires (29.9%).