Firebaugh: Fire Incidents, California (CA)
Where are fire incidents reported in Firebaugh, CA
Something went wrong! Please refresh the page.
|
| |||||||||||||||||||||||||||||||||||||||||||||||||||||||||||||||||||||||||||||||||||||||||||||||||||||||||||||
2004 - 2018 National Fire Incident Reporting System (NFIRS) incidents
- Incident types reported to NFIRS in Firebaugh, CA
- 42747.4%Fire
- 26829.8%Rescue & EMS
- 11813.1%Good Intent Call
- 556.1%Hazardous Condition
- 232.6%False Alarm
- 91.0%Service Call
- Fire incident types reported to NFIRS in Firebaugh, CA
- 25259.0%Outside Fires
- 8720.4%Mobile Property/Vehicle Fires
- 6214.5%Structure Fires
- 266.1%Other
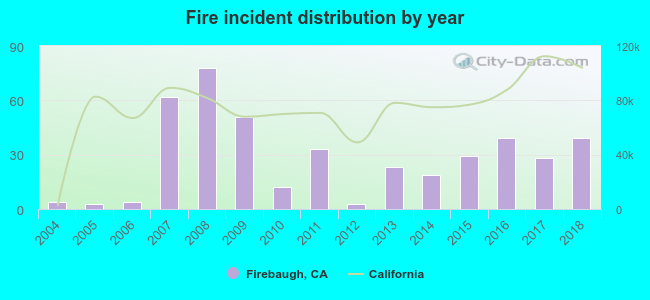 According to the data from the years 2004 - 2018 the average number of fire incidents per year is 28. The highest number of reported fire incidents - 78 took place in 2008, and the least - 3 in 2005. The data has an increasing trend.
The average number of yearly fire incidents per 10k residents in Firebaugh, CA compared to nearest cities:
(Note: Based on data for the last 3 years, including only cities with population 5,000 and above)
| Firebaugh: | 42.6 |
| Mendota: | 109.2 |
| Dos Palos: | 7.2 |
| Chowchilla: | 85.3 |
| Madera: | 19.3 |
| Madera Acres: | 1.8 |
| Kerman: | 52.3 |
| Los Banos: | 28.1 |
| Merced: | 60.0 |

 32.8% incidents where reported in the morning and 67.2% in the evening. The most fires (17.6%) took place on Sunday, and the least (11.2%) on Saturday.
 Based on the 427 incident reports from years 2004 - 2018 most fires (12.2%) took place during May, and the least (4.2%) in December.
 Out of all 900 cases reported during the years 2004 - 2018, the most belonged to the categories: Fire (47.4%), Overpressure Rupture (29.8%), and Service Call (13.1%).
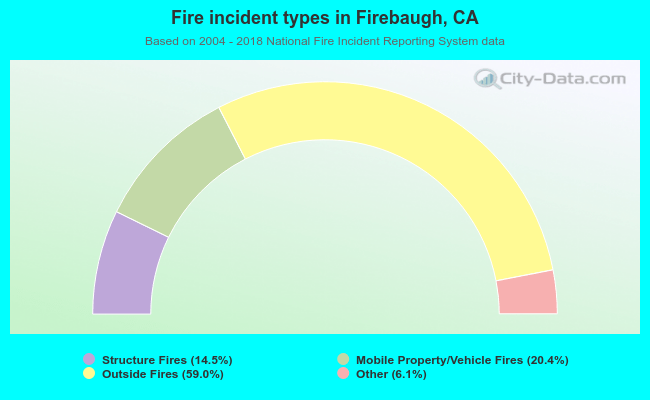 When looking into fire subcategories, the most incidents belonged to: Outside Fires (59.0%), and Mobile Property/Vehicle Fires (20.4%).