Fairfax Station: Fire Incidents, Virginia (VA)
Where are fire incidents reported in Fairfax Station, VA
Something went wrong! Please refresh the page.
|
| |||||||||||||||||||||||||||||||||||||||||||||||||||||||||||||||||||||||||||||||||||||||||||||||||||||||||||||
2009 - 2018 National Fire Incident Reporting System (NFIRS) incidents
- Incident types reported to NFIRS in Fairfax Station, VA
- 2,94561.7%Rescue & EMS
- 52811.1%Good Intent Call
- 3998.4%False Alarm
- 3076.4%Hazardous Condition
- 2896.1%Service Call
- 2825.9%Fire
- 110.2%Special Incident
- 50.1%Severe Weather
- Fire incident types reported to NFIRS in Fairfax Station, VA
- 11540.8%Structure Fires
- 11540.8%Outside Fires
- 4315.2%Mobile Property/Vehicle Fires
- 93.2%Other
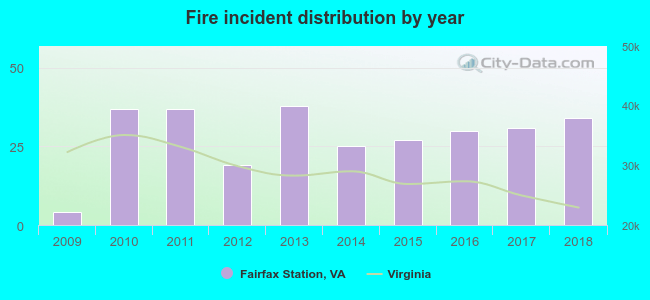 Based on the data from the years 2009 - 2018 the average number of fires per year is 28. The highest number of reported fires - 38 took place in 2013, and the least - 4 in 2009. The data has a growing trend.
The average number of yearly fire incidents per 10k residents in Fairfax Station, VA compared to nearest cities:
(Note: Based on data for the last 3 years, including only cities with population 5,000 and above)
| Fairfax Station: | 26.3 |
| Burke: | 11.0 |
| Fairfax: | 120.5 |
| West Springfield: | 11.6 |
| Oakton: | 10.0 |
| North Springfield: | 22.0 |
| Chantilly: | 39.8 |
| Annandale: | 25.5 |
| Merrifield: | 1.1 |
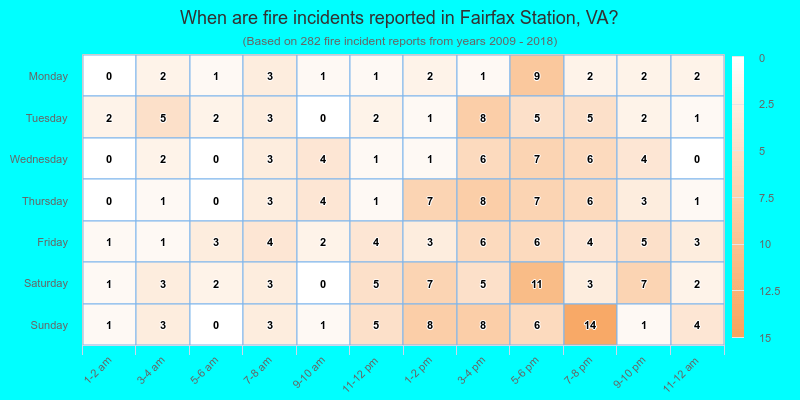
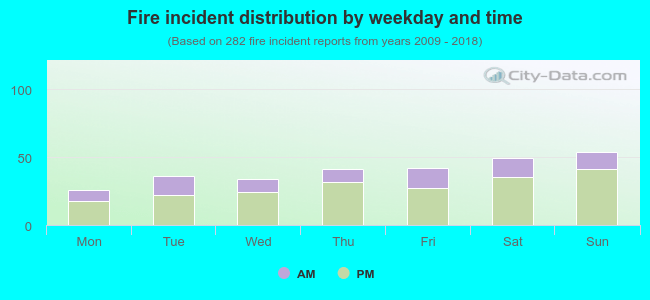 29.4% incidents where reported in the morning and 70.6% in the evening. The most fires (19.1%) took place on Sunday, and the least (9.2%) on Monday.
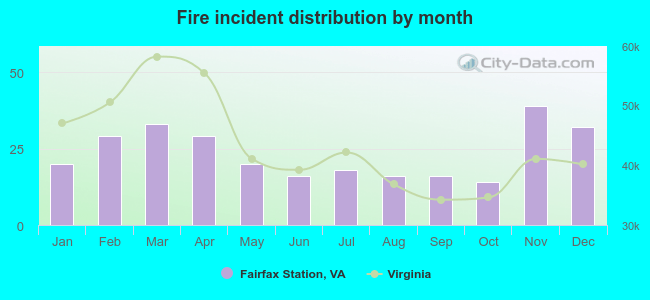 According to the 282 reports from years 2009 - 2018 most fires (13.8%) took place during November, and the least (5.0%) in October.
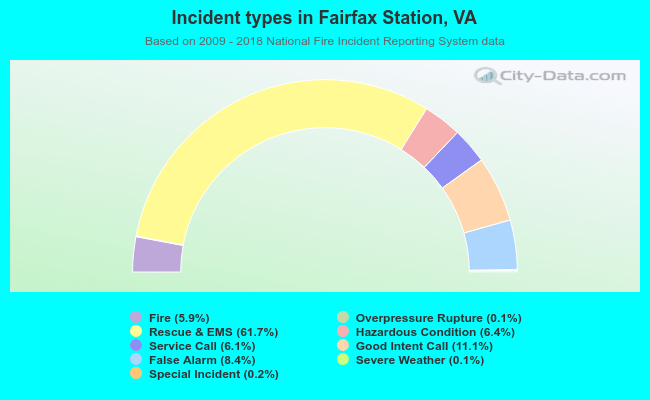 Out of all 4,770 cases reported during the years 2009 - 2018, the most belonged to the categories: Rescue & EMS (61.7%), Good Intent Call (11.1%), and False Alarm (8.4%).
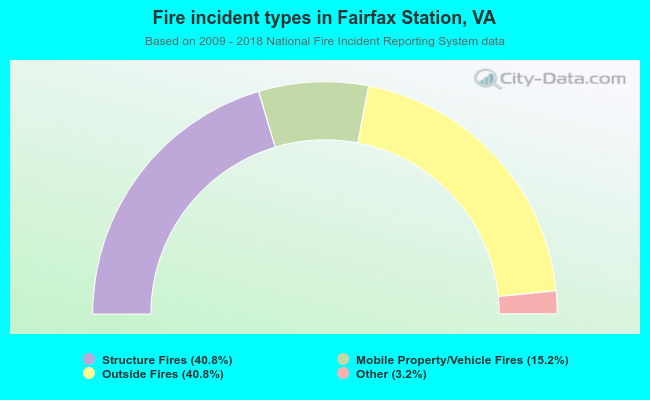 When looking into fire subcategories, the most reports belonged to: Structure Fires (40.8%), and Outside Fires (40.8%).