Euclid: Fire Incidents, Ohio (OH)
Where are fire incidents reported in Euclid, OH
Something went wrong! Please refresh the page.
| Fire incidents reported | |
|---|---|
| Sreet name | Count |
| EUCLID AVE | 512 |
| LAKE SHORE BLVD | 398 |
| LAKESHORE BLVD | 288 |
| 222 ST | 120 |
| SIDNEY DR | 104 |
| TUNGSTEN RD | 102 |
| BRUSH AVE | 100 |
| LAKELAND BLVD | 96 |
| RICHMOND RD | 86 |
| BABBITT RD | 82 |
| 222 STRE | 52 |
| 200 STRE | 50 |
| 260 STRE | 50 |
| KNUTH AVE | 50 |
| 193 STRE | 44 |
| CHARDON RD | 42 |
| ST CLAIR AVE | 40 |
| 191 STRE | 38 |
| 90 EB HWY | 34 |
| 266 STRE | 32 |
| GATEWAY DR | 32 |
| CRYSTAL AVE | 30 |
| MORRIS AVE | 28 |
| NORTH LAKELAND BLVD | 28 |
| BALL AVE | 26 |
| PRIDAY AVE | 26 |
| TRACY AVE | 24 |
| WESTPORT AVE | 24 |
| CHATWORTH DR | 22 |
| GLENBROOK BLVD | 22 |
2004 - 2018 National Fire Incident Reporting System (NFIRS) incidents
- Incident types reported to NFIRS in Euclid, OH
- 13,39556.8%Rescue & EMS
- 3,13513.3%Hazardous Condition
- 2,3219.8%Fire
- 1,9468.3%False Alarm
- 1,4626.2%Service Call
- 1,2285.2%Good Intent Call
- 470.2%Overpressure Rupture
- 250.1%Special Incident
- Fire incident types reported to NFIRS in Euclid, OH
- 1,39360.0%Structure Fires
- 61626.5%Outside Fires
- 30913.3%Mobile Property/Vehicle Fires
- 30.1%Other
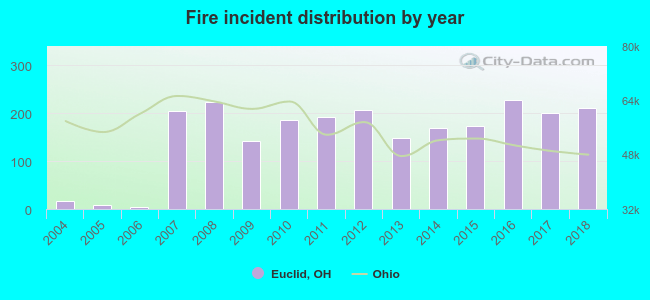 Based on the data from the years 2004 - 2018 the average number of fires per year is 154. The highest number of reported fires - 227 took place in 2016, and the least - 5 in 2006. The data has a rising trend.
The average number of yearly fire incidents per 10k residents in Euclid, OH compared to nearest cities:
(Note: Based on data for the last 3 years, including only cities with population 5,000 and above)
| Euclid: | 44.4 |
| Wickliffe: | 50.3 |
| Richmond Heights: | 52.1 |
| Willowick: | 35.7 |
| Highland Heights: | 34.7 |
| Willoughby Hills: | 56.7 |
| South Euclid: | 30.5 |
| Lyndhurst: | 28.4 |
| East Cleveland: | 85.7 |
 The median response time based on all reported fire incidents is 5 minutes. This is lower than the Ohio median value.
The median response time in Euclid, OH compared to nearest cities:
(Note: Based on data for all years, including only cities with at least 500 fire incidents)
| Euclid: | 5 minutes |
| Wickliffe: | 5 minutes |
| Willowick: | 4 minutes |
| Willoughby Hills: | 7 minutes |
| South Euclid: | 6 minutes |
| Lyndhurst: | 5 minutes |
| East Cleveland: | 3 minutes |
| Eastlake: | 5 minutes |
| Mayfield Heights: | 4 minutes |
 Based on the data from the years 2004 - 2018 the average number of fire-related fatalities per year is 0. The highest number of deaths - 1 took place in 2007, and the lowest - 0 in 2004. The data has a growing trend.
 According to the data from the years 2004 - 2018 the average number of fire-related casualties per year is 2. The highest number of reported casualties - 9 took place in 2007, and the lowest - 0 in 2004. The data has a rising trend.
The average number of casualties per 1,000 fire incidents is 13. This indicator was the highest - 44 in 2007, and the lowest 0 in 2004. The trend for injuries per 1,000 fire incidents is increasing. Compared to the state value the number of injuries per 1,000 fires is similar.
According to the data from the years 2004 - 2018 the average number of fire-related casualties per year is 2. The highest number of reported casualties - 9 took place in 2007, and the lowest - 0 in 2004. The data has a rising trend.
The average number of casualties per 1,000 fire incidents is 13. This indicator was the highest - 44 in 2007, and the lowest 0 in 2004. The trend for injuries per 1,000 fire incidents is increasing. Compared to the state value the number of injuries per 1,000 fires is similar.Casualties per 1,000 incidents in Euclid, OH compared to nearest cities:
(Note: Based on data for all years, including only cities with at least 500 fire incidents)
| Euclid: | 15.5 |
| Wickliffe: | 22.5 |
| Willowick: | 12.7 |
| Willoughby Hills: | 14.3 |
| South Euclid: | 35.4 |
| Lyndhurst: | 12.4 |
| East Cleveland: | 13.0 |
| Eastlake: | 55.6 |
| Mayfield Heights: | 5.3 |
 32.5% incidents where reported in the morning and 67.5% in the evening. The most fires (17.2%) took place on Sunday, and the least (12.0%) on Thursday.
 Based on the 2,321 fire incidents from years 2004 - 2018 most fires (12.1%) took place during May, and the least (6.2%) in February.
 Out of all 23,570 cases reported during the years 2004 - 2018, the most belonged to the categories: Rescue & EMS (56.8%), Hazardous Condition (13.3%), and Fire (9.8%).
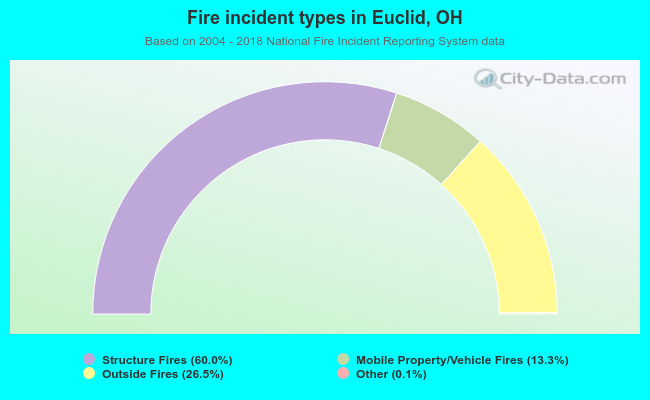 When looking into fire subcategories, the most incidents belonged to: Structure Fires (60.0%), and Outside Fires (26.5%).