Encinitas: Fire Incidents, California (CA)
Where are fire incidents reported in Encinitas, CA
Something went wrong! Please refresh the page.
| Fire incidents reported | |
|---|---|
| Sreet name | Count |
| EL CAMINO REAL | 150 |
| COAST HIGHWAY 101 | 118 |
| ENCINITAS BL | 64 |
| SANTA FE DR | 58 |
| I-5 SB | 42 |
| VULCAN AVE | 40 |
| SAN ELIJO AVE | 38 |
| GARDEN VIEW RD | 30 |
| ENCINITAS BLVD | 28 |
| I-5 NB | 28 |
| I5 NB | 28 |
| REGAL RD | 28 |
| BIRMINGHAM DR | 20 |
| BALOUR DR | 18 |
| MANCHESTER AVE | 18 |
| REQUEZA ST | 18 |
| RANCHO ENCINITAS DR | 16 |
| HYGEIA AVE | 14 |
| QUAIL GARDENS DR | 14 |
| 0 I-5 NB | 12 |
| COOLNGREEN WAY | 12 |
| CREST DR | 12 |
| GLEN ARBOR DR | 12 |
| HERMES AVE | 12 |
| LA COSTA AVE | 12 |
| MACKINNON AVE | 12 |
| MELBA RD | 12 |
| NEPTUNE AVE | 12 |
| ORPHEUS AVE | 12 |
| RANCHO SANTA FE RD | 12 |
| Other | 106 |
2005 - 2018 National Fire Incident Reporting System (NFIRS) incidents
- Incident types reported to NFIRS in Encinitas, CA
- 8,40559.1%Rescue & EMS
- 2,21815.6%Good Intent Call
- 1,1428.0%Service Call
- 1,0087.1%Fire
- 7795.5%Hazardous Condition
- 6474.5%False Alarm
- 210.1%Special Incident
- Fire incident types reported to NFIRS in Encinitas, CA
- 54454.0%Structure Fires
- 21221.0%Outside Fires
- 18418.3%Mobile Property/Vehicle Fires
- 686.7%Other
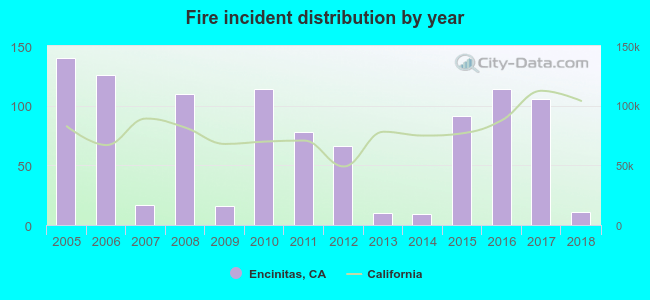 Based on the data from the years 2005 - 2018 the average number of fires per year is 72. The highest number of fire incidents - 140 took place in 2005, and the least - 9 in 2014. The data has a decreasing trend.
The average number of yearly fire incidents per 10k residents in Encinitas, CA compared to nearest cities:
(Note: Based on data for the last 3 years, including only cities with population 5,000 and above)
| Encinitas: | 12.4 |
| Solana Beach: | 36.7 |
| Carlsbad: | 13.8 |
| San Marcos: | 15.0 |
| Vista: | 24.5 |
| Oceanside: | 18.4 |
| Escondido: | 17.9 |
| Poway: | 16.2 |
| San Diego: | 15.0 |
 The median response time based on all reported fire incidents is 5 minutes. This is lower than the California median value.
The median response time in Encinitas, CA compared to nearest cities:
(Note: Based on data for all years, including only cities with at least 500 fire incidents)
| Encinitas: | 5 minutes |
| Rancho Santa Fe: | 6 minutes |
| Carlsbad: | 6 minutes |
| San Marcos: | 6 minutes |
| Vista: | 6 minutes |
| Oceanside: | 6 minutes |
| Escondido: | 6 minutes |
| San Diego: | 6 minutes |
| Santee: | 7 minutes |
 According to the reports from the years 2005 - 2018 the average number of fire-related yearly deaths is 0. The highest number of deaths - 2 took place in 2010, and the lowest - 0 in 2006. The data has a dropping trend.
 37.4% incidents where reported in the morning and 62.6% in the evening. The most fires (17.4%) took place on Monday, and the least (10.4%) on Tuesday.
 Based on the 1,008 reports from years 2005 - 2018 most fires (11.0%) took place during April, and the least (6.6%) in September.
 Out of all 14,233 cases reported during the years 2005 - 2018, the most belonged to the categories: Rescue & EMS (59.1%), Good Intent Call (15.6%), and Service Call (8.0%).
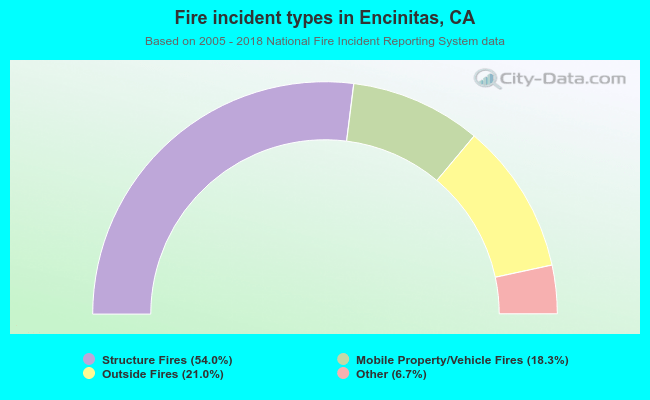 When looking into fire subcategories, the most incidents belonged to: Structure Fires (54.0%), and Outside Fires (21.0%).