El Paso: Fire Incidents, Texas (TX)
Where are fire incidents reported in El Paso, TX
Something went wrong! Please refresh the page.
| Fire incidents reported | |
|---|---|
| Sreet name | Count |
| MONTANA AVE | 410 |
| ZARAGOZA RD | 312 |
| ALAMEDA AV | 288 |
| DYER ST | 224 |
| MESA ST | 198 |
| GATEWAY WEST BL | 192 |
| ST VRAIN ST | 166 |
| MONTANA AV | 164 |
| CAROLINA DR | 162 |
| SAN ANTONIO AV | 156 |
| GATEWAY EAST BL | 126 |
| I10EAST | 124 |
| ALAMEDA AV. | 118 |
| I10WEST | 110 |
| BETEL DR | 108 |
| DONIPHAN DR | 106 |
| LOMALAND DR | 102 |
| MESA NB ST | 100 |
| VISTA DEL SOL DR | 98 |
| MESA SB ST | 92 |
| PAISANO DR | 92 |
| YANDELL DR | 92 |
| DYER NB ST | 90 |
| MYRTLE AV | 90 |
| DYER ST. | 88 |
| MONTANA EB AV | 84 |
| STANTON ST | 84 |
| DESERT BL | 82 |
| EDGEMERE BL | 76 |
| OCHOA ST | 76 |
| Other | 11,689 |
2005 - 2018 National Fire Incident Reporting System (NFIRS) incidents
- Incident types reported to NFIRS in El Paso, TX
- 146,69660.0%Rescue & EMS
- 32,69513.4%Service Call
- 26,54710.9%Good Intent Call
- 15,8996.5%Fire
- 15,1646.2%Hazardous Condition
- 7,3383.0%False Alarm
- Fire incident types reported to NFIRS in El Paso, TX
- 6,66641.9%Structure Fires
- 6,07738.2%Outside Fires
- 2,90018.2%Mobile Property/Vehicle Fires
- 2561.6%Other
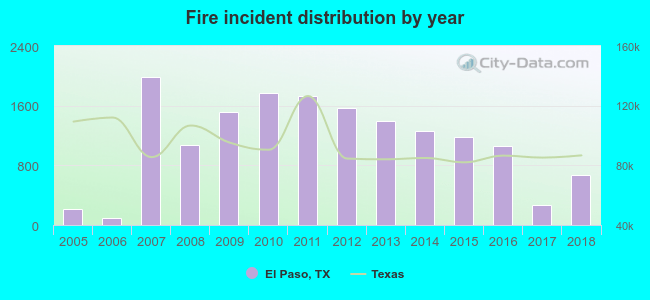 Based on the data from the years 2005 - 2018 the average number of fire incidents per year is 1,128. The highest number of reported fires - 1,982 took place in 2007, and the least - 88 in 2006. The data has a growing trend.
The average number of yearly fire incidents per 10k residents in El Paso, TX compared to nearest cities:
(Note: Based on data for the last 3 years, including only cities with population 5,000 and above)
| El Paso: | 9.8 |
| Fort Bliss: | 4.1 |
| Socorro: | 5.4 |
| Canutillo: | 61.2 |
| Horizon City: | 35.9 |
| San Elizario: | 6.6 |
| Anthony: | 41.8 |
| Fabens: | 58.5 |
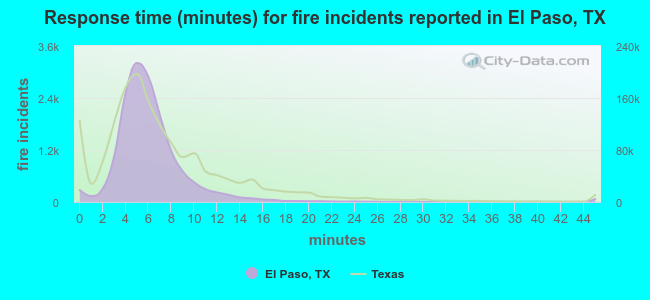 The median response time based on all reported fire incidents is 6 minutes. This is about the same as the state median value.
The median response time in El Paso, TX compared to nearest cities:
(Note: Based on data for all years, including only cities with at least 500 fire incidents)
| El Paso: | 6 minutes |
| Socorro: | 8 minutes |
| Canutillo: | 6 minutes |
| Horizon City: | 7 minutes |
| Chaparral: | 8 minutes |
| Clint: | 10 minutes |
| Anthony: | 12 minutes |
| Las Cruces: | 6 minutes |
| Alamogordo: | 5 minutes |
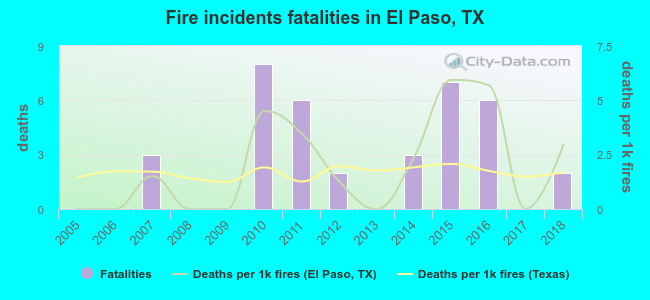 According to the reports from the years 2005 - 2018 the average number of fire-related fatalities per year is 3. The highest number of deaths - 8 took place in 2010, and the lowest - 0 in 2005. The data has a growing trend.
The average number of deaths per 1,000 fires is 2. This indicator was the highest - 6 in 2015, and the lowest 0 in 2005. The trend for fatalities per 1,000 incidents is rising. Compared to the state value the number of fatalities per 1,000 fires is higher.
According to the reports from the years 2005 - 2018 the average number of fire-related fatalities per year is 3. The highest number of deaths - 8 took place in 2010, and the lowest - 0 in 2005. The data has a growing trend.
The average number of deaths per 1,000 fires is 2. This indicator was the highest - 6 in 2015, and the lowest 0 in 2005. The trend for fatalities per 1,000 incidents is rising. Compared to the state value the number of fatalities per 1,000 fires is higher.Deaths per 1,000 incidents in El Paso, TX compared to nearest cities:
(Note: Based on data for all years, including only cities with at least 2,500 fire incidents)
| El Paso: | 2.3 |
| Las Cruces: | 0.3 |
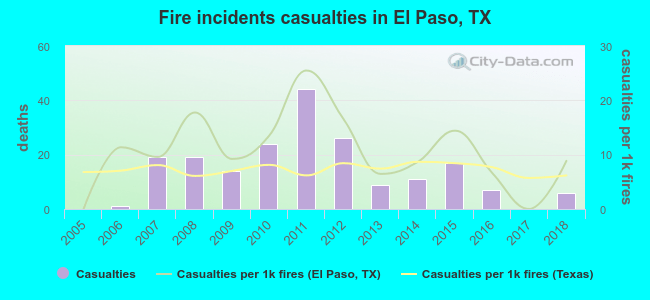 Based on the data from the years 2005 - 2018 the average number of fire-related casualties per year is 14. The highest number of casualties - 44 took place in 2011, and the lowest - 0 in 2005. The data has a growing trend.
The average number of casualties per 1,000 fires is 11. This indicator was the highest - 25 in 2011, and the lowest 0 in 2005. The trend for injuries per 1,000 incidents is increasing. Compared to the Texas value the number of injuries per 1,000 incidents is higher.
Based on the data from the years 2005 - 2018 the average number of fire-related casualties per year is 14. The highest number of casualties - 44 took place in 2011, and the lowest - 0 in 2005. The data has a growing trend.
The average number of casualties per 1,000 fires is 11. This indicator was the highest - 25 in 2011, and the lowest 0 in 2005. The trend for injuries per 1,000 incidents is increasing. Compared to the Texas value the number of injuries per 1,000 incidents is higher.Casualties per 1,000 incidents in El Paso, TX compared to nearest cities:
(Note: Based on data for all years, including only cities with at least 500 fire incidents)
| El Paso: | 12.5 |
| Socorro: | 1.7 |
| Canutillo: | 2.8 |
| Horizon City: | 2.6 |
| Chaparral: | 0.0 |
| Clint: | 0.0 |
| Anthony: | 0.0 |
| Las Cruces: | 3.1 |
| Alamogordo: | 4.9 |
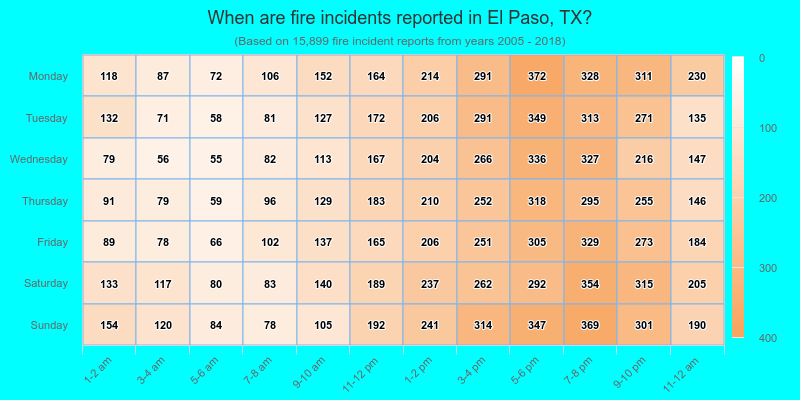
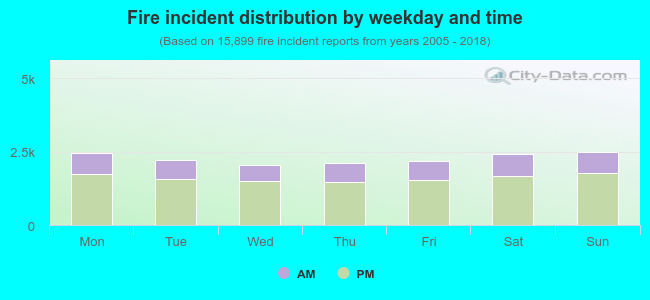 29.2% incidents where reported in the morning and 70.8% in the evening. The most fires (15.7%) took place on Sunday, and the least (12.9%) on Wednesday.
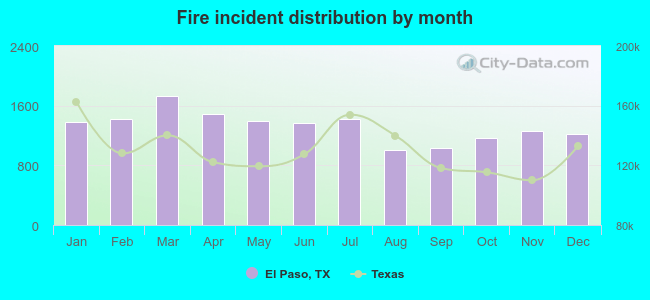 According to the 15,899 fire incidents from years 2005 - 2018 most fires (10.8%) took place during March, and the least (6.3%) in August.
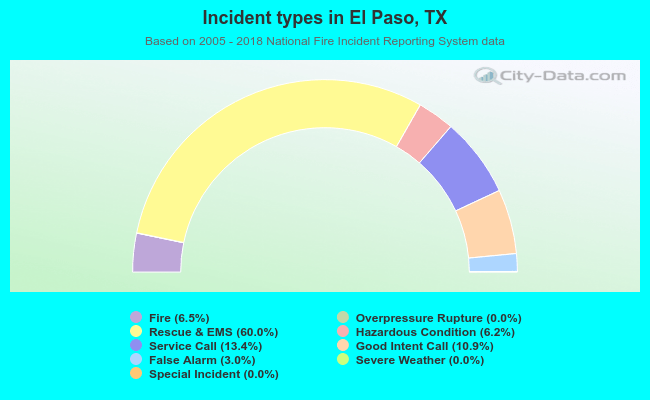 Out of all 244,563 cases reported during the years 2005 - 2018, the most belonged to the categories: Rescue & EMS (60.0%), Service Call (13.4%), and Good Intent Call (10.9%).
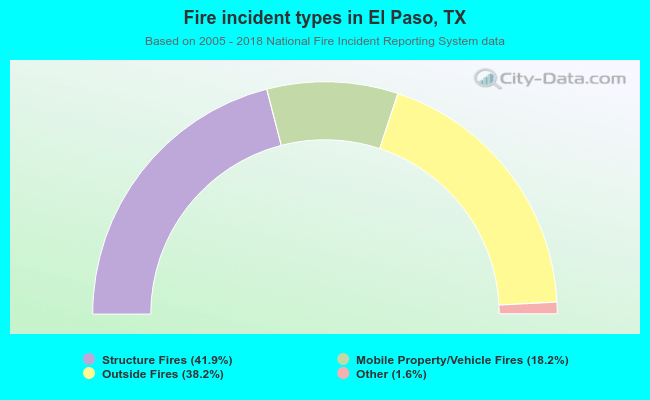 When looking into fire subcategories, the most reports belonged to: Structure Fires (41.9%), and Outside Fires (38.2%).