El Dorado: Fire Incidents, Arkansas (AR)
Where are fire incidents reported in El Dorado, AR
Something went wrong! Please refresh the page.
| Fire incidents reported | |
|---|---|
| Sreet name | Count |
| WEST AVE | 134 |
| HILLSBORO | 82 |
| COOK ST | 36 |
| MAIN ST | 36 |
| PECAN | 36 |
| CEDAR ST | 32 |
| 1ST ST | 30 |
| MAIN | 30 |
| 82 BYPASS | 28 |
| BLOCK ST | 28 |
| HAYNESVILLE HWY | 28 |
| 19TH ST | 26 |
| COLLEGE AVE | 26 |
| JACKSON | 26 |
| NEWTON | 26 |
| OAK | 26 |
| ROBERT E LEE | 26 |
| CEDAR | 24 |
| SMACKOVER HWY | 24 |
| STRONG HWY | 24 |
| BLOCK | 22 |
| FAULKNER | 22 |
| JACKSON ST | 22 |
| MORO BAY HWY | 22 |
| 7 HWY | 20 |
| CRAIG ST | 20 |
| GAS PLANT RD | 20 |
| HAWTHORNE | 20 |
| JUNCTION CITY HWY | 20 |
| 167 HWY | 18 |
| Other | 2,141 |
2002 - 2018 National Fire Incident Reporting System (NFIRS) incidents
- Incident types reported to NFIRS in El Dorado, AR
- 3,07544.0%Fire
- 1,32519.0%Hazardous Condition
- 1,10315.8%Rescue & EMS
- 4927.0%False Alarm
- 4836.9%Service Call
- 4176.0%Good Intent Call
- 390.6%Severe Weather
- 300.4%Special Incident
- 230.3%Overpressure Rupture
- Fire incident types reported to NFIRS in El Dorado, AR
- 1,34443.7%Outside Fires
- 1,12936.7%Structure Fires
- 45414.8%Mobile Property/Vehicle Fires
- 1484.8%Other
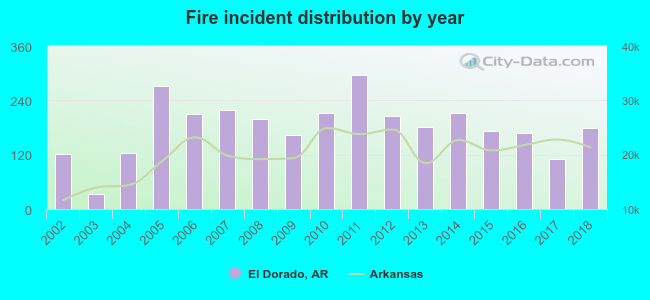 Based on the data from the years 2002 - 2018 the average number of fire incidents per year is 181. The highest number of fire incidents - 295 took place in 2011, and the least - 34 in 2003. The data has a rising trend.
 The median response time based on all reported fire incidents is 4 minutes. This is lower compared to the Arkansas median value.
 Based on the reports from the years 2002 - 2018 the average number of fire-related yearly deaths is 1. The highest number of deaths - 3 took place in 2005, and the lowest - 0 in 2002. The data has a constant trend.
The average number of fatalities per 1,000 fire incidents is 4. This indicator was the highest - 18 in 2016, and the lowest 0 in 2002. The trend for deaths per 1,000 fire incidents is dropping. Compared to the Arkansas value the number of fatalities per 1,000 fires is much higher.
Based on the reports from the years 2002 - 2018 the average number of fire-related yearly deaths is 1. The highest number of deaths - 3 took place in 2005, and the lowest - 0 in 2002. The data has a constant trend.
The average number of fatalities per 1,000 fire incidents is 4. This indicator was the highest - 18 in 2016, and the lowest 0 in 2002. The trend for deaths per 1,000 fire incidents is dropping. Compared to the Arkansas value the number of fatalities per 1,000 fires is much higher.Deaths per 1,000 incidents in El Dorado, AR compared to nearest cities:
(Note: Based on data for all years, including only cities with at least 2,500 fire incidents)
| El Dorado: | 4.6 |
 Based on the reports from the years 2002 - 2018 the average number of fire-related yearly casualties is 1. The highest number of casualties - 4 took place in 2012, and the lowest - 0 in 2002. The data has a growing trend.
The average number of casualties per 1,000 fires is 8. This indicator was the highest - 36 in 2017, and the lowest 0 in 2002. The trend for injuries per 1,000 fires is rising. Compared to the Arkansas value the number of injuries per 1,000 fire incidents is similar.
Based on the reports from the years 2002 - 2018 the average number of fire-related yearly casualties is 1. The highest number of casualties - 4 took place in 2012, and the lowest - 0 in 2002. The data has a growing trend.
The average number of casualties per 1,000 fires is 8. This indicator was the highest - 36 in 2017, and the lowest 0 in 2002. The trend for injuries per 1,000 fires is rising. Compared to the Arkansas value the number of injuries per 1,000 fire incidents is similar.
 29.6% incidents where reported in the morning and 70.4% in the evening. The most fires (16.1%) took place on Monday, and the least (13.0%) on Sunday.
 Based on the 3,075 incident reports from years 2002 - 2018 most fires (10.2%) took place during March, and the least (6.5%) in November.
 Out of all 6,987 cases reported during the years 2002 - 2018, the most belonged to the categories: Fire (44.0%), Hazardous Condition (19.0%), and Rescue & EMS (15.8%).
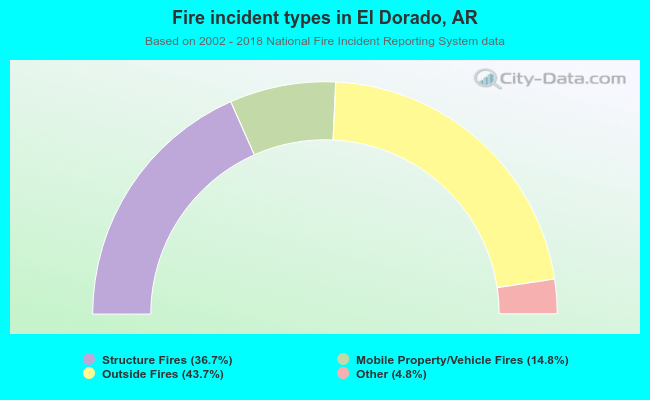 When looking into fire subcategories, the most reports belonged to: Outside Fires (43.7%), and Structure Fires (36.7%).