Edinburg: Fire Incidents, Texas (TX)
Where are fire incidents reported in Edinburg, TX
Something went wrong! Please refresh the page.
| Fire incidents reported | |
|---|---|
| Sreet name | Count |
| UNIVERSITY DR | 406 |
| MONTE CRISTO RD | 374 |
| EXPRESSWAY 281 | 254 |
| DOOLITTLE | 228 |
| TRENTON RD | 226 |
| SUGAR RD | 214 |
| CLOSNER BLVD | 200 |
| ALAMO RD | 184 |
| CLOSNER | 164 |
| ROGERS RD | 144 |
| FM 2812 | 136 |
| CANTON RD | 132 |
| FREDDY GONZALEZ DR | 128 |
| SCHUNIOR | 126 |
| TOWER RD | 126 |
| MCCOLL | 122 |
| JACKSON RD | 118 |
| MCCOLL RD | 94 |
| RAUL LONGORIA RD | 90 |
| 281 | 84 |
| OWASSA RD | 84 |
| ALBERTA RD | 82 |
| HWY 107 | 78 |
| SCHUNIOR ST | 78 |
| SPRAGUE ST | 76 |
| TEXAS RD | 76 |
| DOOLITTLE RD | 74 |
| 25TH ST | 72 |
| 24TH ST | 70 |
| CANO ST | 70 |
| Other | 3,384 |
2002 - 2018 National Fire Incident Reporting System (NFIRS) incidents
- Incident types reported to NFIRS in Edinburg, TX
- 7,69434.9%Fire
- 5,80226.3%Hazardous Condition
- 3,00513.6%Service Call
- 2,93613.3%False Alarm
- 1,4566.6%Rescue & EMS
- 1,0294.7%Good Intent Call
- 550.2%Severe Weather
- 440.2%Special Incident
- Fire incident types reported to NFIRS in Edinburg, TX
- 4,61059.9%Outside Fires
- 1,70222.1%Mobile Property/Vehicle Fires
- 1,22715.9%Structure Fires
- 1552.0%Other
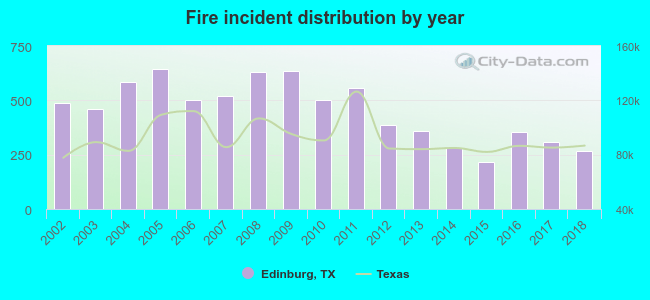 Based on the data from the years 2002 - 2018 the average number of fire incidents per year is 453. The highest number of reported fire incidents - 642 took place in 2005, and the least - 217 in 2015. The data has a declining trend.
 The median response time based on all reported fire incidents is 7 minutes. This is about the same as the state median value.
The median response time in Edinburg, TX compared to nearest cities:
(Note: Based on data for all years, including only cities with at least 500 fire incidents)
| Edinburg: | 7 minutes |
| Pharr: | 4 minutes |
| McAllen: | 5 minutes |
| San Juan: | 5 minutes |
| Alamo: | 5 minutes |
| Elsa: | 5 minutes |
| Mission: | 6 minutes |
| Palmview: | 6 minutes |
| Weslaco: | 7 minutes |
 Based on the data from the years 2002 - 2018 the average number of fire-related fatalities per year is 0. The highest number of deaths - 2 took place in 2003, and the lowest - 0 in 2002. The data has a constant trend.
The average number of deaths per 1,000 fire incidents is 1. This indicator was the highest - 4 in 2003, and the lowest 0 in 2002. The trend for deaths per 1,000 fire incidents is constant. Compared to the Texas value the number of deaths per 1,000 incidents is much lower.
Based on the data from the years 2002 - 2018 the average number of fire-related fatalities per year is 0. The highest number of deaths - 2 took place in 2003, and the lowest - 0 in 2002. The data has a constant trend.
The average number of deaths per 1,000 fire incidents is 1. This indicator was the highest - 4 in 2003, and the lowest 0 in 2002. The trend for deaths per 1,000 fire incidents is constant. Compared to the Texas value the number of deaths per 1,000 incidents is much lower.
 Based on the reports from the years 2002 - 2018 the average number of fire-related casualties per year is 1. The highest number of reported injuries - 7 took place in 2007, and the lowest - 0 in 2003. The data has a constant trend.
The average number of injuries per 1,000 fires is 2. This indicator was the highest - 13 in 2007, and the lowest 0 in 2003. The trend for casualties per 1,000 incidents is increasing. Compared to the Texas value the number of casualties per 1,000 fire incidents is much lower.
Based on the reports from the years 2002 - 2018 the average number of fire-related casualties per year is 1. The highest number of reported injuries - 7 took place in 2007, and the lowest - 0 in 2003. The data has a constant trend.
The average number of injuries per 1,000 fires is 2. This indicator was the highest - 13 in 2007, and the lowest 0 in 2003. The trend for casualties per 1,000 incidents is increasing. Compared to the Texas value the number of casualties per 1,000 fire incidents is much lower.
 28.6% incidents where reported in the morning and 71.4% in the evening. The most fires (15.3%) took place on Monday, and the least (12.8%) on Thursday.
 According to the 7,694 fire incidents from years 2002 - 2018 most fires (10.3%) took place during January, and the least (6.1%) in September.
 Out of all 22,026 cases reported during the years 2002 - 2018, the most belonged to the categories: Fire (34.9%), Hazardous Condition (26.3%), and Service Call (13.6%).
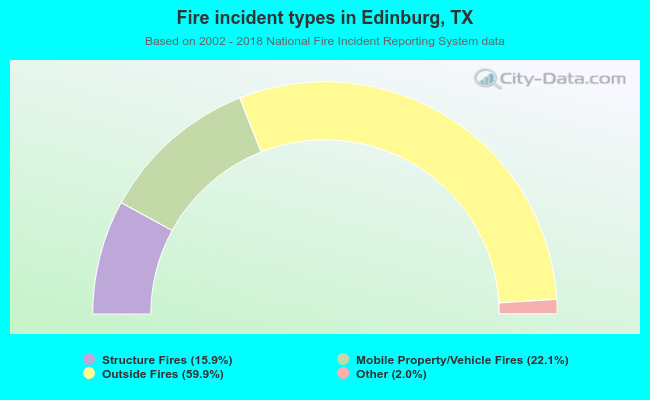 When looking into fire subcategories, the most incidents belonged to: Outside Fires (59.9%), and Mobile Property/Vehicle Fires (22.1%).