Durham: Fire Incidents, North Carolina (NC)
Where are fire incidents reported in Durham, NC
Something went wrong! Please refresh the page.
| Fire incidents reported | |
|---|---|
| Sreet name | Count |
| ROXBORO ST | 394 |
| MIAMI BLVD | 330 |
| ANGIER AVE | 230 |
| ALSTON AVE | 220 |
| CHEEK RD | 220 |
| GEER ST | 208 |
| FAYETTEVILLE RD | 204 |
| HOLLOWAY ST | 196 |
| MAIN ST | 184 |
| CORNWALLIS RD | 180 |
| GUESS RD | 180 |
| DUKE ST | 178 |
| UNIVERSITY DR | 172 |
| CLUB BLVD | 170 |
| FAYETTEVILLE ST | 158 |
| I40 | 150 |
| GARRETT RD | 146 |
| NC 55 HWY | 146 |
| DURHAM FREEWAY | 144 |
| LIBERTY ST | 140 |
| CHAPEL HILL RD | 138 |
| MINERAL SPRINGS RD | 128 |
| LASALLE ST | 120 |
| HILLSBOROUGH RD | 118 |
| I85 | 118 |
| DURHAM CHAPEL HILL BLVD | 116 |
| MERIWETHER DR | 116 |
| NC 54 HWY | 114 |
| ROXBORO RD | 106 |
| WAKE FOREST HWY | 102 |
| Other | 6,929 |
2002 - 2018 National Fire Incident Reporting System (NFIRS) incidents
- Incident types reported to NFIRS in Durham, NC
- 62,28653.7%Rescue & EMS
- 15,45013.3%Good Intent Call
- 14,65812.6%False Alarm
- 12,05510.4%Fire
- 7,9166.8%Hazardous Condition
- 3,0572.6%Service Call
- 3450.3%Overpressure Rupture
- 1430.1%Special Incident
- 1340.1%Severe Weather
- Fire incident types reported to NFIRS in Durham, NC
- 5,19943.1%Structure Fires
- 4,10134.0%Outside Fires
- 2,04817.0%Mobile Property/Vehicle Fires
- 7075.9%Other
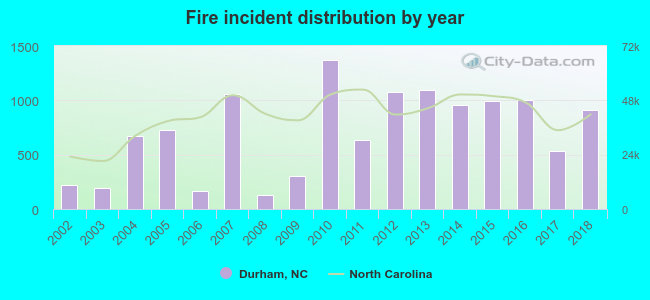 According to the data from the years 2002 - 2018 the average number of fires per year is 709. The highest number of fire incidents - 1,372 took place in 2010, and the least - 125 in 2008. The data has a growing trend.
The average number of yearly fire incidents per 10k residents in Durham, NC compared to nearest cities:
(Note: Based on data for the last 3 years, including only cities with population 5,000 and above)
| Durham: | 32.5 |
| Chapel Hill: | 39.1 |
| Carrboro: | 29.5 |
| Morrisville: | 25.0 |
| Hillsborough: | 146.6 |
| Butner: | 13.0 |
| Cary: | 16.8 |
| Apex: | 26.2 |
| Raleigh: | 24.8 |
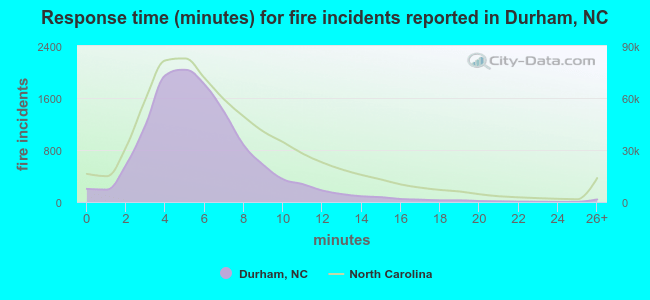 The median response time based on all reported fire incidents is 5 minutes. This is lower than the state median value.
The median response time in Durham, NC compared to nearest cities:
(Note: Based on data for all years, including only cities with at least 500 fire incidents)
| Durham: | 5 minutes |
| Chapel Hill: | 5 minutes |
| Carrboro: | 4 minutes |
| Morrisville: | 6 minutes |
| Hillsborough: | 8 minutes |
| Creedmoor: | 8 minutes |
| Cary: | 5 minutes |
| Apex: | 6 minutes |
| Raleigh: | 5 minutes |
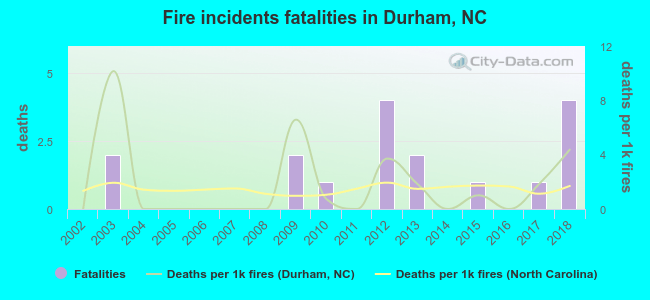 According to the reports from the years 2002 - 2018 the average number of fire-related yearly deaths is 1. The highest number of deaths - 4 took place in 2012, and the lowest - 0 in 2002. The data has a growing trend.
The average number of fatalities per 1,000 fires is 2. This indicator was the highest - 10 in 2003, and the lowest 0 in 2002. The trend for fatalities per 1,000 incidents is increasing. Compared to the North Carolina value the number of fatalities per 1,000 incidents is about the same.
According to the reports from the years 2002 - 2018 the average number of fire-related yearly deaths is 1. The highest number of deaths - 4 took place in 2012, and the lowest - 0 in 2002. The data has a growing trend.
The average number of fatalities per 1,000 fires is 2. This indicator was the highest - 10 in 2003, and the lowest 0 in 2002. The trend for fatalities per 1,000 incidents is increasing. Compared to the North Carolina value the number of fatalities per 1,000 incidents is about the same.Deaths per 1,000 incidents in Durham, NC compared to nearest cities:
(Note: Based on data for all years, including only cities with at least 2,500 fire incidents)
| Durham: | 1.4 |
| Chapel Hill: | 0.5 |
| Cary: | 1.1 |
| Raleigh: | 0.6 |
| Wake Forest: | 0.0 |
| Garner: | 1.6 |
| Burlington: | 2.0 |
| Clayton: | 0.0 |
| Henderson: | 1.6 |
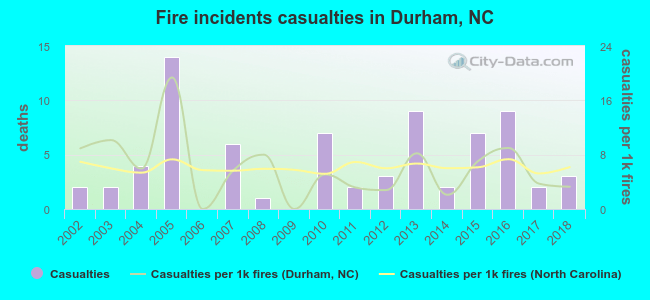 According to the reports from the years 2002 - 2018 the average number of fire-related casualties per year is 4. The highest number of injuries - 14 took place in 2005, and the lowest - 0 in 2006. The data has a growing trend.
The average number of casualties per 1,000 fire incidents is 6. This indicator was the highest - 19 in 2005, and the lowest 0 in 2006. The trend for injuries per 1,000 incidents is dropping. Compared to the North Carolina value the number of injuries per 1,000 fire incidents is similar.
According to the reports from the years 2002 - 2018 the average number of fire-related casualties per year is 4. The highest number of injuries - 14 took place in 2005, and the lowest - 0 in 2006. The data has a growing trend.
The average number of casualties per 1,000 fire incidents is 6. This indicator was the highest - 19 in 2005, and the lowest 0 in 2006. The trend for injuries per 1,000 incidents is dropping. Compared to the North Carolina value the number of injuries per 1,000 fire incidents is similar.Casualties per 1,000 incidents in Durham, NC compared to nearest cities:
(Note: Based on data for all years, including only cities with at least 500 fire incidents)
| Durham: | 6.1 |
| Chapel Hill: | 13.5 |
| Carrboro: | 17.5 |
| Morrisville: | 6.8 |
| Hillsborough: | 1.4 |
| Creedmoor: | 8.9 |
| Cary: | 12.2 |
| Apex: | 6.6 |
| Raleigh: | 7.0 |
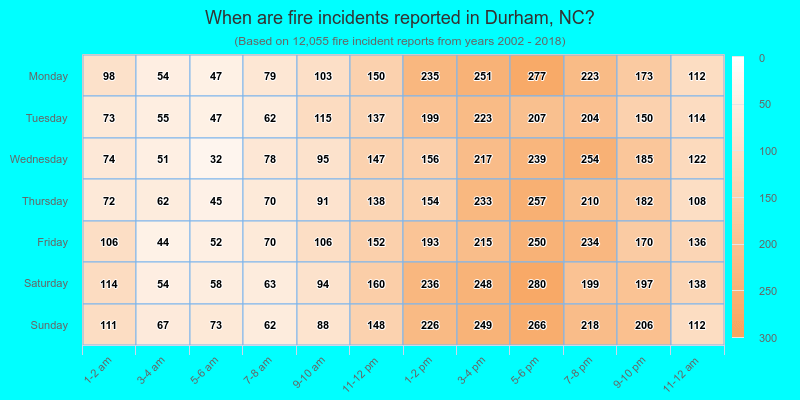
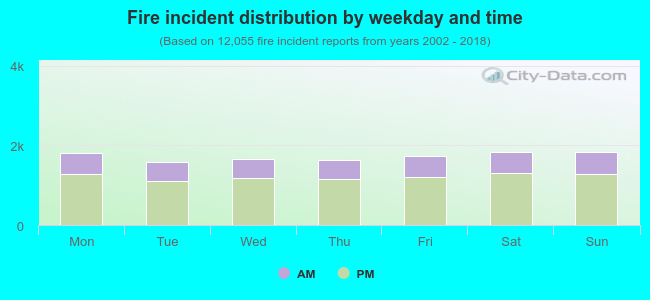 29.8% incidents where reported in the morning and 70.2% in the evening. The most fires (15.3%) took place on Saturday, and the least (13.2%) on Tuesday.
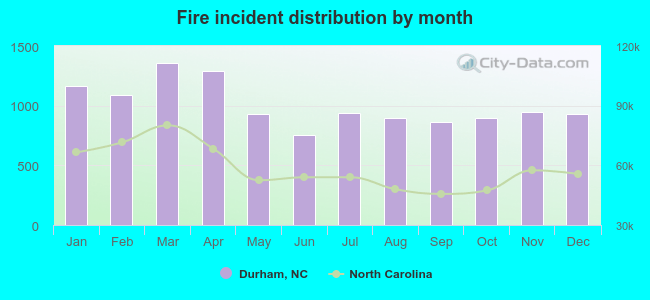 Based on the 12,055 fire incident reports from years 2002 - 2018 most fires (11.2%) took place during March, and the least (6.3%) in June.
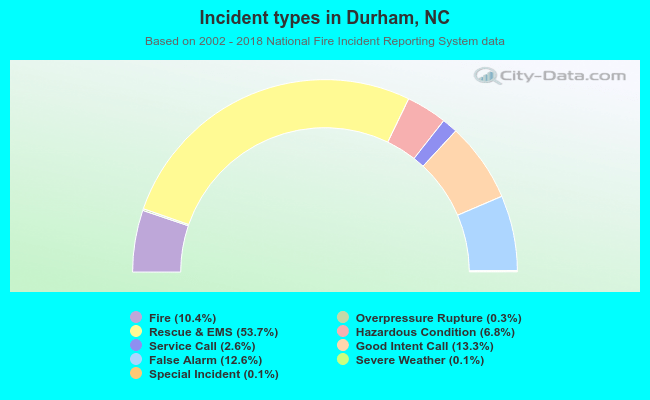 Out of all 116,044 cases reported during the years 2002 - 2018, the most belonged to the categories: Rescue & EMS (53.7%), Good Intent Call (13.3%), and False Alarm (12.6%).
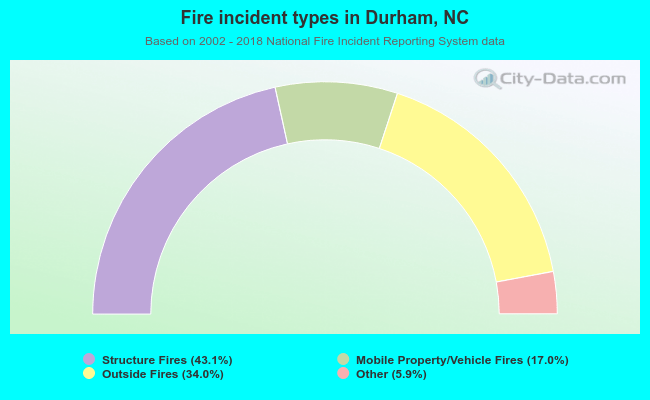 When looking into fire subcategories, the most reports belonged to: Structure Fires (43.1%), and Outside Fires (34.0%).