Decatur: Fire Incidents, Illinois (IL)
Where are fire incidents reported in Decatur, IL
Something went wrong! Please refresh the page.
| Fire incidents reported | |
|---|---|
| Sreet name | Count |
| MAIN ST | 432 |
| WOOD ST | 314 |
| WILLIAM ST | 240 |
| ELDORADO ST | 220 |
| WATER ST | 206 |
| ML KING JR DR | 170 |
| MONROE ST | 166 |
| CHURCH ST | 160 |
| GRAND AVE | 158 |
| DECATUR ST | 134 |
| PERSHING RD | 134 |
| DIVISION ST | 128 |
| 22ND ST | 126 |
| NORTH ST | 124 |
| PRAIRIE AVE | 120 |
| WOODFORD ST | 118 |
| EDWARD ST | 116 |
| OLIVE ST | 112 |
| UNION ST | 112 |
| CENTER ST | 108 |
| MACON ST | 102 |
| MARIETTA ST | 100 |
| COLLEGE ST | 98 |
| JASPER ST | 98 |
| KING ST | 94 |
| TAYLORVILLE RD | 92 |
| WYCKLES RD | 88 |
| CONDIT ST | 84 |
| HICKORY ST | 82 |
| ROCK SPRINGS RD | 82 |
| Other | 2,004 |
2002 - 2018 National Fire Incident Reporting System (NFIRS) incidents
- Incident types reported to NFIRS in Decatur, IL
- 33,97351.5%Rescue & EMS
- 8,04412.2%Hazardous Condition
- 7,94012.0%Good Intent Call
- 6,4889.8%Service Call
- 6,3229.6%Fire
- 3,1204.7%False Alarm
- Fire incident types reported to NFIRS in Decatur, IL
- 3,15649.9%Structure Fires
- 1,91830.3%Outside Fires
- 1,12017.7%Mobile Property/Vehicle Fires
- 1282.0%Other
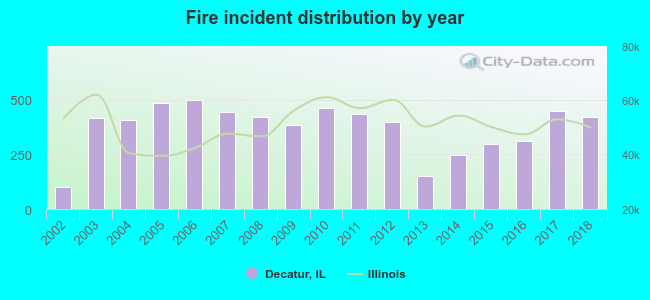 According to the data from the years 2002 - 2018 the average number of fires per year is 372. The highest number of reported fires - 497 took place in 2006, and the least - 99 in 2002. The data has an increasing trend.
The average number of yearly fire incidents per 10k residents in Decatur, IL compared to nearest cities:
(Note: Based on data for the last 3 years, including only cities with population 5,000 and above)
| Decatur: | 53.1 |
| Clinton: | 133.3 |
| Monticello: | 35.0 |
| Taylorville: | 94.2 |
| Lincoln: | 103.6 |
| Pana: | 92.5 |
 The median response time based on all reported fire incidents is 5 minutes. This is about the same as the Illinois median value.
The median response time in Decatur, IL compared to nearest cities:
(Note: Based on data for all years, including only cities with at least 500 fire incidents)
| Decatur: | 5 minutes |
| Clinton: | 8 minutes |
| Sullivan: | 7 minutes |
| Taylorville: | 6 minutes |
| Lincoln: | 5 minutes |
| Shelbyville: | 6 minutes |
| Pana: | 7 minutes |
| Sherman: | 9 minutes |
 According to the data from the years 2002 - 2018 the average number of fire-related fatalities per year is 2. The highest number of deaths - 9 took place in 2003, and the lowest - 0 in 2002. The data has a rising trend.
The average number of deaths per 1,000 fires is 5. This indicator was the highest - 22 in 2003, and the lowest 0 in 2002. The trend for fatalities per 1,000 fires is increasing. Compared to the Illinois value the number of fatalities per 1,000 fire incidents is much higher.
According to the data from the years 2002 - 2018 the average number of fire-related fatalities per year is 2. The highest number of deaths - 9 took place in 2003, and the lowest - 0 in 2002. The data has a rising trend.
The average number of deaths per 1,000 fires is 5. This indicator was the highest - 22 in 2003, and the lowest 0 in 2002. The trend for fatalities per 1,000 fires is increasing. Compared to the Illinois value the number of fatalities per 1,000 fire incidents is much higher.Deaths per 1,000 incidents in Decatur, IL compared to nearest cities:
(Note: Based on data for all years, including only cities with at least 2,500 fire incidents)
| Decatur: | 5.2 |
 Based on the data from the years 2002 - 2018 the average number of fire-related yearly casualties is 13. The highest number of injuries - 26 took place in 2005, and the lowest - 0 in 2013. The data has a growing trend.
The average number of injuries per 1,000 fires is 31. This indicator was the highest - 64 in 2016, and the lowest 0 in 2013. The trend for casualties per 1,000 fires is growing. Compared to the state value the number of injuries per 1,000 incidents is much higher.
Based on the data from the years 2002 - 2018 the average number of fire-related yearly casualties is 13. The highest number of injuries - 26 took place in 2005, and the lowest - 0 in 2013. The data has a growing trend.
The average number of injuries per 1,000 fires is 31. This indicator was the highest - 64 in 2016, and the lowest 0 in 2013. The trend for casualties per 1,000 fires is growing. Compared to the state value the number of injuries per 1,000 incidents is much higher.Casualties per 1,000 incidents in Decatur, IL compared to nearest cities:
(Note: Based on data for all years, including only cities with at least 500 fire incidents)
| Decatur: | 34.3 |
| Clinton: | 5.0 |
| Sullivan: | 11.1 |
| Taylorville: | 9.2 |
| Lincoln: | 15.2 |
| Shelbyville: | 5.9 |
| Pana: | 16.0 |
| Sherman: | 5.8 |
 33.6% incidents where reported in the morning and 66.4% in the evening. The most fires (15.2%) took place on Saturday, and the least (13.4%) on Wednesday.
 Based on the 6,322 incident reports from years 2002 - 2018 most fires (10.0%) took place during April, and the least (6.5%) in February.
 Out of all 65,969 cases reported during the years 2002 - 2018, the most belonged to the categories: Rescue & EMS (51.5%), Hazardous Condition (12.2%), and Good Intent Call (12.0%).
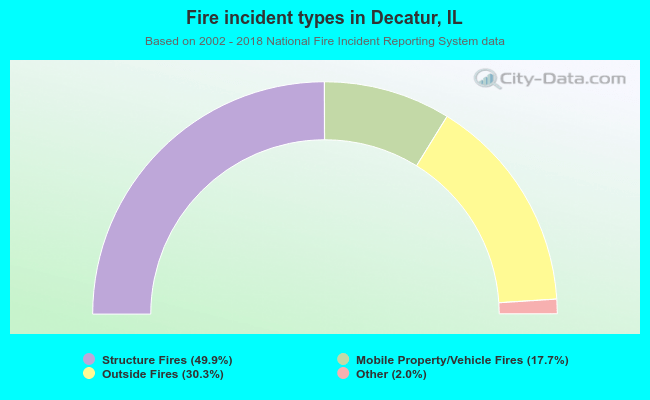 When looking into fire subcategories, the most reports belonged to: Structure Fires (49.9%), and Outside Fires (30.3%).