Davenport: Fire Incidents, Iowa (IA)
Where are fire incidents reported in Davenport, IA
Something went wrong! Please refresh the page.
| Fire incidents reported | |
|---|---|
| Sreet name | Count |
| LOCUST ST | 220 |
| 3RD ST | 178 |
| KIMBERLY RD | 162 |
| 6TH ST | 160 |
| 4TH ST | 154 |
| 53RD ST | 138 |
| RIVER DR | 130 |
| ROCKINGHAM RD | 110 |
| 14TH ST | 106 |
| BRADY ST | 104 |
| DIVISION ST | 98 |
| 15TH ST | 88 |
| MARQUETTE ST | 80 |
| HARRISON ST | 76 |
| HEATHERTON DR | 76 |
| EMERALD DR | 74 |
| 12TH ST | 68 |
| 5TH ST | 66 |
| 8TH ST | 62 |
| GAINES ST | 62 |
| 2ND ST | 60 |
| 7TH ST | 60 |
| ELMORE AVE | 60 |
| MAIN ST | 56 |
| CONCORD ST | 50 |
| 13TH ST | 48 |
| 35TH ST | 48 |
| JERSEY RIDGE RD | 48 |
| HILLANDALE RD | 46 |
| FILLMORE ST | 44 |
| Other | 257 |
2002 - 2017 National Fire Incident Reporting System (NFIRS) incidents
- Incident types reported to NFIRS in Davenport, IA
- 31,04258.7%Rescue & EMS
- 6,65912.6%Service Call
- 4,7349.0%Good Intent Call
- 4,6318.8%Hazardous Condition
- 2,9895.7%Fire
- 2,5664.9%False Alarm
- 1680.3%Special Incident
- Fire incident types reported to NFIRS in Davenport, IA
- 1,42447.6%Structure Fires
- 1,04034.8%Outside Fires
- 45415.2%Mobile Property/Vehicle Fires
- 712.4%Other
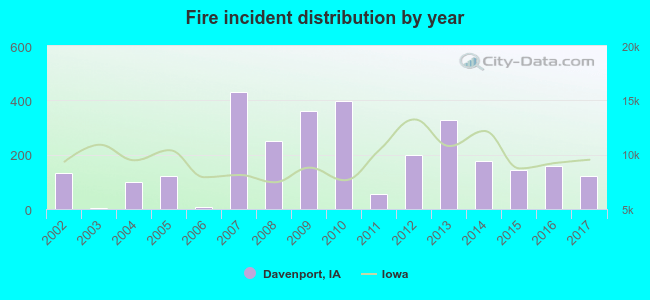 Based on the data from the years 2002 - 2017 the average number of fire incidents per year is 187. The highest number of reported fire incidents - 431 took place in 2007, and the least - 3 in 2003. The data has a declining trend.
The average number of yearly fire incidents per 10k residents in Davenport, IA compared to nearest cities:
(Note: Based on data for the last 3 years, including only cities with population 5,000 and above)
| Davenport: | 9.2 |
| Bettendorf: | 8.8 |
| Eldridge: | 41.4 |
| De Witt: | 6.7 |
| Muscatine: | 30.4 |
| Clinton: | 33.9 |
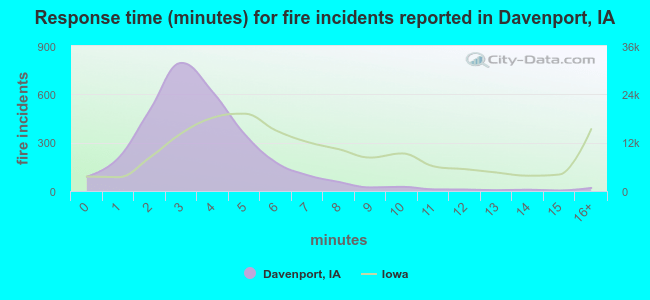 The median response time based on all reported fire incidents is 3 minutes. This is much lower compared to the Iowa median value.
The median response time in Davenport, IA compared to nearest cities:
(Note: Based on data for all years, including only cities with at least 500 fire incidents)
| Davenport: | 3 minutes |
| Rock Island: | 4 minutes |
| Bettendorf: | 5 minutes |
| Moline: | 5 minutes |
| Milan: | 8 minutes |
| East Moline: | 5 minutes |
| Colona: | 6 minutes |
| Geneseo: | 8 minutes |
| Muscatine: | 5 minutes |
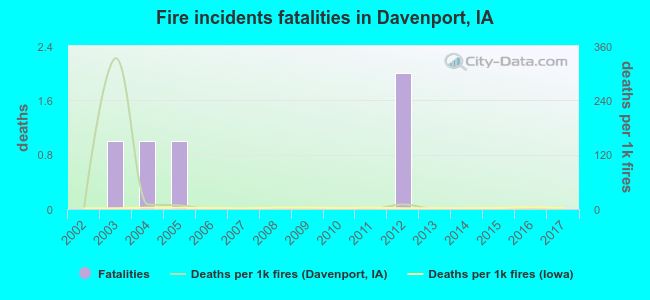 Based on the data from the years 2002 - 2017 the average number of fire-related yearly deaths is 0. The highest number of deaths - 2 took place in 2012, and the lowest - 0 in 2002. The data has a constant trend.
The average number of fatalities per 1,000 fires is 23. This indicator was the highest - 333 in 2003, and the lowest 0 in 2002. The trend for deaths per 1,000 fire incidents is constant. Compared to the Iowa value the number of fatalities per 1,000 fire incidents is lower.
Based on the data from the years 2002 - 2017 the average number of fire-related yearly deaths is 0. The highest number of deaths - 2 took place in 2012, and the lowest - 0 in 2002. The data has a constant trend.
The average number of fatalities per 1,000 fires is 23. This indicator was the highest - 333 in 2003, and the lowest 0 in 2002. The trend for deaths per 1,000 fire incidents is constant. Compared to the Iowa value the number of fatalities per 1,000 fire incidents is lower.Deaths per 1,000 incidents in Davenport, IA compared to nearest cities:
(Note: Based on data for all years, including only cities with at least 2,500 fire incidents)
| Davenport: | 1.7 |
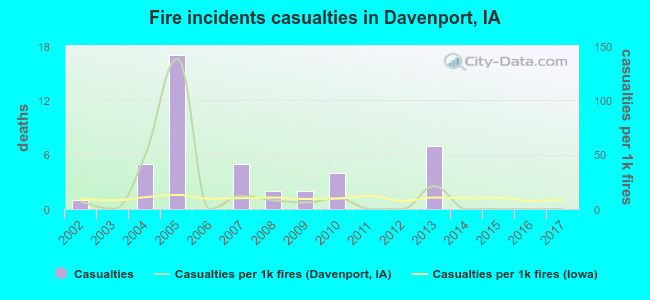 Based on the data from the years 2002 - 2017 the average number of fire-related yearly casualties is 3. The highest number of injuries - 17 took place in 2005, and the lowest - 0 in 2003. The data has a declining trend.
The average number of casualties per 1,000 fire incidents is 16. This indicator was the highest - 138 in 2005, and the lowest 0 in 2003. The trend for casualties per 1,000 fires is decreasing. Compared to the Iowa value the number of casualties per 1,000 fires is higher.
Based on the data from the years 2002 - 2017 the average number of fire-related yearly casualties is 3. The highest number of injuries - 17 took place in 2005, and the lowest - 0 in 2003. The data has a declining trend.
The average number of casualties per 1,000 fire incidents is 16. This indicator was the highest - 138 in 2005, and the lowest 0 in 2003. The trend for casualties per 1,000 fires is decreasing. Compared to the Iowa value the number of casualties per 1,000 fires is higher.Casualties per 1,000 incidents in Davenport, IA compared to nearest cities:
(Note: Based on data for all years, including only cities with at least 500 fire incidents)
| Davenport: | 14.4 |
| Rock Island: | 4.0 |
| Bettendorf: | 20.4 |
| Moline: | 12.3 |
| Milan: | 0.0 |
| East Moline: | 6.8 |
| Colona: | 0.0 |
| Geneseo: | 0.0 |
| Muscatine: | 21.0 |
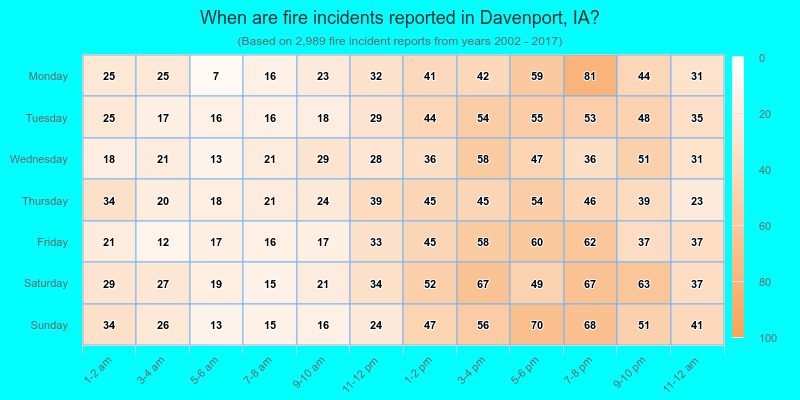
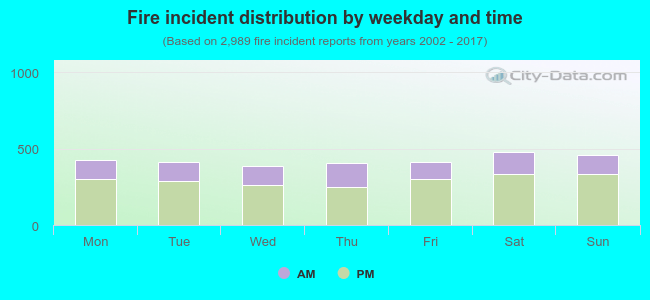 30.9% incidents where reported in the morning and 69.1% in the evening. The most fires (16.1%) took place on Saturday, and the least (13.0%) on Wednesday.
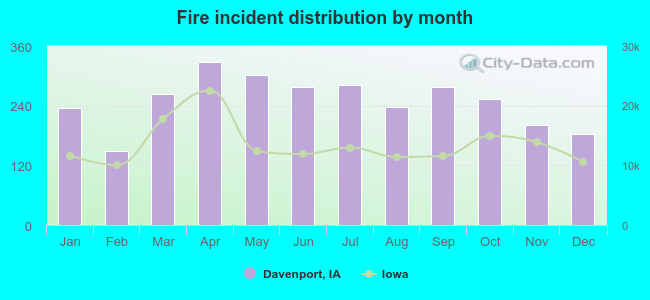 According to the 2,989 reports from years 2002 - 2017 most fires (10.9%) took place during April, and the least (5.0%) in February.
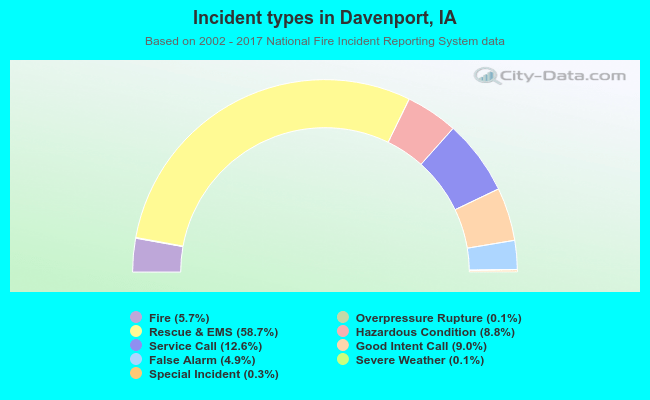 Out of all 52,873 cases reported during the years 2002 - 2017, the most belonged to the categories: Rescue & EMS (58.7%), Service Call (12.6%), and Good Intent Call (9.0%).
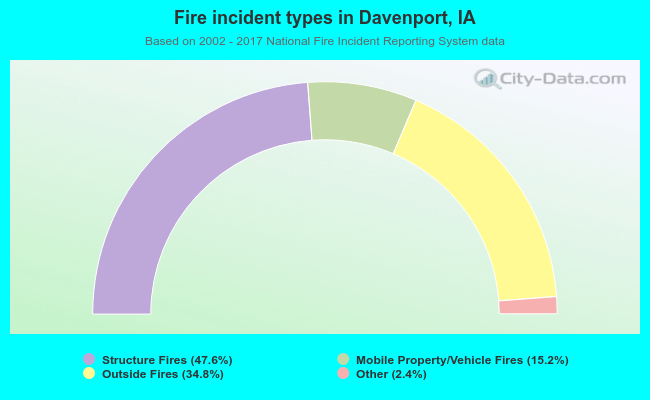 When looking into fire subcategories, the most incidents belonged to: Structure Fires (47.6%), and Outside Fires (34.8%).