Collingswood: Fire Incidents, New Jersey (NJ)
Where are fire incidents reported in Collingswood, NJ
Something went wrong! Please refresh the page.
| Fire incidents reported | |
|---|---|
| Sreet name | Count |
| NEWTON LAKE DR | 586 |
| HADDON AVE | 584 |
| COLLINGS AVE | 388 |
| ELDRIDGE AVE | 144 |
| CHAMPION AVE | 140 |
| WHITE HORSE PIKE | 90 |
| COLLINGS | 84 |
| TAYLOR AVE | 82 |
| PARK AVE | 76 |
| BROWNING RD | 72 |
| HADDON | 66 |
| RICHEY AVE | 66 |
| CRESCENT BLVD | 48 |
| ELDRIDGE | 40 |
| LINCOLN AVE | 38 |
| STOKES AVE | 38 |
| HARRISON AVE | 36 |
| WOODLAWN AVE | 36 |
| PACIFIC AVE | 32 |
| ATLANTIC AVE | 30 |
| GARFIELD AVE | 30 |
| GRANT AVE | 30 |
| CRESTMONT TER | 28 |
| FERRY AVE | 28 |
| KNIGHT AVE | 28 |
| NEW JERSEY AVE | 28 |
| WASHINGTON AVE | 28 |
| COULTER AVE | 26 |
| LEES AVE | 26 |
| MADISON AVE | 26 |
2002 - 2018 National Fire Incident Reporting System (NFIRS) incidents
- Incident types reported to NFIRS in Collingswood, NJ
- 1,99626.5%Fire
- 1,80724.0%Rescue & EMS
- 1,68722.4%Hazardous Condition
- 81510.8%False Alarm
- 6819.0%Good Intent Call
- 5206.9%Service Call
- 170.2%Severe Weather
- 110.1%Special Incident
- 90.1%Overpressure Rupture
- Fire incident types reported to NFIRS in Collingswood, NJ
- 1,59079.7%Structure Fires
- 29514.8%Outside Fires
- 995.0%Mobile Property/Vehicle Fires
- 120.6%Other
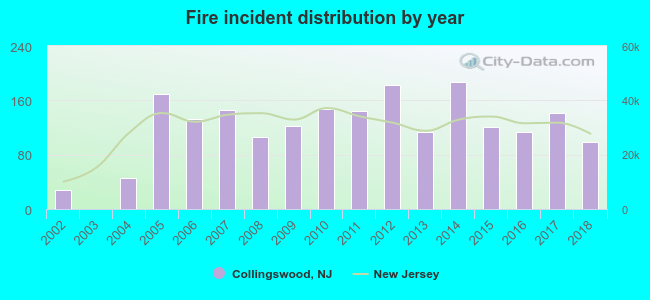 According to the data from the years 2002 - 2018 the average number of fires per year is 117. The highest number of reported fire incidents - 187 took place in 2014, and the least - 0 in 2003. The data has a rising trend.
The average number of yearly fire incidents per 10k residents in Collingswood, NJ compared to nearest cities:
(Note: Based on data for the last 3 years, including only cities with population 5,000 and above)
| Collingswood: | 84.3 |
| Audubon: | 35.6 |
| Camden: | 55.5 |
| Haddonfield: | 26.9 |
| Haddon Heights: | 29.4 |
| Gloucester City: | 52.7 |
| Pennsauken: | 43.1 |
| Barrington: | 61.0 |
| Bellmawr: | 51.2 |
 The median response time based on all reported fire incidents is 4 minutes. This is lower than the state median value.
The median response time in Collingswood, NJ compared to nearest cities:
(Note: Based on data for all years, including only cities with at least 500 fire incidents)
| Collingswood: | 4 minutes |
| Audubon: | 5 minutes |
| Camden: | 4 minutes |
| Haddonfield: | 6 minutes |
| Haddon Heights: | 6 minutes |
| Gloucester City: | 4 minutes |
| Pennsauken: | 5 minutes |
| Barrington: | 7 minutes |
| Bellmawr: | 6 minutes |
 According to the data from the years 2002 - 2018 the average number of fire-related yearly casualties is 2. The highest number of casualties - 11 took place in 2008, and the lowest - 0 in 2003. The data has a dropping trend.
The average number of injuries per 1,000 fires is 19. This indicator was the highest - 107 in 2002, and the lowest 0 in 2003. The trend for casualties per 1,000 fire incidents is declining. Compared to the state value the number of injuries per 1,000 incidents is higher.
According to the data from the years 2002 - 2018 the average number of fire-related yearly casualties is 2. The highest number of casualties - 11 took place in 2008, and the lowest - 0 in 2003. The data has a dropping trend.
The average number of injuries per 1,000 fires is 19. This indicator was the highest - 107 in 2002, and the lowest 0 in 2003. The trend for casualties per 1,000 fire incidents is declining. Compared to the state value the number of injuries per 1,000 incidents is higher.Casualties per 1,000 incidents in Collingswood, NJ compared to nearest cities:
(Note: Based on data for all years, including only cities with at least 500 fire incidents)
| Collingswood: | 13.0 |
| Audubon: | 6.2 |
| Camden: | 17.0 |
| Haddonfield: | 1.4 |
| Haddon Heights: | 3.8 |
| Gloucester City: | 7.4 |
| Pennsauken: | 9.0 |
| Barrington: | 0.0 |
| Bellmawr: | 13.4 |
 31.4% incidents where reported in the morning and 68.6% in the evening. The most fires (17.3%) took place on Sunday, and the least (12.7%) on Thursday.
 Based on the 1,996 reports from years 2002 - 2018 most fires (9.6%) took place during April, and the least (7.1%) in July.
 Out of all 7,543 cases reported during the years 2002 - 2018, the most belonged to the categories: Fire (26.5%), Rescue & EMS (24.0%), and Hazardous Condition (22.4%).
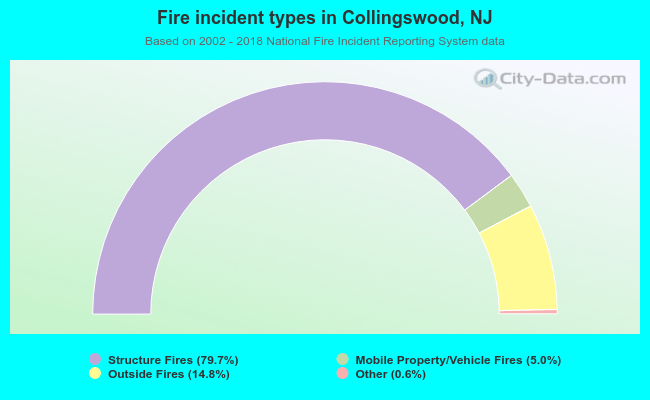 When looking into fire subcategories, the most incidents belonged to: Structure Fires (79.7%), and Outside Fires (14.8%).