Clinton: Fire Incidents, Tennessee (TN)
Where are fire incidents reported in Clinton, TN
Something went wrong! Please refresh the page.
| Fire incidents reported | |
|---|---|
| Sreet name | Count |
| CHARLES G SEIVERS BLVD | 354 |
| MAIN ST | 88 |
| CLINCH AVE | 60 |
| DUTCH VALLEY RD | 54 |
| SULPHUR SPRINGS RD | 40 |
| OLIVER SPRINGS HWY | 38 |
| J.D.YARNELL INDUSTRIAL PKY | 36 |
| BROAD ST | 30 |
| MEDARIS ST | 28 |
| FOWLER LA | 26 |
| PINE RIDGE RD | 26 |
| EAGLE WAY | 24 |
| INTERSTATE 75 | 24 |
| RIDGEVIEW DR | 24 |
| CUMBERLAND VIEW RD | 22 |
| MCADOO ST | 22 |
| BLOCKHOUSE VALLEY RD | 20 |
| FRANK L DIGGS DR | 20 |
| MOUNTAIN RD | 20 |
| ROGERS ST | 20 |
| COVE LN | 18 |
| FRANK L. DIGGS DR | 18 |
| HILLCREST ST | 18 |
| JDYARNELL INDUSTRIAL PKY | 18 |
| LAKE CITY HIGHWAY | 18 |
| LAKE CITY HWY | 18 |
| LONGMIRE RD | 18 |
| MOSER LANE | 18 |
| QUALITY CIR | 18 |
| SPRING ST | 18 |
| Other | 430 |
2002 - 2018 National Fire Incident Reporting System (NFIRS) incidents
- Incident types reported to NFIRS in Clinton, TN
- 8,08856.1%Rescue & EMS
- 1,99913.9%Service Call
- 1,58611.0%Fire
- 1,1457.9%False Alarm
- 1,0497.3%Good Intent Call
- 5133.6%Hazardous Condition
- 180.1%Overpressure Rupture
- 150.1%Special Incident
- Fire incident types reported to NFIRS in Clinton, TN
- 64540.7%Structure Fires
- 61038.5%Outside Fires
- 26516.7%Mobile Property/Vehicle Fires
- 664.2%Other
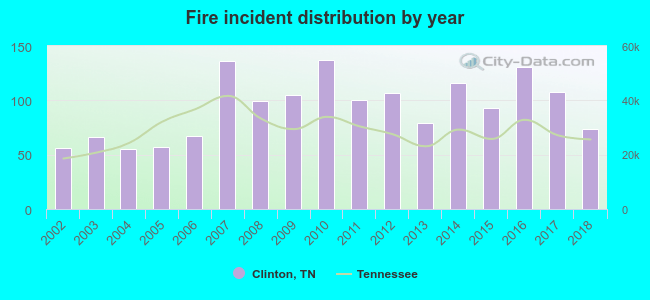 According to the data from the years 2002 - 2018 the average number of fire incidents per year is 93. The highest number of fires - 137 took place in 2010, and the least - 55 in 2004. The data has a growing trend.
The average number of yearly fire incidents per 10k residents in Clinton, TN compared to nearest cities:
(Note: Based on data for the last 3 years, including only cities with population 5,000 and above)
| Clinton: | 105.5 |
| Powell: | 21.2 |
| Oak Ridge: | 29.8 |
| Knoxville: | 70.0 |
| La Follette: | 1.4 |
| Alcoa: | 64.4 |
| Lenoir City: | 111.8 |
| Seymour: | 67.2 |
| Maryville: | 76.7 |
 The median response time based on all reported fire incidents is 5 minutes. This is lower compared to the state median value.
The median response time in Clinton, TN compared to nearest cities:
(Note: Based on data for all years, including only cities with at least 500 fire incidents)
| Clinton: | 5 minutes |
| Powell: | 8 minutes |
| Andersonville: | 11 minutes |
| Oak Ridge: | 4 minutes |
| Oliver Springs: | 10 minutes |
| Knoxville: | 5 minutes |
| Caryville: | 10 minutes |
| Maynardville: | 10 minutes |
| Alcoa: | 4 minutes |
 According to the reports from the years 2002 - 2018 the average number of fire-related yearly deaths is 0. The highest number of deaths - 1 took place in 2007, and the lowest - 0 in 2002. The data has a constant trend.
 Based on the reports from the years 2002 - 2018 the average number of fire-related yearly casualties is 0. The highest number of reported injuries - 1 took place in 2002, and the lowest - 0 in 2005. The data has a constant trend.
The average number of casualties per 1,000 fire incidents is 6. This indicator was the highest - 18 in 2004, and the lowest 0 in 2005. The trend for casualties per 1,000 fires is declining. Compared to the state value the number of injuries per 1,000 fire incidents is lower.
Based on the reports from the years 2002 - 2018 the average number of fire-related yearly casualties is 0. The highest number of reported injuries - 1 took place in 2002, and the lowest - 0 in 2005. The data has a constant trend.
The average number of casualties per 1,000 fire incidents is 6. This indicator was the highest - 18 in 2004, and the lowest 0 in 2005. The trend for casualties per 1,000 fires is declining. Compared to the state value the number of injuries per 1,000 fire incidents is lower.Casualties per 1,000 incidents in Clinton, TN compared to nearest cities:
(Note: Based on data for all years, including only cities with at least 500 fire incidents)
| Clinton: | 5.0 |
| Powell: | 12.5 |
| Andersonville: | 3.7 |
| Oak Ridge: | 16.4 |
| Oliver Springs: | 8.2 |
| Knoxville: | 8.2 |
| Caryville: | 9.2 |
| Maynardville: | 0.5 |
| Alcoa: | 3.9 |
 31.6% incidents where reported in the morning and 68.4% in the evening. The most fires (15.4%) took place on Monday, and the least (13.7%) on Tuesday.
 Based on the 1,586 incident reports from years 2002 - 2018 most fires (11.2%) took place during March, and the least (5.9%) in December.
 Out of all 14,426 cases reported during the years 2002 - 2018, the most belonged to the categories: Rescue & EMS (56.1%), Service Call (13.9%), and Fire (11.0%).
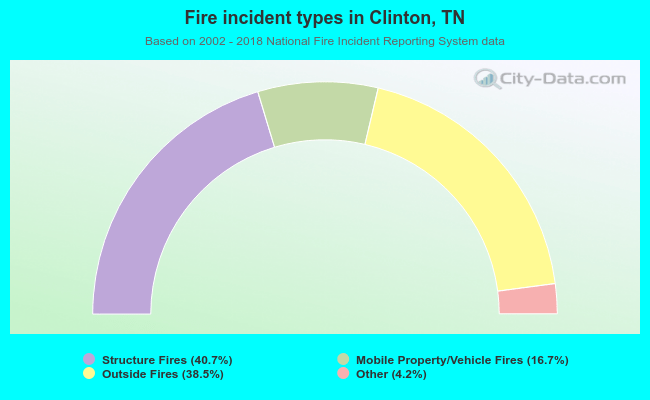 When looking into fire subcategories, the most reports belonged to: Structure Fires (40.7%), and Outside Fires (38.5%).