Clearfield: Fire Incidents, Utah (UT)
Where are fire incidents reported in Clearfield, UT
Something went wrong! Please refresh the page.
| Fire incidents reported | |
|---|---|
| Sreet name | Count |
| 1000 ST | 160 |
| STATE ST | 142 |
| MAIN ST | 136 |
| 1000 | 94 |
| 1700 ST | 80 |
| 1500 ST | 70 |
| FREEPORT CENTER FC | 70 |
| 700 | 64 |
| 700 ST | 62 |
| 1700 | 56 |
| CLFD | 54 |
| BRUCE ST | 50 |
| INTERSTATE 15 FWY | 48 |
| 200 ST | 44 |
| 500 ST | 40 |
| 300 ST | 36 |
| 250 | 32 |
| 300 | 32 |
| 500 | 30 |
| FREEPORT CENTER | 30 |
| 2000 ST | 28 |
| 450 ST | 28 |
| BARLOW ST | 28 |
| I15 | 28 |
| 1450 ST | 26 |
| 200 | 24 |
| 1500 | 22 |
| 2000 | 22 |
| 450 | 22 |
| CENTER ST | 22 |
2002 - 2018 National Fire Incident Reporting System (NFIRS) incidents
- Incident types reported to NFIRS in Clearfield, UT
- 8,21264.0%Rescue & EMS
- 1,39210.8%Fire
- 1,0668.3%False Alarm
- 9037.0%Hazardous Condition
- 8706.8%Good Intent Call
- 3612.8%Service Call
- 180.1%Special Incident
- 130.1%Overpressure Rupture
- Fire incident types reported to NFIRS in Clearfield, UT
- 58942.3%Structure Fires
- 48534.8%Outside Fires
- 25418.2%Mobile Property/Vehicle Fires
- 644.6%Other
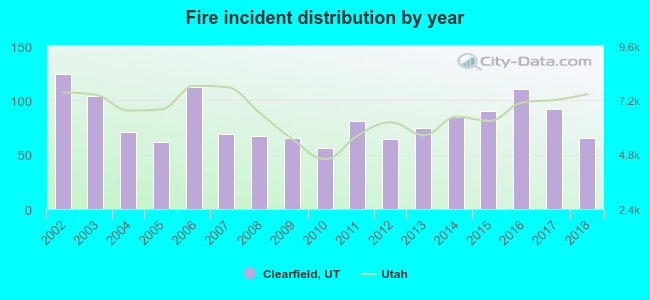 According to the data from the years 2002 - 2018 the average number of fires per year is 82. The highest number of fires - 124 took place in 2002, and the least - 56 in 2010. The data has a decreasing trend.
The average number of yearly fire incidents per 10k residents in Clearfield, UT compared to nearest cities:
(Note: Based on data for the last 3 years, including only cities with population 5,000 and above)
| Clearfield: | 29.2 |
| Sunset: | 30.4 |
| Syracuse: | 10.4 |
| Clinton: | 20.5 |
| West Point: | 23.8 |
| Layton: | 18.6 |
| Roy: | 20.1 |
| Riverdale: | 33.0 |
| Washington Terrace: | 1.1 |
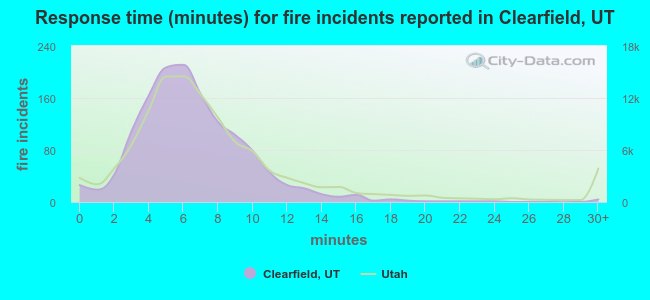 The median response time based on all reported fire incidents is 6 minutes. This is comparable to the Utah median value.
The median response time in Clearfield, UT compared to nearest cities:
(Note: Based on data for all years, including only cities with at least 500 fire incidents)
| Clearfield: | 6 minutes |
| Syracuse: | 6 minutes |
| Layton: | 6 minutes |
| Roy: | 6 minutes |
| Riverdale: | 6 minutes |
| Kaysville: | 6 minutes |
| West Haven: | 7 minutes |
| Ogden: | 6 minutes |
| Farmington: | 7 minutes |
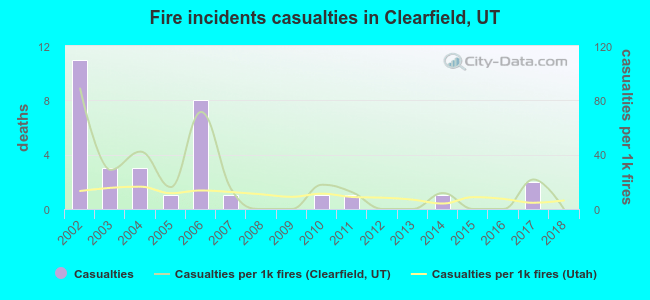 According to the reports from the years 2002 - 2018 the average number of fire-related yearly casualties is 2. The highest number of reported casualties - 11 took place in 2002, and the lowest - 0 in 2008. The data has a declining trend.
The average number of casualties per 1,000 fires is 19. This indicator was the highest - 89 in 2002, and the lowest 0 in 2008. The trend for injuries per 1,000 fire incidents is dropping. Compared to the state value the number of injuries per 1,000 fires is much higher.
According to the reports from the years 2002 - 2018 the average number of fire-related yearly casualties is 2. The highest number of reported casualties - 11 took place in 2002, and the lowest - 0 in 2008. The data has a declining trend.
The average number of casualties per 1,000 fires is 19. This indicator was the highest - 89 in 2002, and the lowest 0 in 2008. The trend for injuries per 1,000 fire incidents is dropping. Compared to the state value the number of injuries per 1,000 fires is much higher.Casualties per 1,000 incidents in Clearfield, UT compared to nearest cities:
(Note: Based on data for all years, including only cities with at least 500 fire incidents)
| Clearfield: | 23.0 |
| Syracuse: | 1.5 |
| Layton: | 30.2 |
| Roy: | 7.4 |
| Riverdale: | 0.0 |
| Kaysville: | 21.2 |
| West Haven: | 6.0 |
| Ogden: | 16.9 |
| Farmington: | 1.7 |
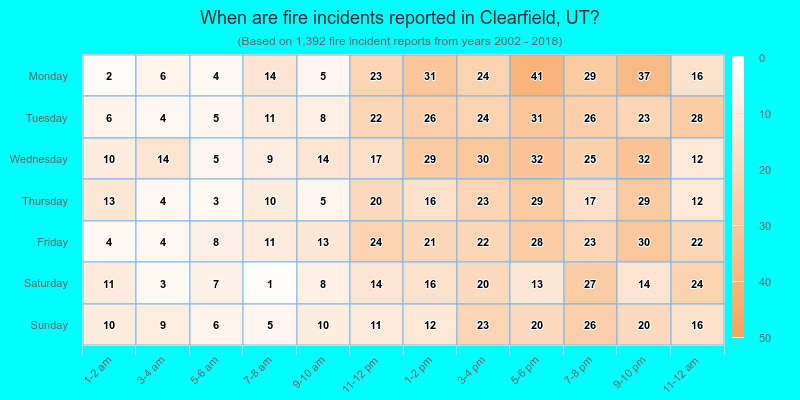
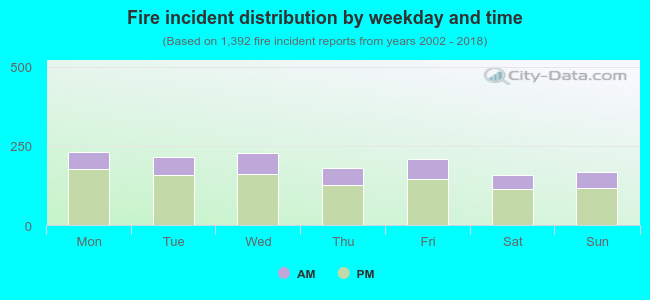 28.2% incidents where reported in the morning and 71.8% in the evening. The most fires (16.7%) took place on Monday, and the least (11.4%) on Saturday.
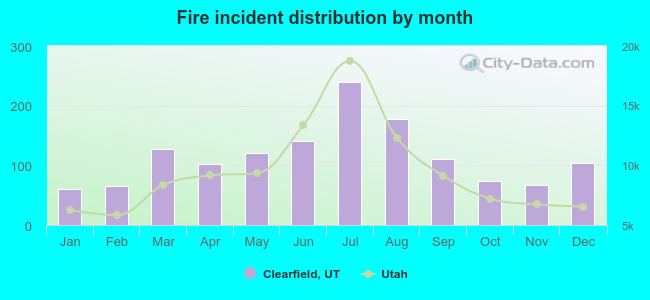 According to the 1,392 fire incidents from years 2002 - 2018 most fires (17.2%) took place during July, and the least (4.4%) in January.
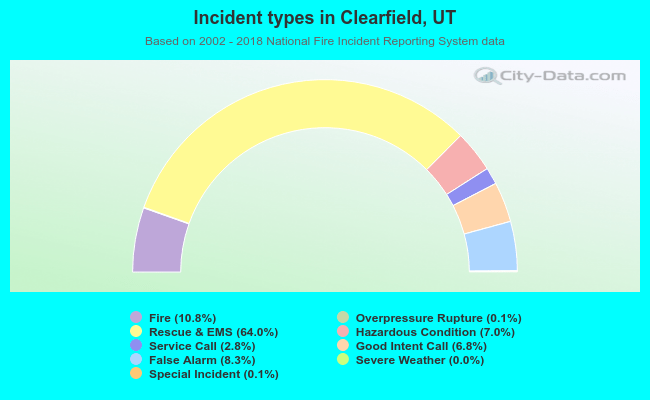 Out of all 12,836 cases reported during the years 2002 - 2018, the most belonged to the categories: Rescue & EMS (64.0%), Fire (10.8%), and False Alarm (8.3%).
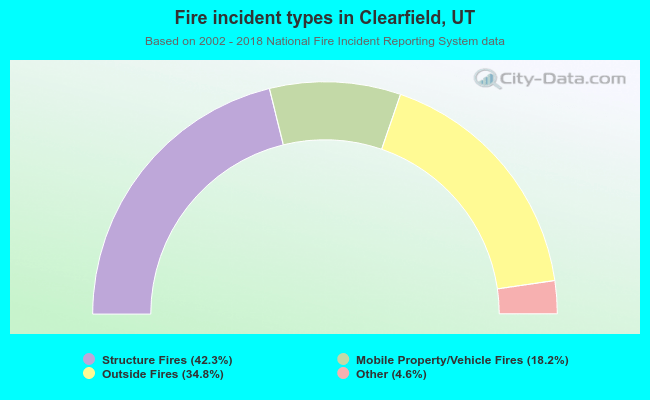 When looking into fire subcategories, the most reports belonged to: Structure Fires (42.3%), and Outside Fires (34.8%).