Clearfield: Fire Incidents, Pennsylvania (PA)
Where are fire incidents reported in Clearfield, PA
Something went wrong! Please refresh the page.
|
| |||||||||||||||||||||||||||||||||||||||||||||||||||||||||||||||||||||||||||||||||||||||||||||||||||||||||||||
2004 - 2018 National Fire Incident Reporting System (NFIRS) incidents
- Incident types reported to NFIRS in Clearfield, PA
- 31029.2%Fire
- 23321.9%Hazardous Condition
- 17216.2%Rescue & EMS
- 12411.7%Good Intent Call
- 969.0%Service Call
- 635.9%Severe Weather
- 545.1%False Alarm
- 70.7%Special Incident
- 30.3%Overpressure Rupture
- Fire incident types reported to NFIRS in Clearfield, PA
- 19863.9%Structure Fires
- 4815.5%Outside Fires
- 3912.6%Mobile Property/Vehicle Fires
- 258.1%Other
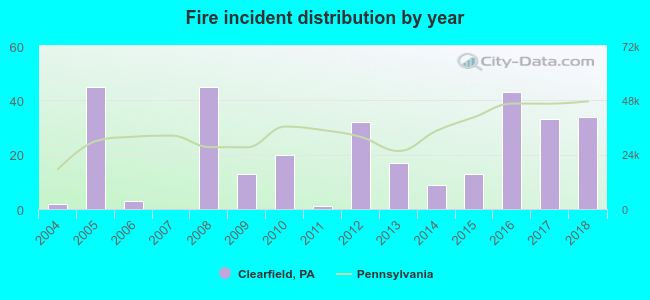 According to the data from the years 2004 - 2018 the average number of fires per year is 21. The highest number of reported fire incidents - 45 took place in 2005, and the least - 0 in 2007. The data has a growing trend.
The average number of yearly fire incidents per 10k residents in Clearfield, PA compared to nearest cities:
(Note: Based on data for the last 3 years, including only cities with population 5,000 and above)
| Clearfield: | 60.5 |
| DuBois: | 17.0 |
| Tyrone: | 77.4 |
| Punxsutawney: | 79.8 |
| State College: | 23.9 |
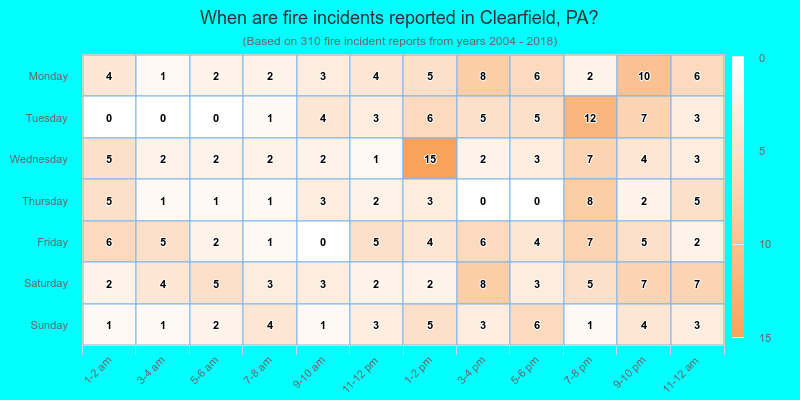
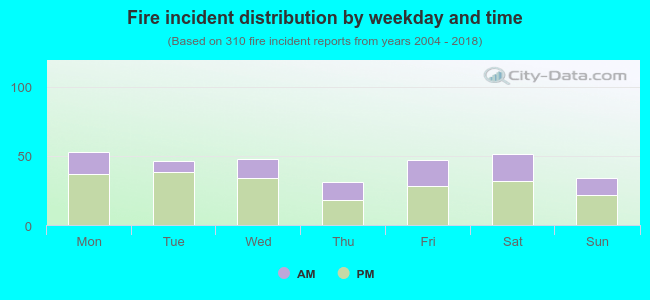 32.6% incidents where reported in the morning and 67.4% in the evening. The most fires (17.1%) took place on Monday, and the least (10.0%) on Thursday.
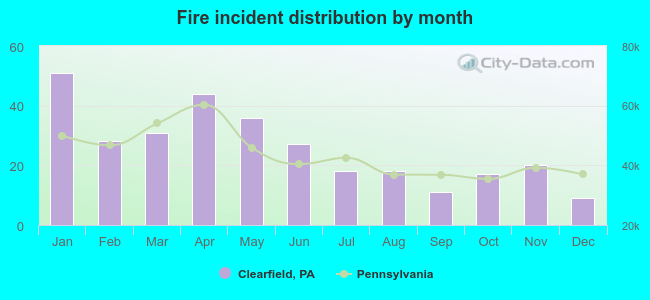 According to the 310 fire incidents from years 2004 - 2018 most fires (16.5%) took place during January, and the least (2.9%) in December.
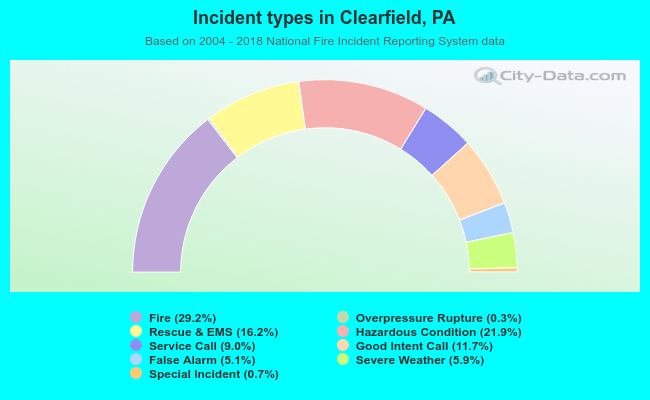 Out of all 1,062 cases reported during the years 2004 - 2018, the most belonged to the categories: Fire (29.2%), Hazardous Condition (21.9%), and Rescue & EMS (16.2%).
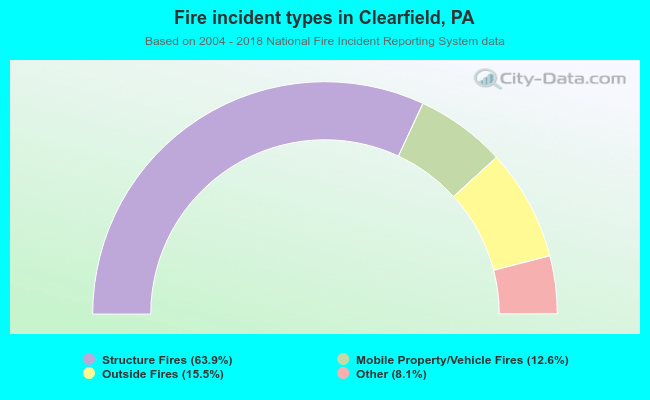 When looking into fire subcategories, the most reports belonged to: Structure Fires (63.9%), and Outside Fires (15.5%).