Chelsea: Fire Incidents, Massachusetts (MA)
Where are fire incidents reported in Chelsea, MA
Something went wrong! Please refresh the page.
| Fire incidents reported | |
|---|---|
| Sreet name | Count |
| BROADWAY | 990 |
| EVERETT AVE | 686 |
| WASHINGTON AVE | 544 |
| REVERE BEACH | 366 |
| CHESTNUT ST | 312 |
| BELLINGHAM ST | 264 |
| SHURTLEFF ST | 240 |
| BLOOMINGDALE ST | 224 |
| CRESCENT AVE | 210 |
| CLARK AVE | 206 |
| HAWTHORNE ST | 200 |
| EASTERN AVE | 176 |
| PEARL ST | 166 |
| CARY AVE | 148 |
| MAPLE ST | 134 |
| MARLBOROUGH ST | 132 |
| COTTAGE ST | 130 |
| ESSEX ST | 126 |
| LAFAYETTE AVE | 126 |
| ORANGE ST | 124 |
| WEBSTER AVE | 124 |
| CREST AVE | 120 |
| CENTRAL AVE | 116 |
| ELEANOR ST | 116 |
| FORSYTH ST | 116 |
| COMMANDANTS WAY | 114 |
| GROVE ST | 112 |
| CAPTAINS ROW | 108 |
| SHAWMUT ST | 108 |
| ARLINGTON ST | 106 |
2002 - 2018 National Fire Incident Reporting System (NFIRS) incidents
- Incident types reported to NFIRS in Chelsea, MA
- 32,26059.9%Rescue & EMS
- 5,2909.8%Fire
- 5,1559.6%False Alarm
- 4,8589.0%Hazardous Condition
- 3,1905.9%Service Call
- 2,8275.3%Good Intent Call
- 1740.3%Special Incident
- Fire incident types reported to NFIRS in Chelsea, MA
- 3,81672.1%Structure Fires
- 74914.2%Outside Fires
- 3867.3%Other
- 3396.4%Mobile Property/Vehicle Fires
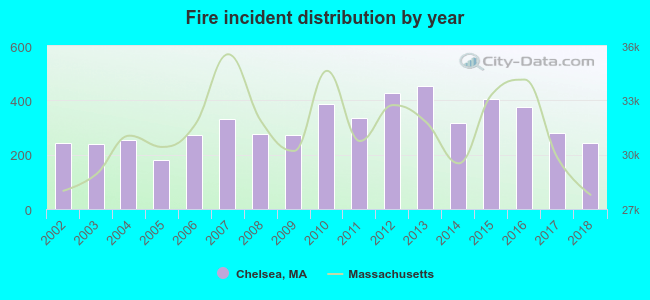 Based on the data from the years 2002 - 2018 the average number of fires per year is 311. The highest number of fire incidents - 451 took place in 2013, and the least - 182 in 2005. The data has a constant trend.
The average number of yearly fire incidents per 10k residents in Chelsea, MA compared to nearest cities:
(Note: Based on data for the last 3 years, including only cities with population 5,000 and above)
| Chelsea: | 76.9 |
| Everett: | 27.9 |
| Revere: | 68.1 |
| Malden: | 22.3 |
| Winthrop: | 37.1 |
| Somerville: | 56.2 |
| Medford: | 41.3 |
| Cambridge: | 99.2 |
| Melrose: | 6.6 |
 The median response time based on all reported fire incidents is 3 minutes. This is lower compared to the state median value.
The median response time in Chelsea, MA compared to nearest cities:
(Note: Based on data for all years, including only cities with at least 500 fire incidents)
| Chelsea: | 3 minutes |
| Everett: | 2 minutes |
| Revere: | 3 minutes |
| Malden: | 3 minutes |
| Winthrop: | 3 minutes |
| Somerville: | 3 minutes |
| Medford: | 3 minutes |
| Cambridge: | 5 minutes |
| Saugus: | 5 minutes |
 According to the reports from the years 2002 - 2018 the average number of fire-related yearly deaths is 0. The highest number of reported deaths - 1 took place in 2007, and the lowest - 0 in 2002. The data has a growing trend.
The average number of fatalities per 1,000 fires is 1. This indicator was the highest - 4 in 2018, and the lowest 0 in 2002. The trend for fatalities per 1,000 fire incidents is rising. Compared to the Massachusetts value the number of fatalities per 1,000 incidents is much lower.
According to the reports from the years 2002 - 2018 the average number of fire-related yearly deaths is 0. The highest number of reported deaths - 1 took place in 2007, and the lowest - 0 in 2002. The data has a growing trend.
The average number of fatalities per 1,000 fires is 1. This indicator was the highest - 4 in 2018, and the lowest 0 in 2002. The trend for fatalities per 1,000 fire incidents is rising. Compared to the Massachusetts value the number of fatalities per 1,000 incidents is much lower.
 According to the reports from the years 2002 - 2018 the average number of fire-related yearly casualties is 3. The highest number of casualties - 8 took place in 2007, and the lowest - 0 in 2003. The data has a rising trend.
The average number of casualties per 1,000 fires is 10. This indicator was the highest - 24 in 2007, and the lowest 0 in 2003. The trend for injuries per 1,000 fires is increasing. Compared to the state value the number of casualties per 1,000 fire incidents is about the same.
According to the reports from the years 2002 - 2018 the average number of fire-related yearly casualties is 3. The highest number of casualties - 8 took place in 2007, and the lowest - 0 in 2003. The data has a rising trend.
The average number of casualties per 1,000 fires is 10. This indicator was the highest - 24 in 2007, and the lowest 0 in 2003. The trend for injuries per 1,000 fires is increasing. Compared to the state value the number of casualties per 1,000 fire incidents is about the same.
 29.6% incidents where reported in the morning and 70.4% in the evening. The most fires (15.5%) took place on Saturday, and the least (13.4%) on Tuesday.
 According to the 5,290 incident reports from years 2002 - 2018 most fires (9.7%) took place during May, and the least (6.5%) in September.
 Out of all 53,812 cases reported during the years 2002 - 2018, the most belonged to the categories: Rescue & EMS (59.9%), Fire (9.8%), and False Alarm (9.6%).
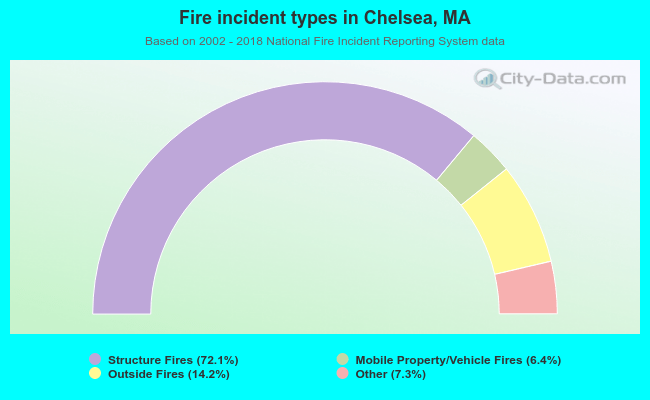 When looking into fire subcategories, the most incidents belonged to: Structure Fires (72.1%), and Outside Fires (14.2%).