Charlotte: Fire Incidents, North Carolina (NC)
Where are fire incidents reported in Charlotte, NC
Something went wrong! Please refresh the page.
| Fire incidents reported | |
|---|---|
| Sreet name | Count |
| TRYON ST | 1,234 |
| ALBEMARLE RD | 570 |
| SOUTH BV | 530 |
| I-77 HY | 456 |
| W T HARRIS BV | 448 |
| INDEPENDENCE BV | 410 |
| BEATTIES FORD RD | 398 |
| FREEDOM DR | 382 |
| I-85 HY | 372 |
| THE PLAZA | 370 |
| MONROE RD | 360 |
| CENTRAL AV | 356 |
| SUGAR CREEK RD | 350 |
| PARK RD | 336 |
| TUCKASEEGEE RD | 324 |
| EASTWAY DR | 322 |
| WILKINSON BV | 320 |
| WEST BV | 282 |
| PROVIDENCE RD | 280 |
| SHARON AMITY RD | 250 |
| I85 HY | 238 |
| TRADE ST | 238 |
| GRAHAM ST | 236 |
| NATIONS FORD RD | 234 |
| TYVOLA RD | 208 |
| BROOKSHIRE BV | 202 |
| ROZZELLES FERRY RD | 200 |
| STATESVILLE RD | 184 |
| I77 HY | 182 |
| DAVIDSON ST | 180 |
| Other | 19,669 |
2005 - 2018 National Fire Incident Reporting System (NFIRS) incidents
- Incident types reported to NFIRS in Charlotte, NC
- 290,03859.8%Rescue & EMS
- 50,96010.5%Good Intent Call
- 39,4068.1%Hazardous Condition
- 37,8457.8%False Alarm
- 33,7577.0%Service Call
- 30,1216.2%Fire
- 2,0870.4%Overpressure Rupture
- 7870.2%Special Incident
- Fire incident types reported to NFIRS in Charlotte, NC
- 12,56341.7%Outside Fires
- 10,07333.4%Structure Fires
- 6,50121.6%Mobile Property/Vehicle Fires
- 9843.3%Other
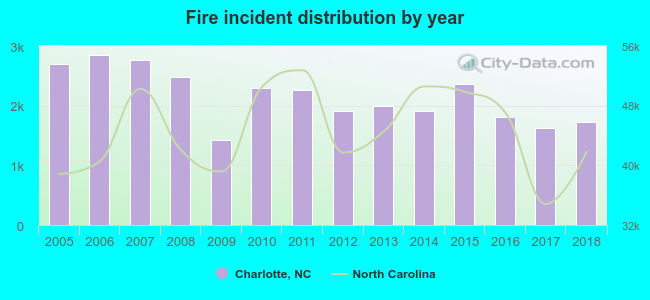 Based on the data from the years 2005 - 2018 the average number of fires per year is 2,149. The highest number of reported fires - 2,846 took place in 2006, and the least - 1,419 in 2009. The data has a dropping trend.
The average number of yearly fire incidents per 10k residents in Charlotte, NC compared to nearest cities:
(Note: Based on data for the last 3 years, including only cities with population 5,000 and above)
| Charlotte: | 21.2 |
| Matthews: | 16.6 |
| Pineville: | 44.1 |
| Mint Hill: | 26.7 |
| Stallings: | 19.4 |
| Belmont: | 50.1 |
| Mount Holly: | 58.7 |
| Harrisburg: | 21.2 |
| Indian Trail: | 24.3 |
 The median response time based on all reported fire incidents is 5 minutes. This is lower than the state median value.
The median response time in Charlotte, NC compared to nearest cities:
(Note: Based on data for all years, including only cities with at least 500 fire incidents)
| Charlotte: | 5 minutes |
| Matthews: | 7 minutes |
| Pineville: | 7 minutes |
| Mint Hill: | 7 minutes |
| Belmont: | 7 minutes |
| Mount Holly: | 7 minutes |
| Indian Trail: | 7 minutes |
| Huntersville: | 6 minutes |
| Stanley: | 8 minutes |
 According to the reports from the years 2005 - 2018 the average number of fire-related fatalities per year is 5. The highest number of reported deaths - 9 took place in 2011, and the lowest - 0 in 2013. The data has a decreasing trend.
The average number of deaths per 1,000 fires is 2. This indicator was the highest - 4 in 2009, and the lowest 0 in 2013. The trend for deaths per 1,000 fire incidents is increasing. Compared to the state value the number of deaths per 1,000 incidents is higher.
According to the reports from the years 2005 - 2018 the average number of fire-related fatalities per year is 5. The highest number of reported deaths - 9 took place in 2011, and the lowest - 0 in 2013. The data has a decreasing trend.
The average number of deaths per 1,000 fires is 2. This indicator was the highest - 4 in 2009, and the lowest 0 in 2013. The trend for deaths per 1,000 fire incidents is increasing. Compared to the state value the number of deaths per 1,000 incidents is higher.Deaths per 1,000 incidents in Charlotte, NC compared to nearest cities:
(Note: Based on data for all years, including only cities with at least 2,500 fire incidents)
| Charlotte: | 2.2 |
| Concord: | 0.5 |
| Gastonia: | 3.0 |
| Monroe: | 1.2 |
| Mooresville: | 0.0 |
| Lincolnton: | 2.4 |
 According to the data from the years 2005 - 2018 the average number of fire-related casualties per year is 24. The highest number of reported injuries - 43 took place in 2005, and the lowest - 10 in 2018. The data has a dropping trend.
The average number of casualties per 1,000 fires is 11. This indicator was the highest - 17 in 2009, and the lowest 6 in 2018. The trend for injuries per 1,000 fire incidents is decreasing. Compared to the North Carolina value the number of casualties per 1,000 incidents is higher.
According to the data from the years 2005 - 2018 the average number of fire-related casualties per year is 24. The highest number of reported injuries - 43 took place in 2005, and the lowest - 10 in 2018. The data has a dropping trend.
The average number of casualties per 1,000 fires is 11. This indicator was the highest - 17 in 2009, and the lowest 6 in 2018. The trend for injuries per 1,000 fire incidents is decreasing. Compared to the North Carolina value the number of casualties per 1,000 incidents is higher.Casualties per 1,000 incidents in Charlotte, NC compared to nearest cities:
(Note: Based on data for all years, including only cities with at least 500 fire incidents)
| Charlotte: | 11.4 |
| Matthews: | 13.5 |
| Pineville: | 11.5 |
| Mint Hill: | 1.3 |
| Belmont: | 1.5 |
| Mount Holly: | 0.0 |
| Indian Trail: | 3.3 |
| Huntersville: | 1.7 |
| Stanley: | 1.8 |
 29.9% incidents where reported in the morning and 70.1% in the evening. The most fires (15.2%) took place on Saturday, and the least (13.7%) on Wednesday.
 Based on the 30,121 fires from years 2005 - 2018 most fires (10.4%) took place during April, and the least (6.8%) in August.
 Out of all 485,354 cases reported during the years 2005 - 2018, the most belonged to the categories: Rescue & EMS (59.8%), Good Intent Call (10.5%), and Hazardous Condition (8.1%).
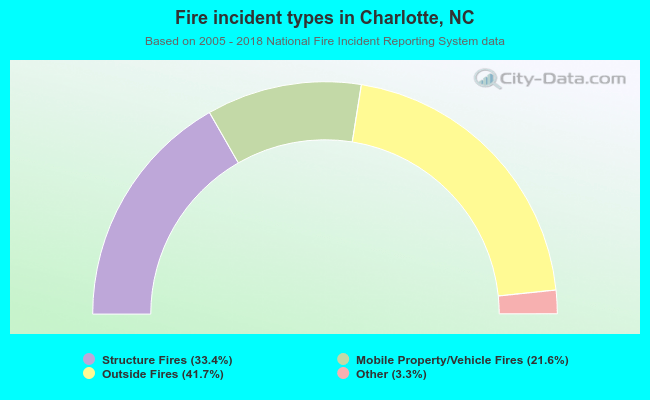 When looking into fire subcategories, the most reports belonged to: Outside Fires (41.7%), and Structure Fires (33.4%).