Carpinteria: Fire Incidents, California (CA)
Where are fire incidents reported in Carpinteria, CA
Something went wrong! Please refresh the page.
|
| |||||||||||||||||||||||||||||||||||||||||||||||||||||||||||||||||||||||||||||||||||||||||||||||||||||||||||||
2005 - 2018 National Fire Incident Reporting System (NFIRS) incidents
- Incident types reported to NFIRS in Carpinteria, CA
- 2,52062.2%Rescue & EMS
- 66316.4%Good Intent Call
- 2405.9%Hazardous Condition
- 2115.2%Service Call
- 2015.0%False Alarm
- 1934.8%Fire
- 100.2%Severe Weather
- 80.2%Special Incident
- 50.1%Overpressure Rupture
- Fire incident types reported to NFIRS in Carpinteria, CA
- 6734.7%Structure Fires
- 6031.1%Outside Fires
- 3618.7%Mobile Property/Vehicle Fires
- 3015.5%Other
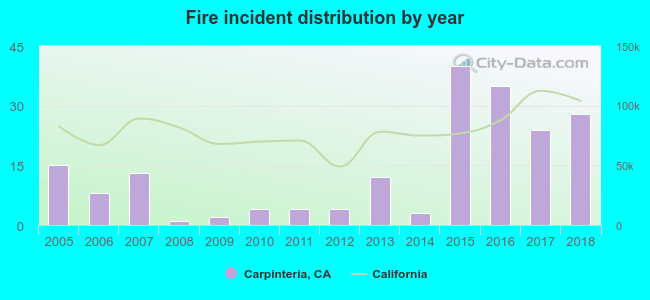 Based on the data from the years 2005 - 2018 the average number of fires per year is 14. The highest number of reported fire incidents - 40 took place in 2015, and the least - 1 in 2008. The data has a rising trend.
The average number of yearly fire incidents per 10k residents in Carpinteria, CA compared to nearest cities:
(Note: Based on data for the last 3 years, including only cities with population 5,000 and above)
| Carpinteria: | 21.2 |
| Montecito: | 4.1 |
| Santa Barbara: | 23.4 |
| Mira Monte: | 4.4 |
| Ojai: | 47.6 |
| Goleta: | 26.2 |
| Ventura: | 37.4 |
| Isla Vista: | 7.5 |
| El Rio: | 43.5 |
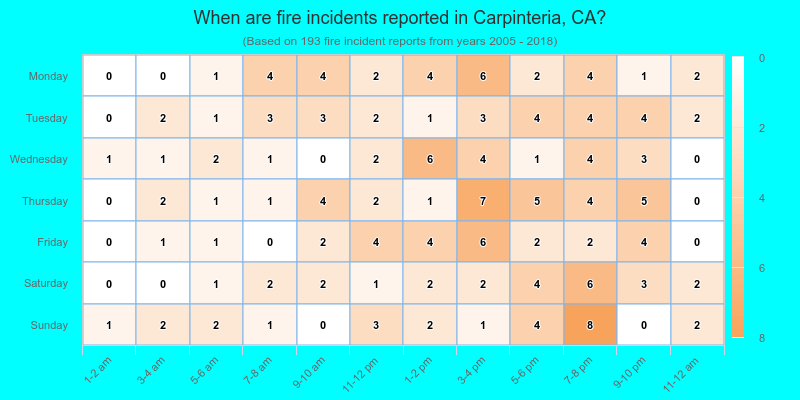
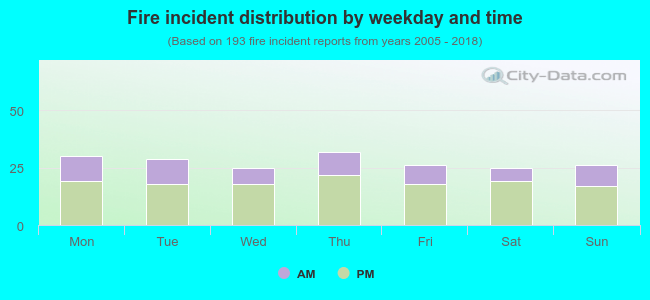 32.1% incidents where reported in the morning and 67.9% in the evening. The most fires (16.6%) took place on Thursday, and the least (13.0%) on Wednesday.
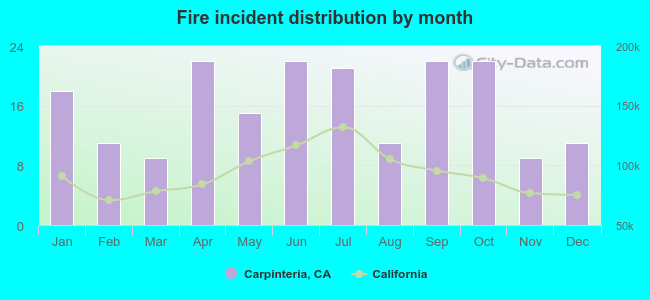 According to the 193 fire incident reports from years 2005 - 2018 most fires (11.4%) took place during April, and the least (4.7%) in March.
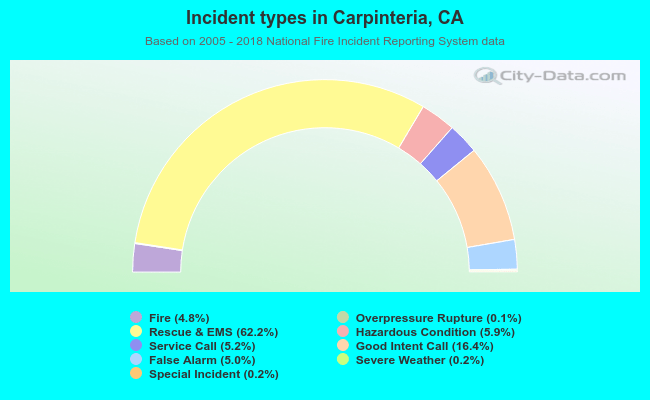 Out of all 4,051 cases reported during the years 2005 - 2018, the most belonged to the categories: Rescue & EMS (62.2%), Good Intent Call (16.4%), and Hazardous Condition (5.9%).
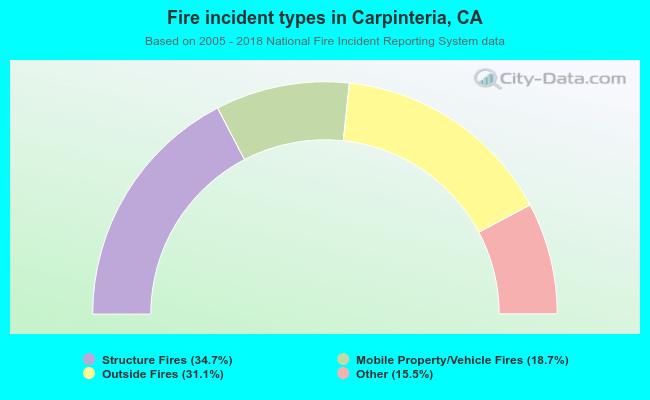 When looking into fire subcategories, the most incidents belonged to: Structure Fires (34.7%), and Outside Fires (31.1%).