Burlington: Fire Incidents, Massachusetts (MA)
Where are fire incidents reported in Burlington, MA
Something went wrong! Please refresh the page.
| Fire incidents reported | |
|---|---|
| Sreet name | Count |
| MIDDLESEX TPKE | 390 |
| CAMBRIDGE ST | 234 |
| MALL RD | 162 |
| BARON PARK LA | 108 |
| WINN ST | 82 |
| BEDFORD ST | 64 |
| MIDDLESEX | 64 |
| SOUTH HWY | 52 |
| LEXINGTON ST | 48 |
| WAYSIDE RD | 48 |
| CENTER ST | 46 |
| BARON PARK | 44 |
| CAMBRIDGE | 44 |
| SOUTH AVE | 44 |
| NORTH HWY | 40 |
| WILMINGTON RD | 38 |
| FARMS DR | 32 |
| ARBORETUM WAY | 30 |
| WHEELER RD | 28 |
| NEW ENGLAND EXEC PARK | 26 |
| SOUTH BEDFORD ST | 26 |
| VAN DE GRAAFF DR | 24 |
| BEACON VILLAGE VLG | 22 |
| MOUNTAIN RD | 22 |
| OLD CONCORD RD | 22 |
| WINTER ST | 22 |
| MILL ST | 20 |
| MULLER RD | 20 |
| WALL ST | 20 |
| BEACON ST | 18 |
2002 - 2018 National Fire Incident Reporting System (NFIRS) incidents
- Incident types reported to NFIRS in Burlington, MA
- 14,10751.9%Rescue & EMS
- 3,91514.4%Service Call
- 3,78313.9%False Alarm
- 2,87910.6%Hazardous Condition
- 1,6226.0%Fire
- 8403.1%Good Intent Call
- Fire incident types reported to NFIRS in Burlington, MA
- 67941.9%Outside Fires
- 61337.8%Structure Fires
- 26516.3%Mobile Property/Vehicle Fires
- 654.0%Other
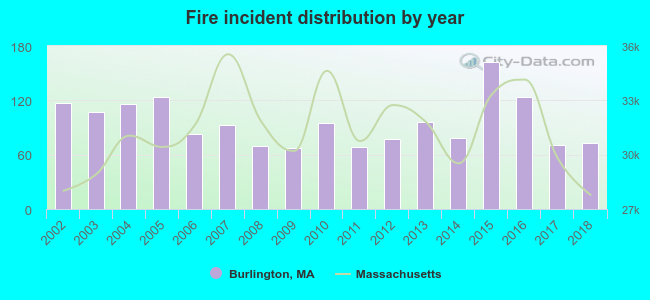 According to the data from the years 2002 - 2018 the average number of fire incidents per year is 95. The highest number of reported fires - 162 took place in 2015, and the least - 67 in 2009. The data has a dropping trend.
The average number of yearly fire incidents per 10k residents in Burlington, MA compared to nearest cities:
(Note: Based on data for the last 3 years, including only cities with population 5,000 and above)
| Burlington: | 36.5 |
| Woburn: | 52.0 |
| Bedford: | 18.5 |
| Wilmington: | 23.6 |
| Billerica: | 27.3 |
| Lexington: | 11.5 |
| Winchester: | 12.9 |
| Reading: | 29.9 |
| Stoneham: | 58.2 |
 The median response time based on all reported fire incidents is 4 minutes. This is about the same as the Massachusetts median value.
The median response time in Burlington, MA compared to nearest cities:
(Note: Based on data for all years, including only cities with at least 500 fire incidents)
| Burlington: | 4 minutes |
| Woburn: | 4 minutes |
| Bedford: | 4 minutes |
| Wilmington: | 6 minutes |
| Billerica: | 4 minutes |
| Lexington: | 5 minutes |
| Winchester: | 4 minutes |
| Reading: | 4 minutes |
| Stoneham: | 3 minutes |
 Based on the reports from the years 2002 - 2018 the average number of fire-related yearly casualties is 1. The highest number of reported injuries - 3 took place in 2006, and the lowest - 0 in 2002. The data has a constant trend.
The average number of injuries per 1,000 fire incidents is 8. This indicator was the highest - 36 in 2006, and the lowest 0 in 2002. The trend for casualties per 1,000 incidents is dropping. Compared to the state value the number of injuries per 1,000 incidents is lower.
Based on the reports from the years 2002 - 2018 the average number of fire-related yearly casualties is 1. The highest number of reported injuries - 3 took place in 2006, and the lowest - 0 in 2002. The data has a constant trend.
The average number of injuries per 1,000 fire incidents is 8. This indicator was the highest - 36 in 2006, and the lowest 0 in 2002. The trend for casualties per 1,000 incidents is dropping. Compared to the state value the number of injuries per 1,000 incidents is lower.Casualties per 1,000 incidents in Burlington, MA compared to nearest cities:
(Note: Based on data for all years, including only cities with at least 500 fire incidents)
| Burlington: | 7.4 |
| Woburn: | 14.5 |
| Bedford: | 33.1 |
| Wilmington: | 10.0 |
| Billerica: | 11.1 |
| Lexington: | 22.2 |
| Winchester: | 24.3 |
| Reading: | 5.2 |
| Stoneham: | 3.8 |
 27.4% incidents where reported in the morning and 72.6% in the evening. The most fires (15.5%) took place on Thursday, and the least (13.6%) on Friday.
 Based on the 1,622 reports from years 2002 - 2018 most fires (13.8%) took place during May, and the least (5.4%) in February.
 Out of all 27,179 cases reported during the years 2002 - 2018, the most belonged to the categories: Rescue & EMS (51.9%), Service Call (14.4%), and False Alarm (13.9%).
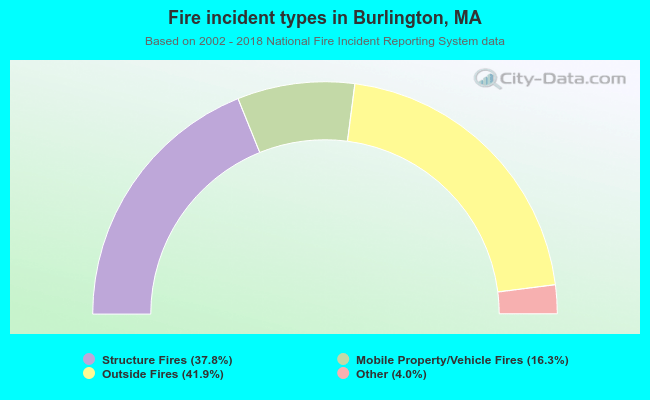 When looking into fire subcategories, the most reports belonged to: Outside Fires (41.9%), and Structure Fires (37.8%).