Brunswick: Fire Incidents, Georgia (GA)
Where are fire incidents reported in Brunswick, GA
Something went wrong! Please refresh the page.
| Fire incidents reported | |
|---|---|
| Sreet name | Count |
| INTERSTATE 95 | 252 |
| NEW JESUP HWY | 220 |
| OLD JESUP RD | 186 |
| ALBANY ST | 180 |
| ALTAMA AVE | 178 |
| NORWICH ST | 150 |
| REYNOLDS ST | 140 |
| NEWCASTLE ST | 138 |
| WOLFE ST | 130 |
| ELLIS ST | 126 |
| 17 HWY | 118 |
| MARTIN LUTHER KING JR BLVD | 114 |
| GLYNN AVE | 104 |
| LEE ST | 102 |
| HABERSHAM ST | 98 |
| STONEWALL ST | 94 |
| CYPRESS MILL RD | 86 |
| UNION ST | 86 |
| DARIEN HWY | 84 |
| GORDON ST | 84 |
| BLYTHE ISLAND HWY | 78 |
| AMHERST ST | 76 |
| FOURTH ST | 66 |
| PARKWOOD DR | 64 |
| JOHNSTON ST | 62 |
| TOWNSEND ST | 62 |
| ALTAMA AV | 60 |
| NOTTINGHAM DR | 60 |
| BAY ST | 54 |
| HIGHWAY 99 | 54 |
| Other | 2,240 |
2003 - 2018 National Fire Incident Reporting System (NFIRS) incidents
- Incident types reported to NFIRS in Brunswick, GA
- 27,53765.4%Rescue & EMS
- 5,54613.2%Fire
- 3,0787.3%False Alarm
- 2,6206.2%Hazardous Condition
- 1,9784.7%Good Intent Call
- 1,1792.8%Service Call
- 910.2%Special Incident
- 700.2%Overpressure Rupture
- Fire incident types reported to NFIRS in Brunswick, GA
- 2,59546.8%Outside Fires
- 1,72531.1%Structure Fires
- 81214.6%Mobile Property/Vehicle Fires
- 4147.5%Other
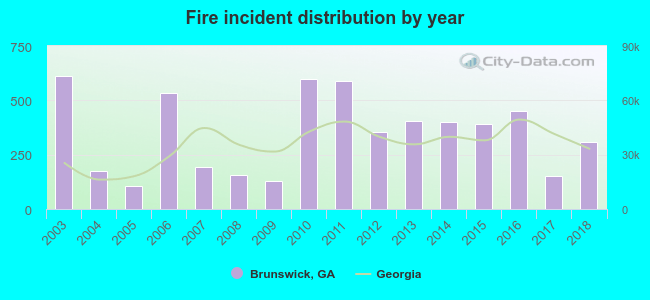 Based on the data from the years 2003 - 2018 the average number of fire incidents per year is 347. The highest number of reported fires - 610 took place in 2003, and the least - 106 in 2005. The data has a dropping trend.
The average number of yearly fire incidents per 10k residents in Brunswick, GA compared to nearest cities:
(Note: Based on data for the last 3 years, including only cities with population 5,000 and above)
| Brunswick: | 190.5 |
| Dock Junction: | 2.6 |
| Thalmann: | 1.5 |
| Everett: | 0.6 |
| Waynesville: | 25.4 |
| Kingsland: | 62.1 |
| Folkston: | 190.8 |
| Jesup: | 59.0 |
| Hinesville: | 36.1 |
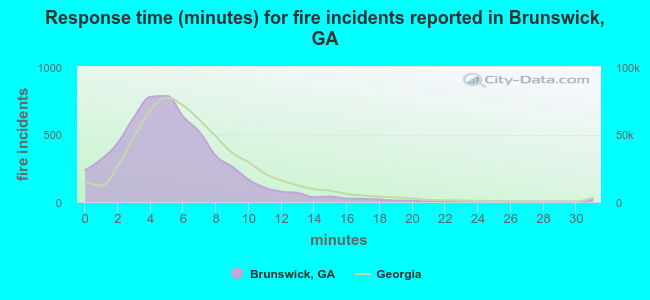 The median response time based on all reported fire incidents is 5 minutes. This is lower compared to the Georgia median value.
The median response time in Brunswick, GA compared to nearest cities:
(Note: Based on data for all years, including only cities with at least 500 fire incidents)
| Brunswick: | 5 minutes |
| Woodbine: | 7 minutes |
| Kingsland: | 5 minutes |
| St. Marys: | 5 minutes |
| Fernandina Beach: | 6 minutes |
| Yulee: | 9 minutes |
| Folkston: | 9 minutes |
| Jesup: | 9 minutes |
| Hilliard: | 12 minutes |
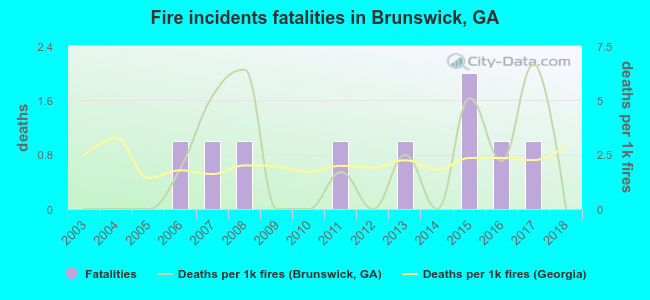 According to the data from the years 2003 - 2018 the average number of fire-related yearly deaths is 1. The highest number of reported deaths - 2 took place in 2015, and the lowest - 0 in 2003. The data has a constant trend.
The average number of fatalities per 1,000 fire incidents is 2. This indicator was the highest - 7 in 2017, and the lowest 0 in 2003. The trend for fatalities per 1,000 fire incidents is constant. Compared to the state value the number of fatalities per 1,000 incidents is lower.
According to the data from the years 2003 - 2018 the average number of fire-related yearly deaths is 1. The highest number of reported deaths - 2 took place in 2015, and the lowest - 0 in 2003. The data has a constant trend.
The average number of fatalities per 1,000 fire incidents is 2. This indicator was the highest - 7 in 2017, and the lowest 0 in 2003. The trend for fatalities per 1,000 fire incidents is constant. Compared to the state value the number of fatalities per 1,000 incidents is lower.Deaths per 1,000 incidents in Brunswick, GA compared to nearest cities:
(Note: Based on data for all years, including only cities with at least 2,500 fire incidents)
| Brunswick: | 1.6 |
| Waycross: | 2.4 |
| Jacksonville: | 2.1 |
| Savannah: | 2.6 |
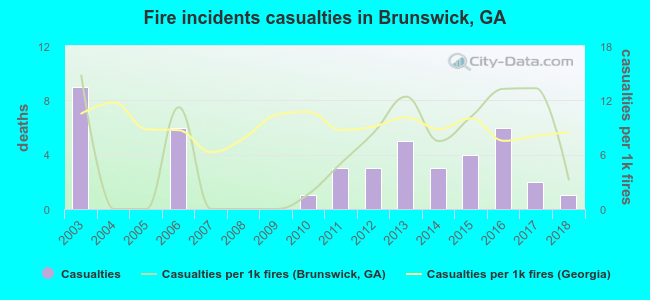 Based on the data from the years 2003 - 2018 the average number of fire-related casualties per year is 3. The highest number of casualties - 9 took place in 2003, and the lowest - 0 in 2004. The data has a declining trend.
The average number of injuries per 1,000 fires is 6. This indicator was the highest - 15 in 2003, and the lowest 0 in 2004. The trend for casualties per 1,000 fires is decreasing. Compared to the Georgia value the number of casualties per 1,000 fire incidents is similar.
Based on the data from the years 2003 - 2018 the average number of fire-related casualties per year is 3. The highest number of casualties - 9 took place in 2003, and the lowest - 0 in 2004. The data has a declining trend.
The average number of injuries per 1,000 fires is 6. This indicator was the highest - 15 in 2003, and the lowest 0 in 2004. The trend for casualties per 1,000 fires is decreasing. Compared to the Georgia value the number of casualties per 1,000 fire incidents is similar.
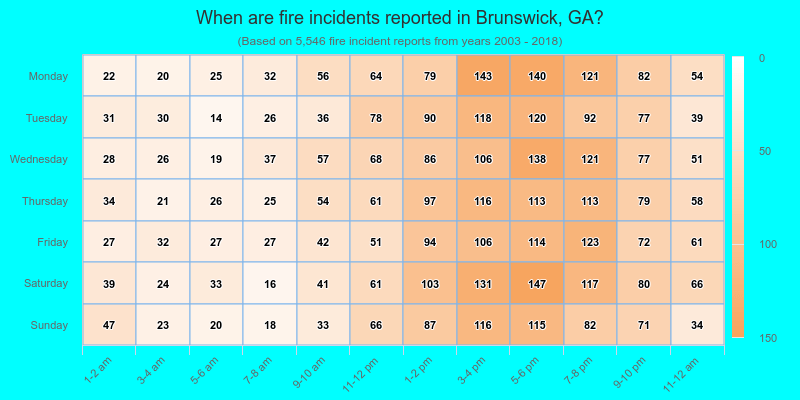
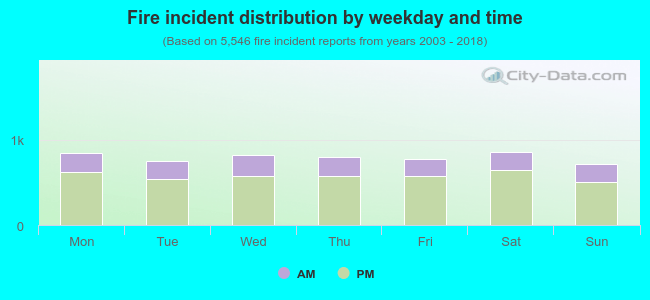 27.4% incidents where reported in the morning and 72.6% in the evening. The most fires (15.5%) took place on Saturday, and the least (12.8%) on Sunday.
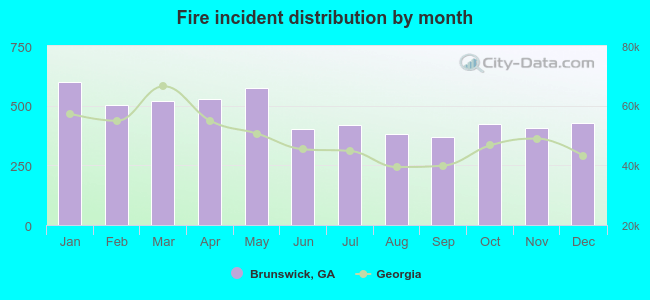 According to the 5,546 fire incident reports from years 2003 - 2018 most fires (10.8%) took place during January, and the least (6.7%) in September.
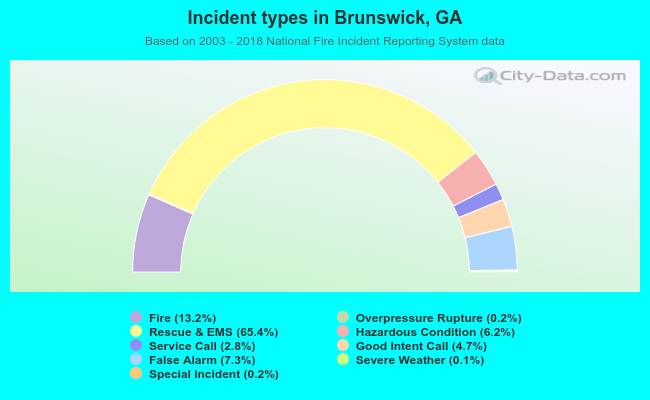 Out of all 42,135 cases reported during the years 2003 - 2018, the most belonged to the categories: Rescue & EMS (65.4%), Fire (13.2%), and False Alarm (7.3%).
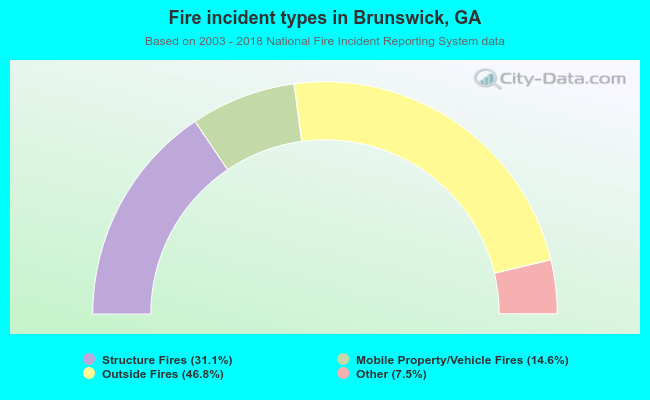 When looking into fire subcategories, the most incidents belonged to: Outside Fires (46.8%), and Structure Fires (31.1%).