Bountiful: Fire Incidents, Utah (UT)
Where are fire incidents reported in Bountiful, UT
Something went wrong! Please refresh the page.
| Fire incidents reported | |
|---|---|
| Sreet name | Count |
| SKYLINE DR | 82 |
| 200 WEST | 64 |
| 500 WEST | 58 |
| MAIN ST | 58 |
| MAIN | 40 |
| 400 EAST | 38 |
| 500 SOUTH | 38 |
| ORCHARD DR | 34 |
| I15 NB | 26 |
| CENTER | 24 |
| 100 WEST | 20 |
| 1450 NORTH | 18 |
| 1800 SOUTH | 18 |
| 200 NORTH | 18 |
| 300 WEST | 18 |
| 3100 SOUTH | 18 |
| CENTER ST | 18 |
| DAVIS BLVD | 18 |
| 900 NORTH | 16 |
| 250 NORTH | 14 |
| BOUNTIFUL BLVD | 14 |
| I15 SB | 14 |
| 100 EAST | 12 |
| 1300 EAST | 12 |
| 2600 SOUTH | 12 |
| ORCHARD | 12 |
| 1000 NORTH | 10 |
| 1500 SOUTH | 10 |
| 400 NORTH | 10 |
| 50 WEST | 10 |
2002 - 2018 National Fire Incident Reporting System (NFIRS) incidents
- Incident types reported to NFIRS in Bountiful, UT
- 11,68568.6%Rescue & EMS
- 1,4588.6%Hazardous Condition
- 1,0696.3%Good Intent Call
- 1,0436.1%False Alarm
- 1,0125.9%Service Call
- 7364.3%Fire
- Fire incident types reported to NFIRS in Bountiful, UT
- 30040.8%Outside Fires
- 29840.5%Structure Fires
- 13017.7%Mobile Property/Vehicle Fires
- 81.1%Other
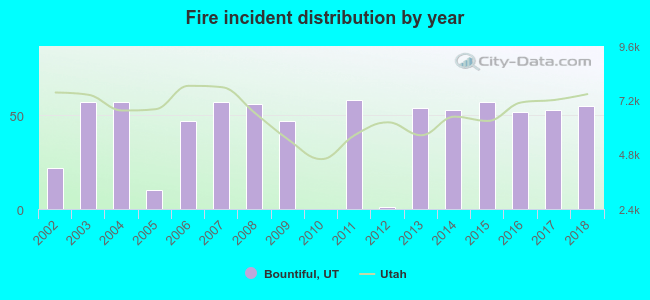 According to the data from the years 2002 - 2018 the average number of fires per year is 43. The highest number of reported fire incidents - 58 took place in 2011, and the least - 0 in 2010. The data has an increasing trend.
The average number of yearly fire incidents per 10k residents in Bountiful, UT compared to nearest cities:
(Note: Based on data for the last 3 years, including only cities with population 5,000 and above)
| Bountiful: | 12.3 |
| Woods Cross: | 20.4 |
| West Bountiful: | 24.5 |
| North Salt Lake: | 22.8 |
| Centerville: | 17.0 |
| Farmington: | 22.6 |
| Salt Lake City: | 27.4 |
| Fruit Heights: | 25.6 |
| Kaysville: | 17.5 |
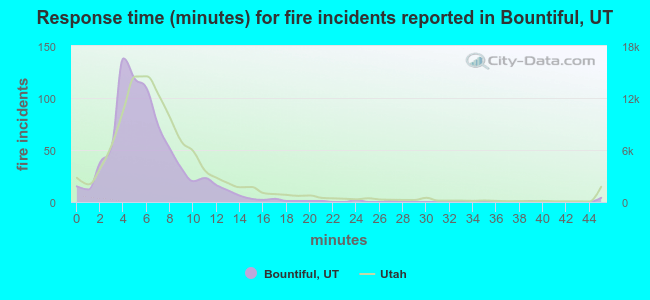 The median response time based on all reported fire incidents is 5 minutes. This is lower than the Utah median value.
The median response time in Bountiful, UT compared to nearest cities:
(Note: Based on data for all years, including only cities with at least 500 fire incidents)
| Bountiful: | 5 minutes |
| Farmington: | 7 minutes |
| Salt Lake City: | 7 minutes |
| Kaysville: | 6 minutes |
| South Salt Lake: | 6 minutes |
| Layton: | 6 minutes |
| West Valley City: | 6 minutes |
| Holladay: | 7 minutes |
| Murray: | 6 minutes |
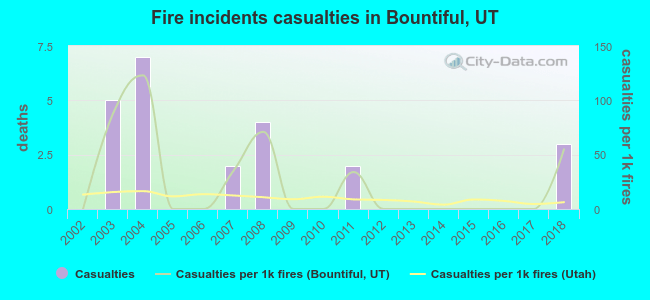 According to the reports from the years 2002 - 2018 the average number of fire-related casualties per year is 1. The highest number of reported casualties - 7 took place in 2004, and the lowest - 0 in 2002. The data has an increasing trend.
The average number of injuries per 1,000 fire incidents is 24. This indicator was the highest - 123 in 2004, and the lowest 0 in 2002. The trend for injuries per 1,000 incidents is increasing. Compared to the Utah value the number of injuries per 1,000 fire incidents is much higher.
According to the reports from the years 2002 - 2018 the average number of fire-related casualties per year is 1. The highest number of reported casualties - 7 took place in 2004, and the lowest - 0 in 2002. The data has an increasing trend.
The average number of injuries per 1,000 fire incidents is 24. This indicator was the highest - 123 in 2004, and the lowest 0 in 2002. The trend for injuries per 1,000 incidents is increasing. Compared to the Utah value the number of injuries per 1,000 fire incidents is much higher.Casualties per 1,000 incidents in Bountiful, UT compared to nearest cities:
(Note: Based on data for all years, including only cities with at least 500 fire incidents)
| Bountiful: | 31.3 |
| Farmington: | 1.7 |
| Salt Lake City: | 17.1 |
| Kaysville: | 21.2 |
| South Salt Lake: | 7.7 |
| Layton: | 30.2 |
| West Valley City: | 25.5 |
| Holladay: | 1.6 |
| Murray: | 5.4 |
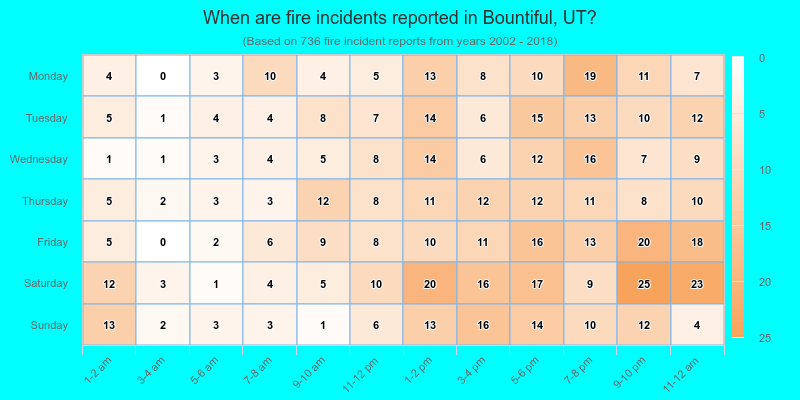
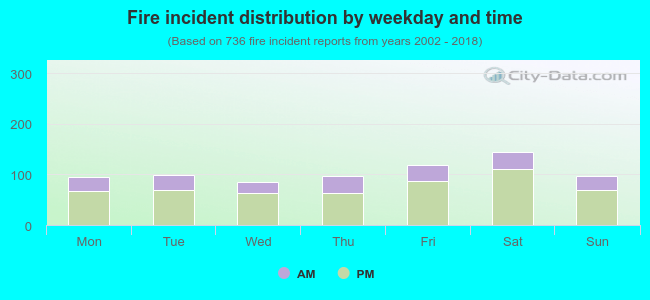 27.6% incidents where reported in the morning and 72.4% in the evening. The most fires (19.7%) took place on Saturday, and the least (11.7%) on Wednesday.
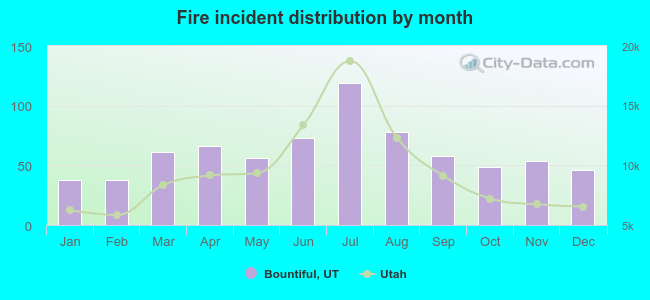 Based on the 736 fire incident reports from years 2002 - 2018 most fires (16.2%) took place during July, and the least (5.2%) in January.
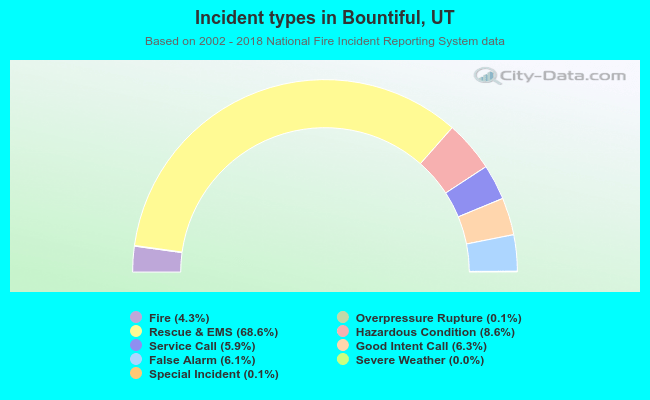 Out of all 17,033 cases reported during the years 2002 - 2018, the most belonged to the categories: Rescue & EMS (68.6%), Hazardous Condition (8.6%), and Good Intent Call (6.3%).
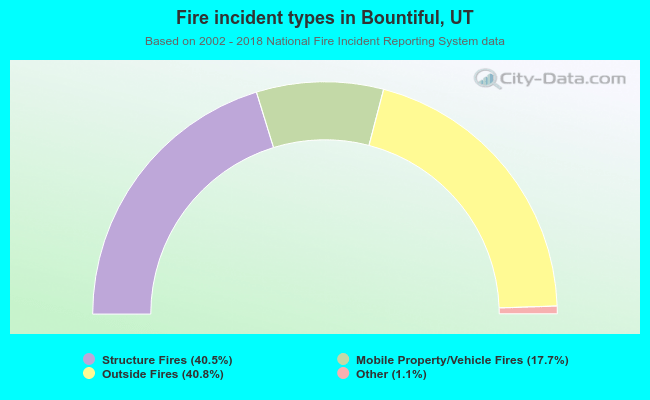 When looking into fire subcategories, the most reports belonged to: Outside Fires (40.8%), and Structure Fires (40.5%).