Borger: Fire Incidents, Texas (TX)
Where are fire incidents reported in Borger, TX
Something went wrong! Please refresh the page.
| Fire incidents reported | |
|---|---|
| Sreet name | Count |
| CEDAR ST | 76 |
| 136 HWY | 70 |
| FLORIDA ST | 70 |
| MAIN ST | 64 |
| WILSON ST | 58 |
| FAIRLANES ST | 44 |
| INDUSTRIAL BLVD | 38 |
| 10TH | 34 |
| 6TH ST | 34 |
| BOYD ST | 34 |
| ELMORE DR | 34 |
| HEDGECOKE ST | 34 |
| MCGEE ST | 34 |
| 152 HWY | 30 |
| COBLE ST | 30 |
| GRAND ST | 30 |
| HWY 136 | 30 |
| PECAN ST | 30 |
| BRAIN ST | 28 |
| CALICHE ST | 28 |
| CLAYTON ST | 28 |
| COOLEY DR | 28 |
| FM 280 | 28 |
| MONROE ST | 28 |
| HWY 152 | 26 |
| JACKSON ST | 26 |
| HEMLOCK ST | 24 |
| ROOSEVELT ST | 24 |
| 10TH ST | 22 |
| MADISON ST | 22 |
| Other | 960 |
2002 - 2018 National Fire Incident Reporting System (NFIRS) incidents
- Incident types reported to NFIRS in Borger, TX
- 5,95554.0%Rescue & EMS
- 2,04618.6%Fire
- 1,60114.5%Hazardous Condition
- 4624.2%Good Intent Call
- 3993.6%Service Call
- 3613.3%False Alarm
- 1321.2%Severe Weather
- 480.4%Special Incident
- 150.1%Overpressure Rupture
- Fire incident types reported to NFIRS in Borger, TX
- 1,21759.5%Outside Fires
- 53826.3%Structure Fires
- 1869.1%Mobile Property/Vehicle Fires
- 1055.1%Other
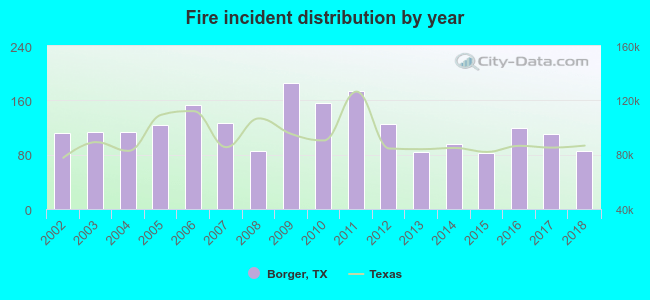 Based on the data from the years 2002 - 2018 the average number of fires per year is 120. The highest number of reported fire incidents - 186 took place in 2009, and the least - 83 in 2015. The data has a dropping trend.
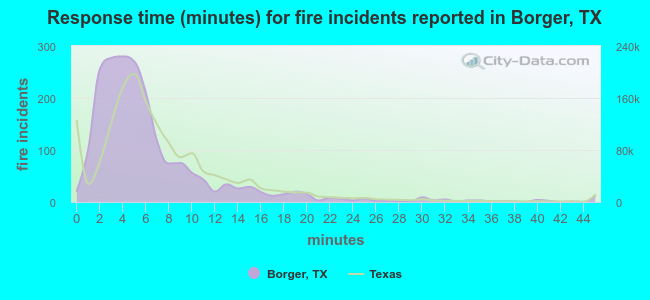 The median response time based on all reported fire incidents is 5 minutes. This is lower compared to the Texas median value.
The median response time in Borger, TX compared to nearest cities:
(Note: Based on data for all years, including only cities with at least 500 fire incidents)
| Borger: | 5 minutes |
| Fritch: | 8 minutes |
| Panhandle: | 14 minutes |
| Pampa: | 4 minutes |
| Dumas: | 6 minutes |
| Spearman: | 10 minutes |
| Amarillo: | 5 minutes |
| McLean: | 10 minutes |
| Canyon: | 9 minutes |
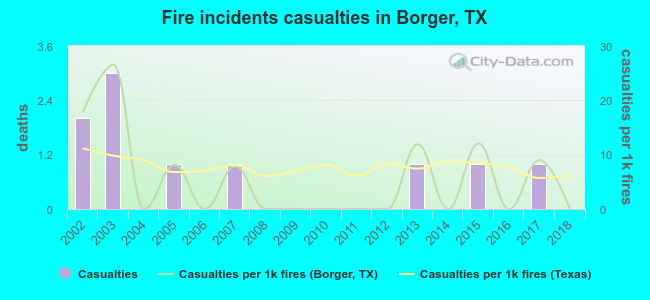 Based on the reports from the years 2002 - 2018 the average number of fire-related yearly casualties is 1. The highest number of casualties - 3 took place in 2003, and the lowest - 0 in 2004. The data has a declining trend.
The average number of injuries per 1,000 fire incidents is 5. This indicator was the highest - 27 in 2003, and the lowest 0 in 2004. The trend for casualties per 1,000 fire incidents is dropping. Compared to the Texas value the number of injuries per 1,000 incidents is lower.
Based on the reports from the years 2002 - 2018 the average number of fire-related yearly casualties is 1. The highest number of casualties - 3 took place in 2003, and the lowest - 0 in 2004. The data has a declining trend.
The average number of injuries per 1,000 fire incidents is 5. This indicator was the highest - 27 in 2003, and the lowest 0 in 2004. The trend for casualties per 1,000 fire incidents is dropping. Compared to the Texas value the number of injuries per 1,000 incidents is lower.
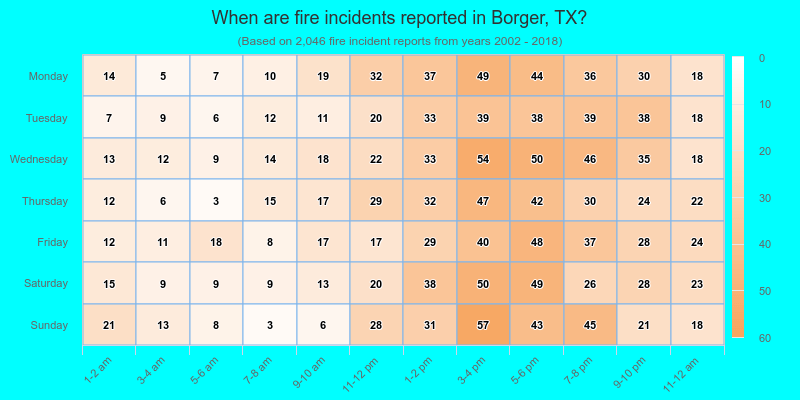
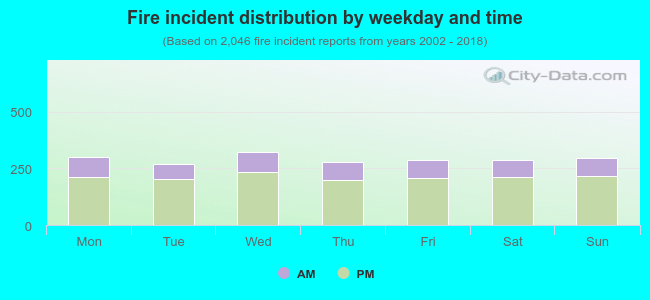 27.3% incidents where reported in the morning and 72.7% in the evening. The most fires (15.8%) took place on Wednesday, and the least (13.2%) on Tuesday.
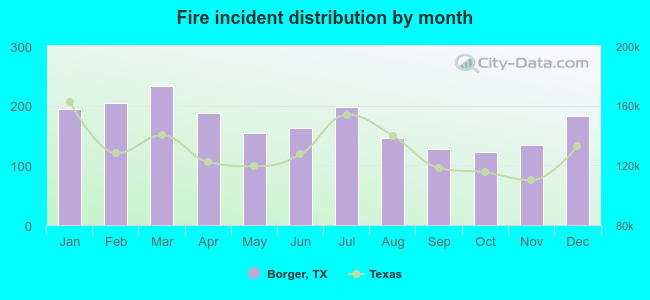 According to the 2,046 fire incidents from years 2002 - 2018 most fires (11.4%) took place during March, and the least (6.0%) in October.
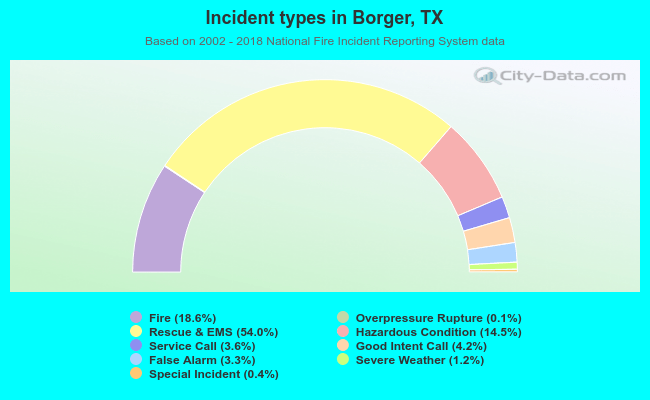 Out of all 11,019 cases reported during the years 2002 - 2018, the most belonged to the categories: Rescue & EMS (54.0%), Fire (18.6%), and Hazardous Condition (14.5%).
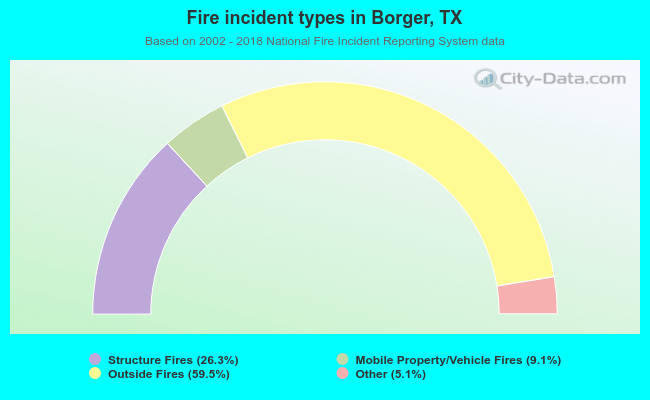 When looking into fire subcategories, the most reports belonged to: Outside Fires (59.5%), and Structure Fires (26.3%).