Blythe: Fire Incidents, California (CA)
Where are fire incidents reported in Blythe, CA
Something went wrong! Please refresh the page.
|
| |||||||||||||||||||||||||||||||||||||||||||||||||||||||||||||||||||||||||||||||||||||||||||||||||||||||||||||
2005 - 2018 National Fire Incident Reporting System (NFIRS) incidents
- Incident types reported to NFIRS in Blythe, CA
- 18346.2%Rescue & EMS
- 10727.0%Fire
- 4812.1%False Alarm
- 184.5%Hazardous Condition
- 184.5%Service Call
- 184.5%Good Intent Call
- 41.0%Special Incident
- Fire incident types reported to NFIRS in Blythe, CA
- 3936.4%Outside Fires
- 3028.0%Mobile Property/Vehicle Fires
- 2624.3%Structure Fires
- 1211.2%Other
 According to the data from the years 2005 - 2018 the average number of fires per year is 8. The highest number of reported fires - 18 took place in 2013, and the least - 1 in 2008. The data has a growing trend.
The average number of yearly fire incidents per 10k residents in Blythe, CA compared to nearest cities:
(Note: Based on data for the last 3 years, including only cities with population 5,000 and above)
| Blythe: | 3.3 |
| Calipatria: | 4.4 |
| Brawley: | 21.6 |
| Holtville: | 75.3 |
| Imperial: | 22.6 |
| El Centro: | 51.5 |
| Calexico: | 27.1 |
| Mecca: | 3.5 |
| Oasis: | 1.5 |

 43.9% incidents where reported in the morning and 56.1% in the evening. The most fires (17.8%) took place on Sunday, and the least (10.3%) on Saturday.
 Based on the 107 incident reports from years 2005 - 2018 most fires (15.0%) took place during October, and the least (3.7%) in April.
 Out of all 396 cases reported during the years 2005 - 2018, the most belonged to the categories: Overpressure Rupture (46.2%), Fire (27.0%), and Good Intent Call (12.1%).
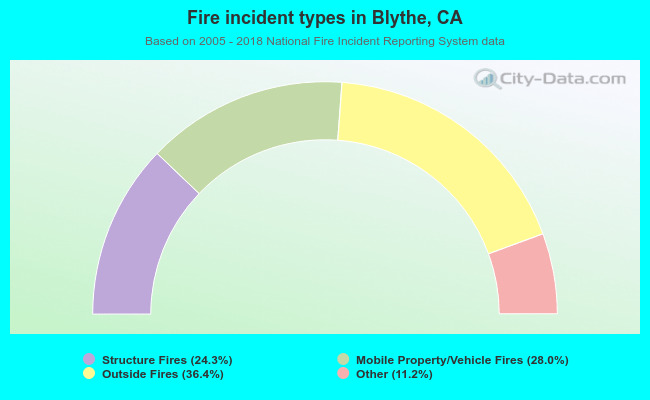 When looking into fire subcategories, the most reports belonged to: Outside Fires (36.4%), and Mobile Property/Vehicle Fires (28.0%).