Bloomingdale: Fire Incidents, Illinois (IL)
Where are fire incidents reported in Bloomingdale, IL
Something went wrong! Please refresh the page.
| Fire incidents reported | |
|---|---|
| Sreet name | Count |
| ARMY TRAIL RD | 158 |
| LAKE ST | 80 |
| STRATFORD DR | 68 |
| LAKE STREET | 64 |
| ARMY TRAIL RD | 60 |
| BLOOMINGDALE RD | 58 |
| GARY AVE | 54 |
| GLEN ELLYN RD | 54 |
| ARMY TRAIL ROAD | 48 |
| STRATFORD PL | 48 |
| SCHICK RD | 46 |
| GLEN ELLYN ROAD | 44 |
| GARY AVENUE | 42 |
| REGENCY DR | 36 |
| SCHICK ROAD | 28 |
| WINDSOR DR | 26 |
| CARDINAL DRIVE | 24 |
| EDGEWATER DRIVE | 24 |
| GLENGARRY DR | 24 |
| GLENWOOD DR | 24 |
| BLOOMINGDALE ROAD | 22 |
| LAKE ST | 22 |
| LAKEVIEW DRIVE | 22 |
| EDGEWATER DR | 20 |
| LAKEVIEW DR | 20 |
| STRATFORD DRIVE | 20 |
| COLONY GREEN DRIVE | 18 |
| FAIRFIELD WAY | 18 |
| GREENWAY DR | 18 |
| CIRCLE AVE | 16 |
| Other | 363 |
2002 - 2018 National Fire Incident Reporting System (NFIRS) incidents
- Incident types reported to NFIRS in Bloomingdale, IL
- 12,74560.6%Rescue & EMS
- 2,41611.5%False Alarm
- 1,5967.6%Hazardous Condition
- 1,5697.5%Fire
- 1,5357.3%Service Call
- 1,1015.2%Good Intent Call
- 430.2%Special Incident
- Fire incident types reported to NFIRS in Bloomingdale, IL
- 83253.0%Structure Fires
- 49631.6%Outside Fires
- 1509.6%Mobile Property/Vehicle Fires
- 915.8%Other
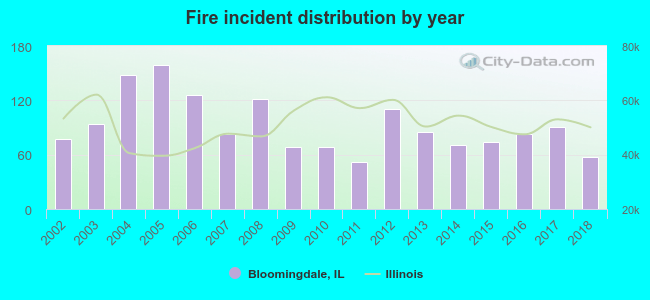 According to the data from the years 2002 - 2018 the average number of fire incidents per year is 92. The highest number of reported fires - 159 took place in 2005, and the least - 52 in 2011. The data has a declining trend.
The average number of yearly fire incidents per 10k residents in Bloomingdale, IL compared to nearest cities:
(Note: Based on data for the last 3 years, including only cities with population 5,000 and above)
| Bloomingdale: | 34.5 |
| Glendale Heights: | 27.1 |
| Roselle: | 37.8 |
| Carol Stream: | 21.1 |
| Itasca: | 53.8 |
| Hanover Park: | 24.4 |
| Addison: | 33.4 |
| Wood Dale: | 30.6 |
| Glen Ellyn: | 26.9 |
 The median response time based on all reported fire incidents is 5 minutes. This is close to the Illinois median value.
The median response time in Bloomingdale, IL compared to nearest cities:
(Note: Based on data for all years, including only cities with at least 500 fire incidents)
| Bloomingdale: | 5 minutes |
| Glendale Heights: | 5 minutes |
| Roselle: | 6 minutes |
| Carol Stream: | 5 minutes |
| Itasca: | 6 minutes |
| Hanover Park: | 4 minutes |
| Addison: | 5 minutes |
| Wood Dale: | 5 minutes |
| Glen Ellyn: | 6 minutes |
 Based on the reports from the years 2002 - 2018 the average number of fire-related yearly casualties is 1. The highest number of reported injuries - 3 took place in 2012, and the lowest - 0 in 2003. The data has a declining trend.
The average number of casualties per 1,000 fires is 14. This indicator was the highest - 38 in 2011, and the lowest 0 in 2003. The trend for casualties per 1,000 incidents is dropping. Compared to the Illinois value the number of casualties per 1,000 fire incidents is similar.
Based on the reports from the years 2002 - 2018 the average number of fire-related yearly casualties is 1. The highest number of reported injuries - 3 took place in 2012, and the lowest - 0 in 2003. The data has a declining trend.
The average number of casualties per 1,000 fires is 14. This indicator was the highest - 38 in 2011, and the lowest 0 in 2003. The trend for casualties per 1,000 incidents is dropping. Compared to the Illinois value the number of casualties per 1,000 fire incidents is similar.Casualties per 1,000 incidents in Bloomingdale, IL compared to nearest cities:
(Note: Based on data for all years, including only cities with at least 500 fire incidents)
| Bloomingdale: | 12.1 |
| Glendale Heights: | 20.1 |
| Roselle: | 12.6 |
| Carol Stream: | 7.4 |
| Itasca: | 13.4 |
| Hanover Park: | 36.5 |
| Addison: | 15.0 |
| Wood Dale: | 13.0 |
| Glen Ellyn: | 12.2 |
 32.3% incidents where reported in the morning and 67.7% in the evening. The most fires (17.1%) took place on Saturday, and the least (10.8%) on Tuesday.
 According to the 1,569 fires from years 2002 - 2018 most fires (11.3%) took place during April, and the least (5.9%) in March.
 Out of all 21,030 cases reported during the years 2002 - 2018, the most belonged to the categories: Rescue & EMS (60.6%), False Alarm (11.5%), and Hazardous Condition (7.6%).
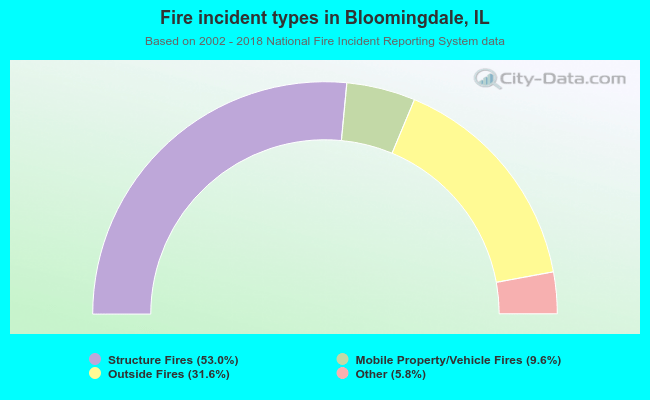 When looking into fire subcategories, the most reports belonged to: Structure Fires (53.0%), and Outside Fires (31.6%).