Blacksburg: Fire Incidents, Virginia (VA)
Where are fire incidents reported in Blacksburg, VA
Something went wrong! Please refresh the page.
| Fire incidents reported | |
|---|---|
| Sreet name | Count |
| MAIN ST | 280 |
| ROANOKE ST | 212 |
| UNIVERSITY CITY BLVD | 146 |
| PATRICK HENRY DR | 128 |
| PRICES FORK RD | 120 |
| HUNT CLUB RD | 110 |
| PROGRESS ST | 110 |
| MERRIMAC RD | 102 |
| TURNER ST | 80 |
| HETHWOOD BLVD | 68 |
| 460 | 66 |
| CLOVER VALLEY CIR | 58 |
| PHEASANT RUN CIR | 58 |
| SENECA DR | 58 |
| JACKSON ST | 56 |
| MOUNT TABOR RD | 56 |
| JENNELLE RD | 48 |
| GLADE RD | 44 |
| MEADOWBROOK DR | 44 |
| PLANTATION RD | 44 |
| SUNRIDGE DR | 44 |
| WASHINGTON ST | 44 |
| GIVENS LANE | 42 |
| CRAIG CREEK RD | 40 |
| HUNTER'S MILL RD | 40 |
| LANE STADIUM | 38 |
| HENRY LANE | 34 |
| RT. 460 | 34 |
| TOMS CREEK RD | 34 |
| WEST CAMPUS DR | 34 |
| Other | 291 |
2002 - 2018 National Fire Incident Reporting System (NFIRS) incidents
- Incident types reported to NFIRS in Blacksburg, VA
- 2,77332.0%False Alarm
- 2,56329.5%Fire
- 1,37915.9%Hazardous Condition
- 8249.5%Rescue & EMS
- 6737.8%Good Intent Call
- 4515.2%Service Call
- Fire incident types reported to NFIRS in Blacksburg, VA
- 1,33552.1%Outside Fires
- 88934.7%Structure Fires
- 2228.7%Mobile Property/Vehicle Fires
- 1174.6%Other
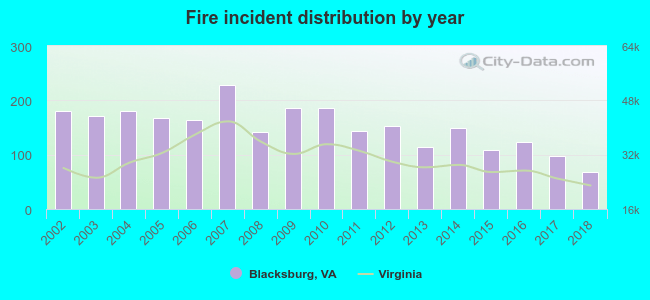 Based on the data from the years 2002 - 2018 the average number of fires per year is 151. The highest number of reported fires - 229 took place in 2007, and the least - 69 in 2018. The data has a dropping trend.
The average number of yearly fire incidents per 10k residents in Blacksburg, VA compared to nearest cities:
(Note: Based on data for the last 3 years, including only cities with population 5,000 and above)
| Blacksburg: | 22.0 |
| Christiansburg: | 55.5 |
| Radford: | 30.4 |
| Salem: | 28.3 |
| Pulaski: | 71.5 |
| Roanoke: | 50.6 |
| Hollins: | 1.4 |
| Vinton: | 79.9 |
| Wytheville: | 62.3 |
 The median response time based on all reported fire incidents is 5 minutes. This is lower compared to the state median value.
The median response time in Blacksburg, VA compared to nearest cities:
(Note: Based on data for all years, including only cities with at least 500 fire incidents)
| Blacksburg: | 5 minutes |
| Christiansburg: | 7 minutes |
| Radford: | 5 minutes |
| Dublin: | 7 minutes |
| Salem: | 5 minutes |
| Floyd: | 16 minutes |
| Pulaski: | 5 minutes |
| Roanoke: | 5 minutes |
| Vinton: | 10 minutes |
 According to the data from the years 2002 - 2018 the average number of fire-related fatalities per year is 0. The highest number of deaths - 1 took place in 2005, and the lowest - 0 in 2002. The data has a constant trend.
The average number of deaths per 1,000 fires is 1. This indicator was the highest - 7 in 2014, and the lowest 0 in 2002. The trend for deaths per 1,000 fires is constant. Compared to the Virginia value the number of fatalities per 1,000 fire incidents is lower.
According to the data from the years 2002 - 2018 the average number of fire-related fatalities per year is 0. The highest number of deaths - 1 took place in 2005, and the lowest - 0 in 2002. The data has a constant trend.
The average number of deaths per 1,000 fires is 1. This indicator was the highest - 7 in 2014, and the lowest 0 in 2002. The trend for deaths per 1,000 fires is constant. Compared to the Virginia value the number of fatalities per 1,000 fire incidents is lower.Deaths per 1,000 incidents in Blacksburg, VA compared to nearest cities:
(Note: Based on data for all years, including only cities with at least 2,500 fire incidents)
| Blacksburg: | 1.2 |
| Roanoke: | 3.2 |
 According to the reports from the years 2002 - 2018 the average number of fire-related yearly casualties is 2. The highest number of reported casualties - 8 took place in 2010, and the lowest - 0 in 2006. The data has a dropping trend.
The average number of injuries per 1,000 fires is 13. This indicator was the highest - 47 in 2014, and the lowest 0 in 2006. The trend for injuries per 1,000 fires is declining. Compared to the state value the number of injuries per 1,000 incidents is similar.
According to the reports from the years 2002 - 2018 the average number of fire-related yearly casualties is 2. The highest number of reported casualties - 8 took place in 2010, and the lowest - 0 in 2006. The data has a dropping trend.
The average number of injuries per 1,000 fires is 13. This indicator was the highest - 47 in 2014, and the lowest 0 in 2006. The trend for injuries per 1,000 fires is declining. Compared to the state value the number of injuries per 1,000 incidents is similar.
 37.7% incidents where reported in the morning and 62.3% in the evening. The most fires (18.2%) took place on Sunday, and the least (12.3%) on Tuesday.
 According to the 2,563 fire incident reports from years 2002 - 2018 most fires (13.0%) took place during April, and the least (5.8%) in December.
 Out of all 8,677 cases reported during the years 2002 - 2018, the most belonged to the categories: False Alarm (32.0%), Fire (29.5%), and Hazardous Condition (15.9%).
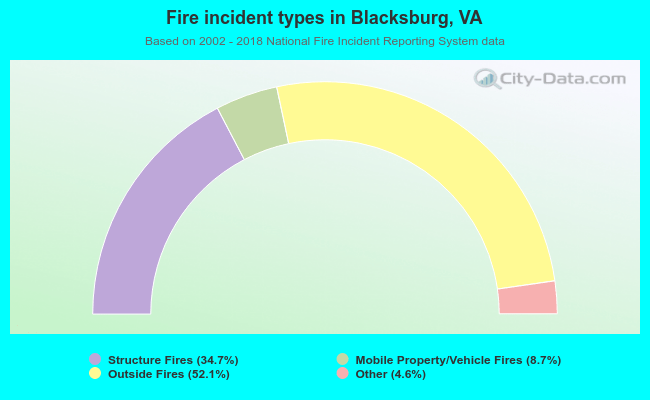 When looking into fire subcategories, the most incidents belonged to: Outside Fires (52.1%), and Structure Fires (34.7%).