Berea: Fire Incidents, Kentucky (KY)
Where are fire incidents reported in Berea, KY
Something went wrong! Please refresh the page.
| Fire incidents reported | |
|---|---|
| Sreet name | Count |
| RED LICK RD | 154 |
| BATTLEFIELD MEMORIAL HWY | 124 |
| DREYFUS RD | 104 |
| OWSLEY FORK RD | 74 |
| MAYDE RD | 70 |
| SLATE LICK RD | 64 |
| CHESTNUT ST | 60 |
| MCKEE RD | 54 |
| BIG HILL RD | 52 |
| MENELAUS RD | 52 |
| I-75 HWY | 48 |
| GLADES RD | 46 |
| MASON LAKE RD | 46 |
| RICHMOND RD | 46 |
| SCAFFOLD CANE RD | 42 |
| GRAVEL LICK RD | 40 |
| WOLF GAP RD | 40 |
| BLUE LICK RD | 38 |
| I75 | 36 |
| GRAVEL LICK BRANCH RD | 34 |
| PRINCE ROYAL DR | 34 |
| WALNUT MEADOW RD | 34 |
| ALEXANDER RD | 32 |
| BROOKLYN BLVD | 32 |
| JEFFERSON ST | 30 |
| WILSON LN | 30 |
| MT. VERNON RD | 28 |
| FLOYD BRANCH RD | 26 |
| PAINT LICK RD | 26 |
| DOGWOOD DR | 24 |
| Other | 531 |
2002 - 2018 National Fire Incident Reporting System (NFIRS) incidents
- Incident types reported to NFIRS in Berea, KY
- 2,05138.2%Fire
- 97818.2%Hazardous Condition
- 70813.2%Rescue & EMS
- 54910.2%False Alarm
- 5249.8%Good Intent Call
- 4368.1%Service Call
- 921.7%Special Incident
- 190.4%Severe Weather
- 130.2%Overpressure Rupture
- Fire incident types reported to NFIRS in Berea, KY
- 82140.0%Structure Fires
- 78638.3%Outside Fires
- 31815.5%Mobile Property/Vehicle Fires
- 1266.1%Other
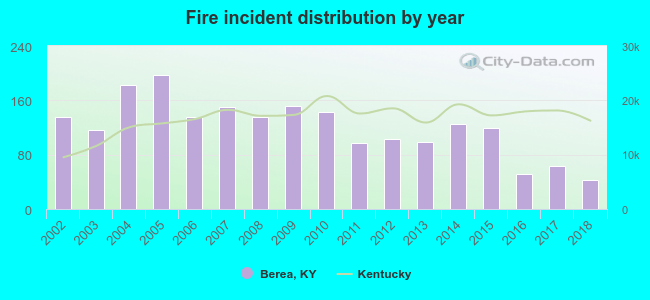 Based on the data from the years 2002 - 2018 the average number of fire incidents per year is 121. The highest number of reported fire incidents - 198 took place in 2005, and the least - 43 in 2018. The data has a dropping trend.
The average number of yearly fire incidents per 10k residents in Berea, KY compared to nearest cities:
(Note: Based on data for the last 3 years, including only cities with population 5,000 and above)
| Berea: | 36.2 |
| Richmond: | 89.8 |
| Waynesburg: | 64.9 |
| Nicholasville: | 62.1 |
| Danville: | 54.6 |
| Wilmore: | 12.5 |
| Winchester: | 95.6 |
| Harrodsburg: | 106.4 |
| London: | 195.7 |
 The median response time based on all reported fire incidents is 9 minutes. This is higher compared to the Kentucky median value.
The median response time in Berea, KY compared to nearest cities:
(Note: Based on data for all years, including only cities with at least 500 fire incidents)
| Berea: | 9 minutes |
| Richmond: | 7 minutes |
| Brodhead: | 9 minutes |
| Lancaster: | 10 minutes |
| McKee: | 11 minutes |
| Irvine: | 13 minutes |
| Stanford: | 11 minutes |
| Nicholasville: | 6 minutes |
| Danville: | 5 minutes |
 According to the data from the years 2002 - 2018 the average number of fire-related fatalities per year is 0. The highest number of deaths - 3 took place in 2004, and the lowest - 0 in 2002. The data has a constant trend.
 Based on the reports from the years 2002 - 2018 the average number of fire-related casualties per year is 1. The highest number of casualties - 3 took place in 2007, and the lowest - 0 in 2006. The data has a decreasing trend.
The average number of injuries per 1,000 fire incidents is 6. This indicator was the highest - 20 in 2007, and the lowest 0 in 2006. The trend for casualties per 1,000 fire incidents is declining. Compared to the Kentucky value the number of injuries per 1,000 incidents is similar.
Based on the reports from the years 2002 - 2018 the average number of fire-related casualties per year is 1. The highest number of casualties - 3 took place in 2007, and the lowest - 0 in 2006. The data has a decreasing trend.
The average number of injuries per 1,000 fire incidents is 6. This indicator was the highest - 20 in 2007, and the lowest 0 in 2006. The trend for casualties per 1,000 fire incidents is declining. Compared to the Kentucky value the number of injuries per 1,000 incidents is similar.
 30.5% incidents where reported in the morning and 69.5% in the evening. The most fires (16.0%) took place on Tuesday, and the least (12.5%) on Thursday.
 Based on the 2,051 reports from years 2002 - 2018 most fires (13.7%) took place during March, and the least (6.2%) in May.
 Out of all 5,370 cases reported during the years 2002 - 2018, the most belonged to the categories: Fire (38.2%), Hazardous Condition (18.2%), and Rescue & EMS (13.2%).
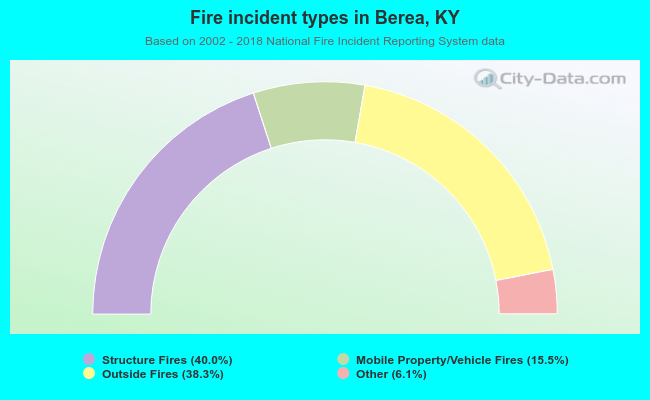 When looking into fire subcategories, the most reports belonged to: Structure Fires (40.0%), and Outside Fires (38.3%).