Bedford: Fire Incidents, Virginia (VA)
Where are fire incidents reported in Bedford, VA
Something went wrong! Please refresh the page.
| Fire incidents reported | |
|---|---|
| Sreet name | Count |
| LYNCHBURG SALEM TPKE | 226 |
| MAIN ST | 104 |
| BLUE RIDGE AVE | 76 |
| PEAKS RD | 68 |
| DICKERSON MILL RD | 60 |
| MONETA RD | 60 |
| FALLING CREEK RD | 58 |
| CENTERVILLE RD | 54 |
| FOREST RD | 48 |
| LONGWOOD AVE | 46 |
| SHINGLE BLOCK RD | 46 |
| PEAKS ST | 38 |
| PATTERSON MILL RD | 36 |
| ROCKY FORD RD | 36 |
| SOUTH ST | 36 |
| BIG ISLAND HWY | 32 |
| FORBES MILL RD | 30 |
| WHEATLAND RD | 30 |
| BEDFORD AVE | 28 |
| BURKS HILL RD | 28 |
| ORANGE ST | 28 |
| ROCK CLIFF RD | 28 |
| JOPLING RD | 26 |
| OTTER HILL RD | 26 |
| ROUNDTREE DR | 26 |
| GLENWOOD DR | 24 |
| LANKFORD MILL RD | 24 |
| MCDANIEL RD | 24 |
| TIMBER RIDGE RD | 24 |
| BELL TOWN RD | 20 |
| Other | 594 |
2002 - 2018 National Fire Incident Reporting System (NFIRS) incidents
- Incident types reported to NFIRS in Bedford, VA
- 4,36243.7%Rescue & EMS
- 1,98419.9%Fire
- 1,49415.0%Good Intent Call
- 1,13911.4%Hazardous Condition
- 5555.6%Service Call
- 3883.9%False Alarm
- 370.4%Special Incident
- 150.2%Severe Weather
- 110.1%Overpressure Rupture
- Fire incident types reported to NFIRS in Bedford, VA
- 1,09155.0%Structure Fires
- 62231.4%Outside Fires
- 23111.6%Mobile Property/Vehicle Fires
- 402.0%Other
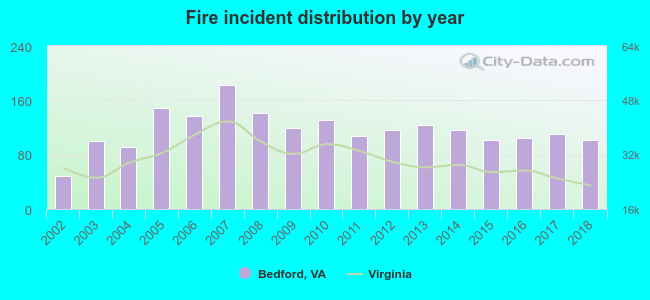 Based on the data from the years 2002 - 2018 the average number of fires per year is 117. The highest number of reported fires - 183 took place in 2007, and the least - 48 in 2002. The data has a growing trend.
The average number of yearly fire incidents per 10k residents in Bedford, VA compared to nearest cities:
(Note: Based on data for the last 3 years, including only cities with population 5,000 and above)
| Bedford: | 163.4 |
| Forest: | 44.3 |
| Timberlake: | 0.8 |
| Lynchburg: | 28.0 |
| Vinton: | 79.9 |
| Madison Heights: | 66.8 |
| Hollins: | 1.4 |
| Roanoke: | 50.6 |
| Buena Vista: | 75.7 |
 The median response time based on all reported fire incidents is 10 minutes. This is higher than the state median value.
The median response time in Bedford, VA compared to nearest cities:
(Note: Based on data for all years, including only cities with at least 500 fire incidents)
| Bedford: | 10 minutes |
| Forest: | 9 minutes |
| Buchanan: | 14 minutes |
| Blue Ridge: | 11 minutes |
| Lynchburg: | 5 minutes |
| Troutville: | 9 minutes |
| Hurt: | 12 minutes |
| Vinton: | 10 minutes |
| Madison Heights: | 12 minutes |
 According to the reports from the years 2002 - 2018 the average number of fire-related casualties per year is 0. The highest number of reported injuries - 1 took place in 2011, and the lowest - 0 in 2002. The data has a constant trend.
The average number of injuries per 1,000 fires is 2. This indicator was the highest - 10 in 2015, and the lowest 0 in 2002. The trend for casualties per 1,000 incidents is constant. Compared to the Virginia value the number of injuries per 1,000 fire incidents is much lower.
According to the reports from the years 2002 - 2018 the average number of fire-related casualties per year is 0. The highest number of reported injuries - 1 took place in 2011, and the lowest - 0 in 2002. The data has a constant trend.
The average number of injuries per 1,000 fires is 2. This indicator was the highest - 10 in 2015, and the lowest 0 in 2002. The trend for casualties per 1,000 incidents is constant. Compared to the Virginia value the number of injuries per 1,000 fire incidents is much lower.Casualties per 1,000 incidents in Bedford, VA compared to nearest cities:
(Note: Based on data for all years, including only cities with at least 500 fire incidents)
| Bedford: | 1.5 |
| Forest: | 1.1 |
| Buchanan: | 0.0 |
| Blue Ridge: | 4.0 |
| Lynchburg: | 14.3 |
| Troutville: | 1.3 |
| Hurt: | 1.7 |
| Vinton: | 1.8 |
| Madison Heights: | 10.7 |
 32.2% incidents where reported in the morning and 67.8% in the evening. The most fires (15.6%) took place on Tuesday, and the least (12.4%) on Sunday.
 Based on the 1,984 fire incident reports from years 2002 - 2018 most fires (12.4%) took place during March, and the least (4.7%) in September.
 Out of all 9,985 cases reported during the years 2002 - 2018, the most belonged to the categories: Rescue & EMS (43.7%), Fire (19.9%), and Good Intent Call (15.0%).
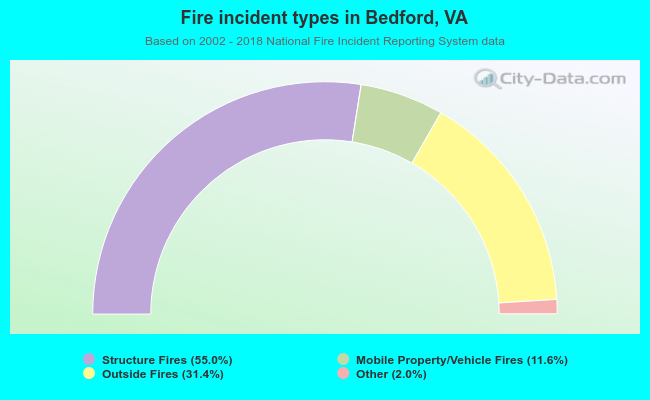 When looking into fire subcategories, the most reports belonged to: Structure Fires (55.0%), and Outside Fires (31.4%).