Azusa: Fire Incidents, California (CA)
Where are fire incidents reported in Azusa, CA
Something went wrong! Please refresh the page.
| Fire incidents reported | |
|---|---|
| Sreet name | Count |
| AZUSA | 102 |
| FOOTHILL | 80 |
| CITRUS | 68 |
| ALOSTA | 62 |
| ARROW | 62 |
| GLADSTONE | 62 |
| SAN GABRIEL | 62 |
| ALAMEDA | 40 |
| DALTON | 36 |
| CERRITOS | 34 |
| SIERRA MADRE | 34 |
| 1ST | 24 |
| 8TH | 24 |
| VERNON | 24 |
| 5TH | 22 |
| SAN GABRIEL CANYON | 22 |
| ANGELENO | 20 |
| ORANGE | 18 |
| VIRGINIA | 18 |
| ROCKVALE | 16 |
| SOLDANO | 16 |
| 11TH | 14 |
| 6TH | 14 |
| AZUSA AV210 | 14 |
| ENID | 14 |
| NEWBURGH | 14 |
| 10TH | 12 |
| BARBARA | 12 |
| FISH CANYON | 12 |
| LOUISE | 12 |
2002 - 2018 National Fire Incident Reporting System (NFIRS) incidents
- Incident types reported to NFIRS in Azusa, CA
- 10,74869.2%Rescue & EMS
- 2,46515.9%Good Intent Call
- 7614.9%False Alarm
- 7574.9%Fire
- 4192.7%Hazardous Condition
- 3492.2%Service Call
- 200.1%Special Incident
- Fire incident types reported to NFIRS in Azusa, CA
- 30840.7%Outside Fires
- 25133.2%Structure Fires
- 15820.9%Mobile Property/Vehicle Fires
- 405.3%Other
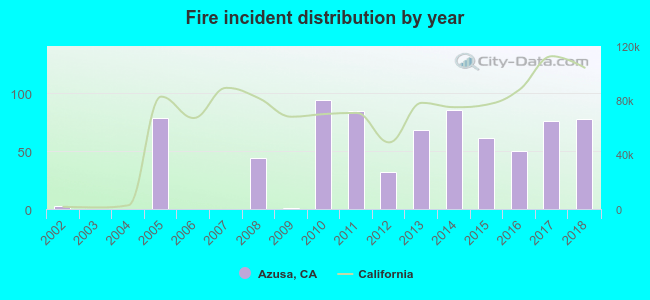 According to the data from the years 2002 - 2018 the average number of fires per year is 45. The highest number of reported fire incidents - 94 took place in 2010, and the least - 0 in 2003. The data has a rising trend.
The average number of yearly fire incidents per 10k residents in Azusa, CA compared to nearest cities:
(Note: Based on data for the last 3 years, including only cities with population 5,000 and above)
| Azusa: | 13.9 |
| Glendora: | 14.1 |
| Covina: | 12.7 |
| Duarte: | 13.0 |
| Charter Oak: | 6.4 |
| Baldwin Park: | 8.9 |
| West Covina: | 5.2 |
| Monrovia: | 21.6 |
| San Dimas: | 14.6 |
 The median response time based on all reported fire incidents is 5 minutes. This is lower compared to the state median value.
The median response time in Azusa, CA compared to nearest cities:
(Note: Based on data for all years, including only cities with at least 500 fire incidents)
| Azusa: | 5 minutes |
| Glendora: | 5 minutes |
| Covina: | 4 minutes |
| Baldwin Park: | 5 minutes |
| West Covina: | 6 minutes |
| Monrovia: | 5 minutes |
| San Dimas: | 5 minutes |
| Arcadia: | 5 minutes |
| La Verne: | 5 minutes |
 31.2% incidents where reported in the morning and 68.8% in the evening. The most fires (16.4%) took place on Sunday, and the least (13.1%) on Wednesday.
 According to the 757 fire incidents from years 2002 - 2018 most fires (13.1%) took place during July, and the least (5.8%) in November.
 Out of all 15,523 cases reported during the years 2002 - 2018, the most belonged to the categories: Rescue & EMS (69.2%), Good Intent Call (15.9%), and False Alarm (4.9%).
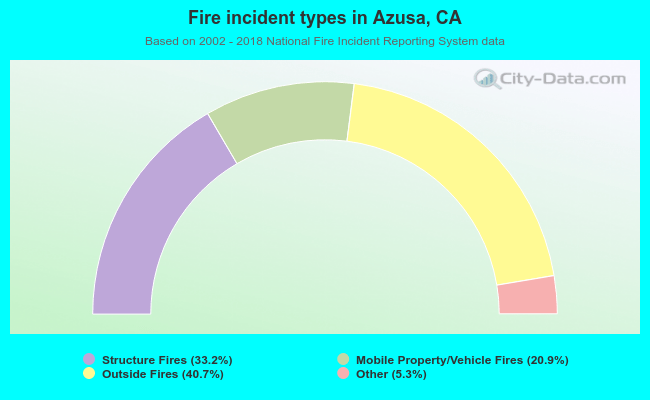 When looking into fire subcategories, the most incidents belonged to: Outside Fires (40.7%), and Structure Fires (33.2%).