Athens: Fire Incidents, Texas (TX)
Where are fire incidents reported in Athens, TX
Something went wrong! Please refresh the page.
| Fire incidents reported | |
|---|---|
| Sreet name | Count |
| FM 59 | 102 |
| FM 753 | 82 |
| COLLEGE ST | 76 |
| LOOP 7 | 68 |
| CORSICANA ST | 66 |
| TYLER | 56 |
| FM 2494 | 52 |
| FM 1615 | 46 |
| FM 1861 | 44 |
| PALESTINE ST | 42 |
| HWY 19 S | 40 |
| TYLER ST | 40 |
| CORSICANA | 38 |
| 175 HWY | 36 |
| 31 HWY | 36 |
| HWY 19 | 36 |
| 7 LOOP | 34 |
| FM 2495 | 30 |
| JONATHAN | 30 |
| FM 317 | 28 |
| PRAIRIEVILLE ST | 28 |
| COLLEGE | 26 |
| CR 1500 | 26 |
| GIBSON RD | 24 |
| HODGE | 24 |
| HWY 31 | 24 |
| MILL RUN RD | 24 |
| PALESTINE | 24 |
| US 175 E | 24 |
| BARBARA ST | 22 |
| Other | 2,246 |
2002 - 2018 National Fire Incident Reporting System (NFIRS) incidents
- Incident types reported to NFIRS in Athens, TX
- 3,47431.1%Fire
- 3,35530.0%Rescue & EMS
- 1,31311.7%Hazardous Condition
- 1,31011.7%Service Call
- 1,0809.7%Good Intent Call
- 5264.7%False Alarm
- 1000.9%Special Incident
- 160.1%Overpressure Rupture
- 140.1%Severe Weather
- Fire incident types reported to NFIRS in Athens, TX
- 2,10960.7%Outside Fires
- 84024.2%Structure Fires
- 3369.7%Mobile Property/Vehicle Fires
- 1895.4%Other
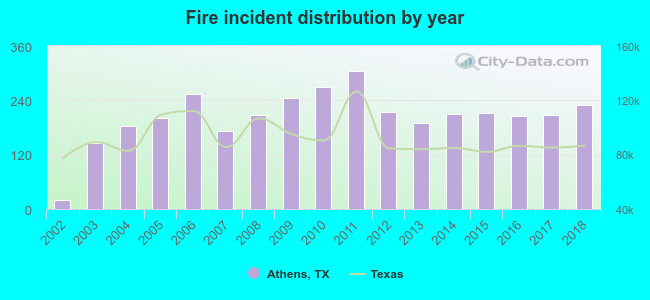 According to the data from the years 2002 - 2018 the average number of fires per year is 204. The highest number of fires - 304 took place in 2011, and the least - 20 in 2002. The data has a rising trend.
The average number of yearly fire incidents per 10k residents in Athens, TX compared to nearest cities:
(Note: Based on data for the last 3 years, including only cities with population 5,000 and above)
| Athens: | 166.9 |
| Gun Barrel City: | 119.2 |
| Palestine: | 65.4 |
| Lindale: | 274.4 |
| Tyler: | 29.8 |
| Whitehouse: | 45.6 |
| Corsicana: | 63.1 |
| Kaufman: | 162.8 |
| Jacksonville: | 25.2 |
 The median response time based on all reported fire incidents is 7 minutes. This is comparable to the Texas median value.
The median response time in Athens, TX compared to nearest cities:
(Note: Based on data for all years, including only cities with at least 500 fire incidents)
| Athens: | 7 minutes |
| Murchison: | 10 minutes |
| Malakoff: | 10 minutes |
| Eustace: | 10 minutes |
| Trinidad: | 5 minutes |
| Brownsboro: | 9 minutes |
| Payne Springs: | 10 minutes |
| Mabank: | 9 minutes |
| Gun Barrel City: | 6 minutes |
 According to the data from the years 2002 - 2018 the average number of fire-related casualties per year is 1. The highest number of reported injuries - 5 took place in 2007, and the lowest - 0 in 2002. The data has a constant trend.
The average number of casualties per 1,000 fires is 4. This indicator was the highest - 29 in 2007, and the lowest 0 in 2002. The trend for injuries per 1,000 incidents is constant. Compared to the state value the number of casualties per 1,000 fires is lower.
According to the data from the years 2002 - 2018 the average number of fire-related casualties per year is 1. The highest number of reported injuries - 5 took place in 2007, and the lowest - 0 in 2002. The data has a constant trend.
The average number of casualties per 1,000 fires is 4. This indicator was the highest - 29 in 2007, and the lowest 0 in 2002. The trend for injuries per 1,000 incidents is constant. Compared to the state value the number of casualties per 1,000 fires is lower.Casualties per 1,000 incidents in Athens, TX compared to nearest cities:
(Note: Based on data for all years, including only cities with at least 500 fire incidents)
| Athens: | 4.0 |
| Murchison: | 0.0 |
| Malakoff: | 0.0 |
| Eustace: | 0.0 |
| Trinidad: | 0.0 |
| Brownsboro: | 0.0 |
| Payne Springs: | 1.8 |
| Mabank: | 0.6 |
| Gun Barrel City: | 2.9 |
 26.1% incidents where reported in the morning and 73.9% in the evening. The most fires (16.9%) took place on Saturday, and the least (12.4%) on Thursday.
 According to the 3,474 fire incidents from years 2002 - 2018 most fires (12.6%) took place during January, and the least (5.9%) in May.
 Out of all 11,188 cases reported during the years 2002 - 2018, the most belonged to the categories: Fire (31.1%), Rescue & EMS (30.0%), and Hazardous Condition (11.7%).
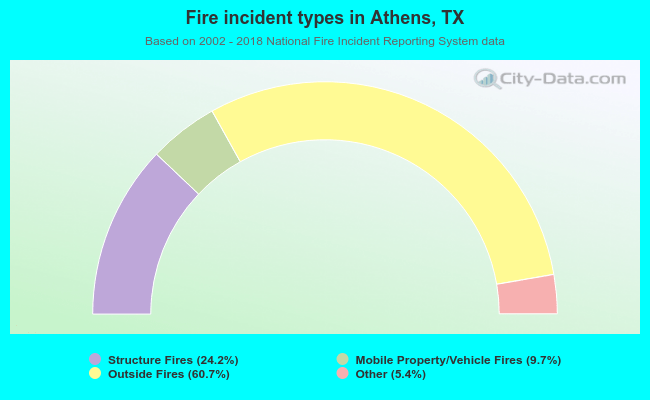 When looking into fire subcategories, the most incidents belonged to: Outside Fires (60.7%), and Structure Fires (24.2%).