Crime rate in San Antonio, Texas (TX): murders, rapes, robberies, assaults, burglaries, thefts, auto thefts, arson, law enforcement employees, police officers, crime map
Crime rate in San Antonio, TX
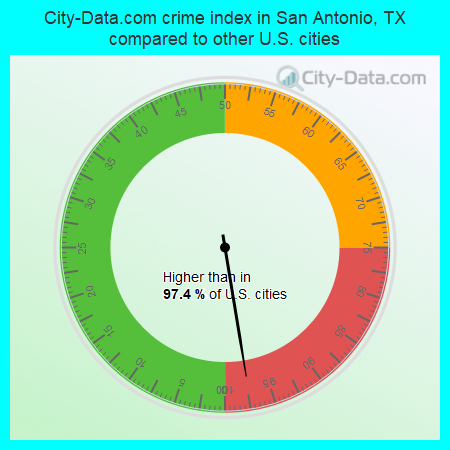
The 2022 crime rate in San Antonio, TX is 536 (City-Data.com crime index), which is 2.2 times higher than the U.S. average. It was higher than in 97.4% U.S. cities. The 2022 San Antonio crime rate rose by 31% compared to 2021. The number of homicides stood at 230 - an increase of 65 compared to 2021. In the last 5 years San Antonio has seen increasing violent crime and increasing property crime.(Note: Higher means more crime)
| San Antonio: | 535.6 |
| Olmos Park: | 126.9 |
| Balcones Heights: | 877.8 |
| Alamo Heights: | 204.7 |
| Terrell Hills: | 125.9 |
| Castle Hills: | 583.0 |
| Leon Valley: | 518.1 |
| Kirby: | 380.1 |
| Hill Country Village: | 220.4 |
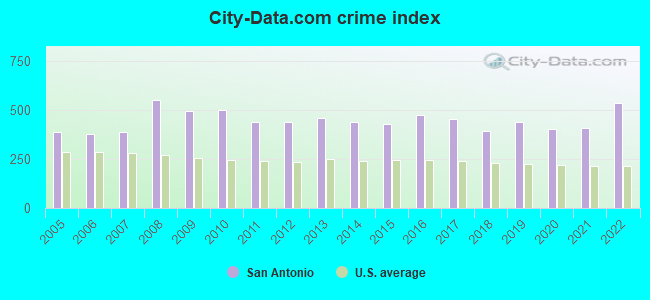
The City-Data.com crime index weighs serious crimes and violent crimes more heavily. Higher means more crime, U.S. average is 246.1. It adjusts for the number of visitors and daily workers commuting into cities.
- means the value is smaller than the state average.- means the value is about the same as the state average.
- means the value is bigger than the state average.
- means the value is much bigger than the state average.
According to our research of Texas and other state lists, there were 3,788 registered sex offenders living in San Antonio, Texas as of June 01, 2024.
The ratio of all residents to sex offenders in San Antonio is 394 to 1.
The ratio of registered sex offenders to all residents in this city is near the state average.
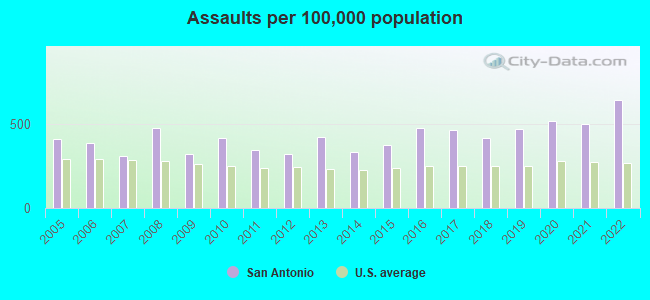
Violent crime rate in 2022
| San Antonio: | 517.9 |
| U.S. Average: | 219.8 |
Violent crime rate in 2021
| San Antonio: | 407.5 |
| U.S. Average: | 224.8 |
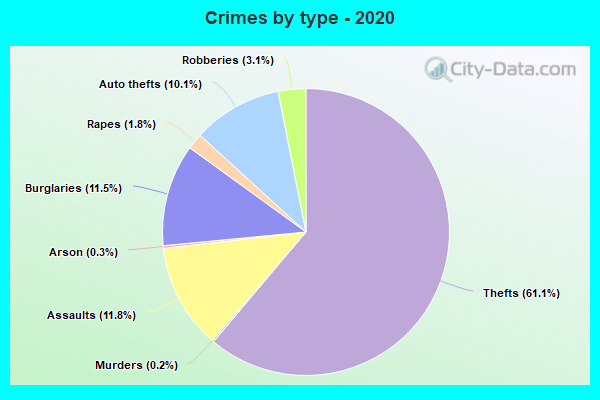
Violent crime rate in 2020
| San Antonio: | 424.6 |
| U.S. Average: | 228.2 |
Violent crime rate in 2019
| San Antonio: | 416.6 |
| U.S. Average: | 219.9 |
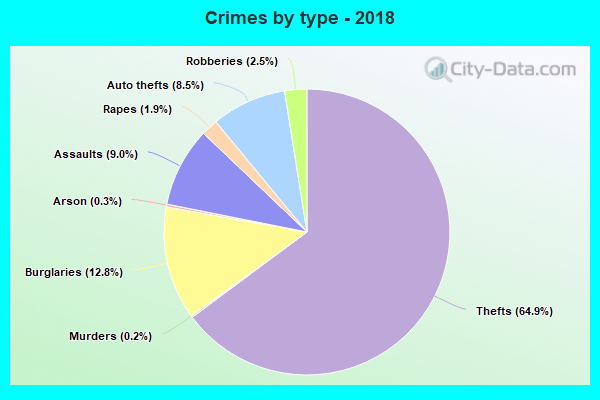
Violent crime rate in 2018
| San Antonio: | 367.5 |
| U.S. Average: | 221.2 |
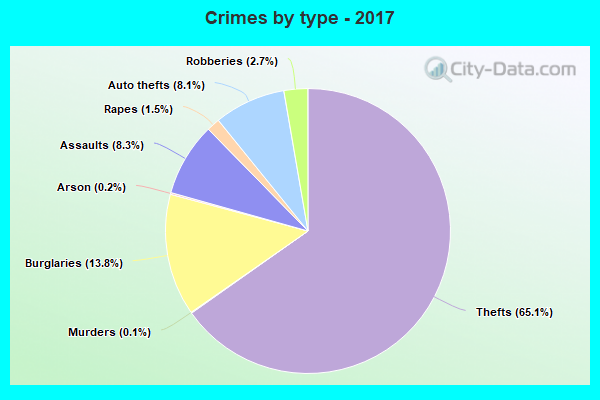
Violent crime rate in 2017
| San Antonio: | 407.7 |
| U.S. Average: | 226.2 |
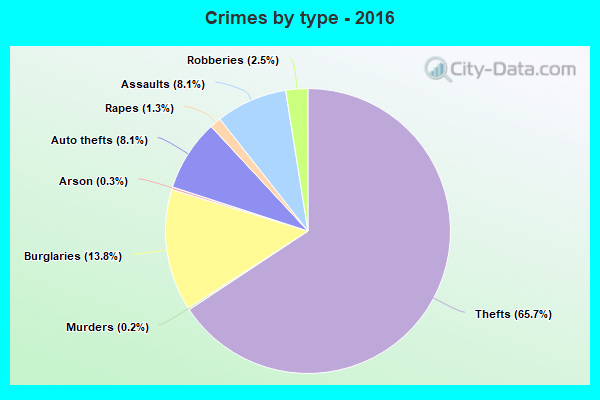
Violent crime rate in 2016
| San Antonio: | 413.4 |
| U.S. Average: | 227.3 |
Violent crime rate in 2015
| San Antonio: | 339.1 |
| U.S. Average: | 219.3 |
Violent crime rate in 2014
| San Antonio: | 318.2 |
| U.S. Average: | 211.1 |
Violent crime rate in 2013
| San Antonio: | 346.7 |
| U.S. Average: | 214.2 |
Violent crime rate in 2012
| San Antonio: | 281.1 |
| U.S. Average: | 187.4 |
Violent crime rate in 2011
| San Antonio: | 287.6 |
| U.S. Average: | 187.1 |
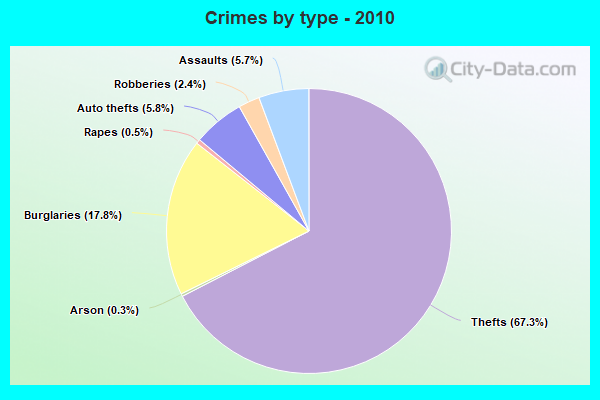
Violent crime rate in 2010
| San Antonio: | 344.2 |
| U.S. Average: | 195.7 |
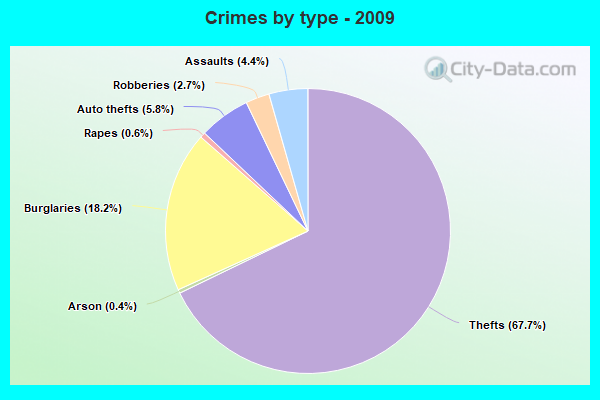
Violent crime rate in 2009
| San Antonio: | 319.1 |
| U.S. Average: | 208.9 |
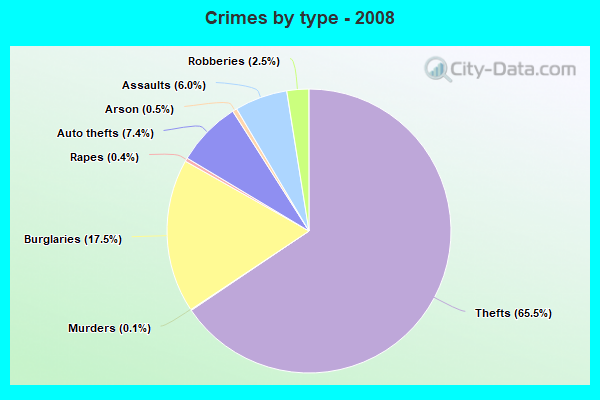
Violent crime rate in 2008
| San Antonio: | 387.5 |
| U.S. Average: | 222.5 |
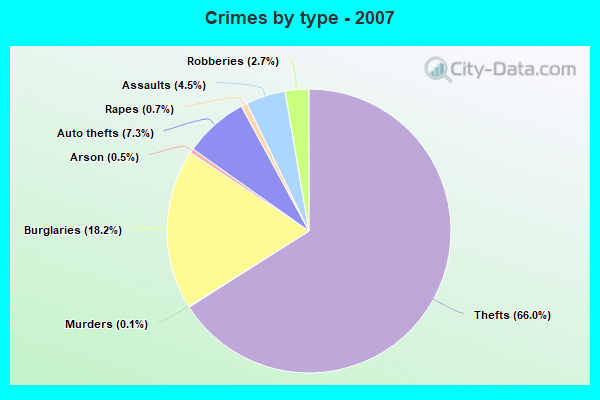
Violent crime rate in 2007
| San Antonio: | 249.3 |
| U.S. Average: | 229.1 |
Violent crime rate in 2006
| San Antonio: | 269.9 |
| U.S. Average: | 232.6 |
Violent crime rate in 2005
| San Antonio: | 277.8 |
| U.S. Average: | 227.0 |
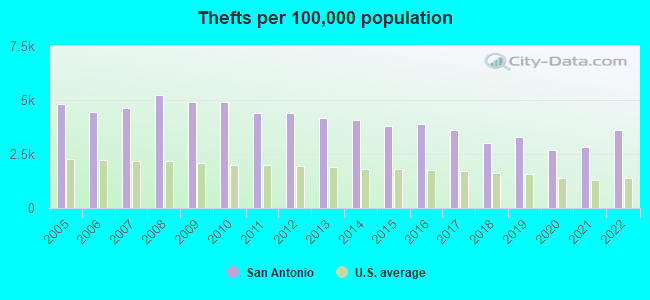
Property crime rate in 2022
| San Antonio: | 433.4 |
| U.S. Average: | 166.5 |
Property crime rate in 2021
| San Antonio: | 319.6 |
| U.S. Average: | 157.8 |
Property crime rate in 2020
| San Antonio: | 302.6 |
| U.S. Average: | 169.6 |
Property crime rate in 2019
| San Antonio: | 344.7 |
| U.S. Average: | 179.7 |
Property crime rate in 2018
| San Antonio: | 328.1 |
| U.S. Average: | 190.2 |
Property crime rate in 2017
| San Antonio: | 403.0 |
| U.S. Average: | 206.4 |
Property crime rate in 2016
| San Antonio: | 430.2 |
| U.S. Average: | 216.6 |
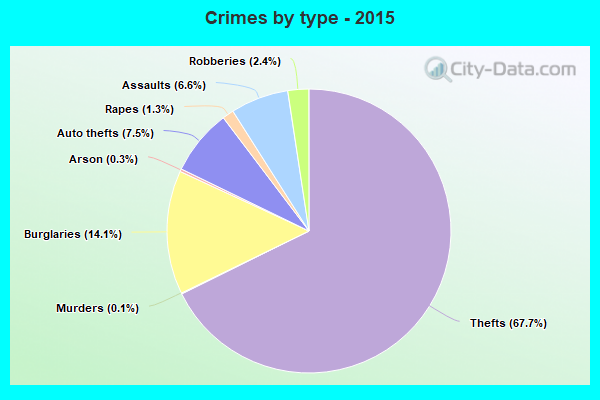
Property crime rate in 2015
| San Antonio: | 412.9 |
| U.S. Average: | 221.5 |
Property crime rate in 2014
| San Antonio: | 450.5 |
| U.S. Average: | 230.8 |
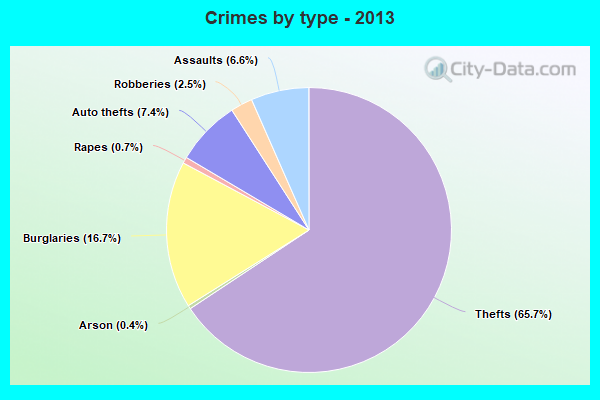
Property crime rate in 2013
| San Antonio: | 491.9 |
| U.S. Average: | 250.4 |
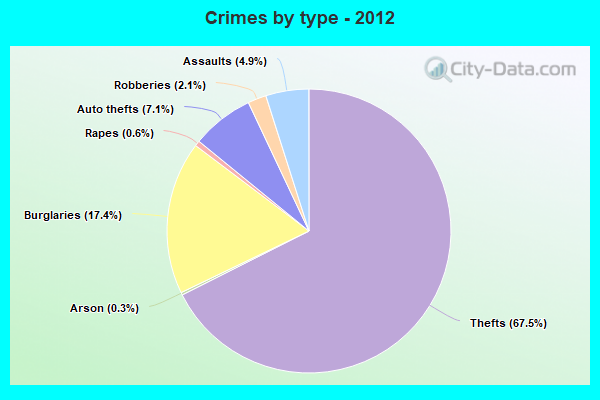
Property crime rate in 2012
| San Antonio: | 515.9 |
| U.S. Average: | 267.3 |
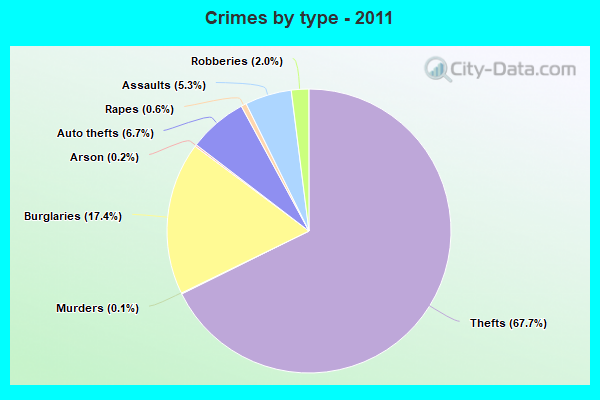
Property crime rate in 2011
| San Antonio: | 511.5 |
| U.S. Average: | 273.5 |
Property crime rate in 2010
| San Antonio: | 570.9 |
| U.S. Average: | 276.4 |
Property crime rate in 2009
| San Antonio: | 574.1 |
| U.S. Average: | 285.6 |
Property crime rate in 2008
| San Antonio: | 630.2 |
| U.S. Average: | 302.2 |
Property crime rate in 2007
| San Antonio: | 442.5 |
| U.S. Average: | 309.2 |
Property crime rate in 2006
| San Antonio: | 414.0 |
| U.S. Average: | 317.3 |
Property crime rate in 2005
| San Antonio: | 426.7 |
| U.S. Average: | 322.3 |


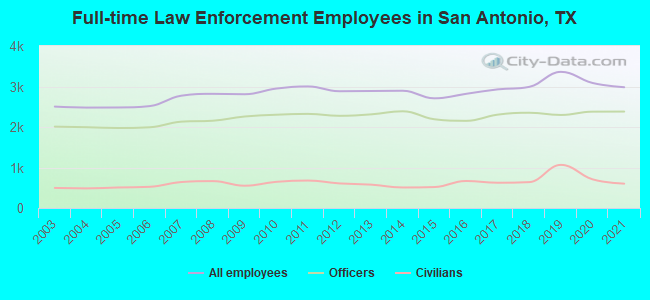
Full-time law enforcement employees in 2021, including police officers: 2,982 (2,381 officers - 2,108 male; 273 female).
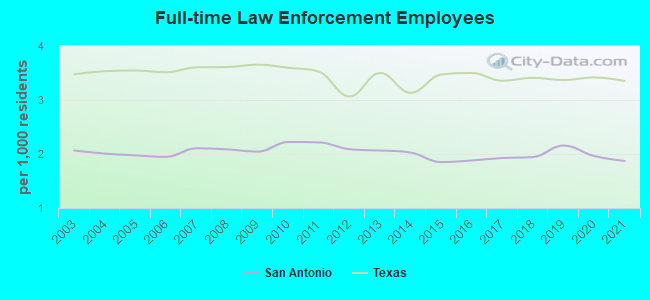
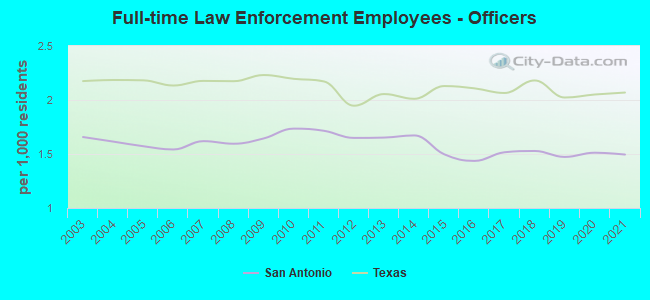
| Officers per 1,000 residents here: | 1.49 |
| Texas average: | 2.07 |
Full-time law enforcement employees in 2020, including police officers: 3,087 (2,379 officers - 2,124 male; 255 female).
| Officers per 1,000 residents here: | 1.51 |
| Texas average: | 2.05 |
Full-time law enforcement employees in 2019, including police officers: 3,362 (2,297 officers - 2,057 male; 240 female).
| Officers per 1,000 residents here: | 1.47 |
| Texas average: | 2.02 |
Full-time law enforcement employees in 2018, including police officers: 2,991 (2,352 officers - 2,108 male; 244 female).
| Officers per 1,000 residents here: | 1.53 |
| Texas average: | 2.18 |
Full-time law enforcement employees in 2017, including police officers: 2,929 (2,305 officers - 2,071 male; 234 female).
| Officers per 1,000 residents here: | 1.52 |
| Texas average: | 2.06 |
Full-time law enforcement employees in 2016, including police officers: 2,819 (2,152 officers - 1,944 male; 208 female).
| Officers per 1,000 residents here: | 1.44 |
| Texas average: | 2.11 |
Full-time law enforcement employees in 2015, including police officers: 2,708 (2,191 officers - 1,983 male; 208 female).
| Officers per 1,000 residents here: | 1.50 |
| Texas average: | 2.13 |
Full-time law enforcement employees in 2014, including police officers: 2,895 (2,388 officers - 2,155 male; 233 female).
| Officers per 1,000 residents here: | 1.67 |
| Texas average: | 2.01 |
Full-time law enforcement employees in 2013, including police officers: 2,889 (2,312 officers - 2,090 male; 222 female).
| Officers per 1,000 residents here: | 1.65 |
| Texas average: | 2.05 |
Full-time law enforcement employees in 2012, including police officers: 2,883 (2,276 officers - 2,060 male; 216 female).
| Officers per 1,000 residents here: | 1.65 |
| Texas average: | 1.95 |
Full-time law enforcement employees in 2011, including police officers: 3,002 (2,324 officers - 2,102 male; 222 female).
| Officers per 1,000 residents here: | 1.71 |
| Texas average: | 2.17 |
Full-time law enforcement employees in 2010, including police officers: 2,949 (2,303 officers - 2,084 male; 219 female).
| Officers per 1,000 residents here: | 1.73 |
| Texas average: | 2.20 |
Full-time law enforcement employees in 2009, including police officers: 2,809 (2,259 officers - 2,057 male; 202 female).
| Officers per 1,000 residents here: | 1.64 |
| Texas average: | 2.23 |
Full-time law enforcement employees in 2008, including police officers: 2,819 (2,155 officers - 1,967 male; 188 female).
| Officers per 1,000 residents here: | 1.59 |
| Texas average: | 2.17 |
Full-time law enforcement employees in 2007, including police officers: 2,773 (2,132 officers - 1,950 male; 182 female).
| Officers per 1,000 residents here: | 1.62 |
| Texas average: | 2.18 |
Full-time law enforcement employees in 2006, including police officers: 2,516 (1,993 officers - 1,843 male; 150 female).
| Officers per 1,000 residents here: | 1.54 |
| Texas average: | 2.13 |
Full-time law enforcement employees in 2005, including police officers: 2,482 (1,975 officers - 1,826 male; 149 female).
| Officers per 1,000 residents here: | 1.57 |
| Texas average: | 2.18 |
Full-time law enforcement employees in 2004, including police officers: 2,479 (1,995 officers - 1,847 male; 148 female).
| Officers per 1,000 residents here: | 1.62 |
| Texas average: | 2.19 |
Full-time law enforcement employees in 2003, including police officers: 2,504 (2,009 officers - 1,865 male; 144 female).
| Officers per 1,000 residents here: | 1.66 |
| Texas average: | 2.17 |


Zip codes: 78056, 78073, 78202, 78203, 78204, 78205, 78207, 78208, 78210, 78211, 78214, 78215, 78217, 78218, 78220, 78221, 78222, 78224, 78225, 78226, 78227, 78229, 78230, 78231, 78234, 78235, 78237, 78242, 78243, 78245, 78247, 78248, 78249, 78250, 78251, 78252, 78253, 78257, 78258, 78259, 78260, 78264.