Crime rate in McKinney, Texas (TX): murders, rapes, robberies, assaults, burglaries, thefts, auto thefts, arson, law enforcement employees, police officers, crime map
Crime rate in McKinney, TX
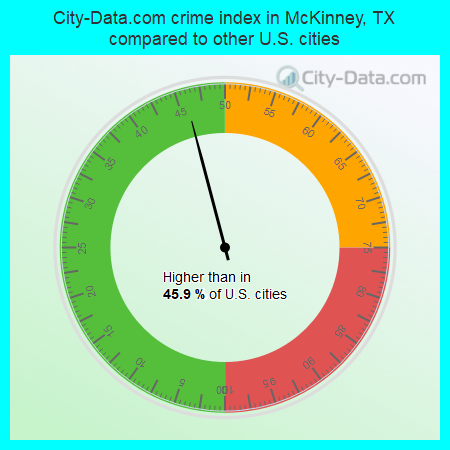
The 2022 crime rate in McKinney, TX is 89 (City-Data.com crime index), which is 2.8 times smaller than the U.S. average. It was higher than in 45.9% U.S. cities. The 2022 McKinney crime rate rose by 2% compared to 2021. The number of homicides stood at 3 - a decrease of 1 compared to 2021. In the last 5 years McKinney has seen decline of violent crime and decreasing property crime.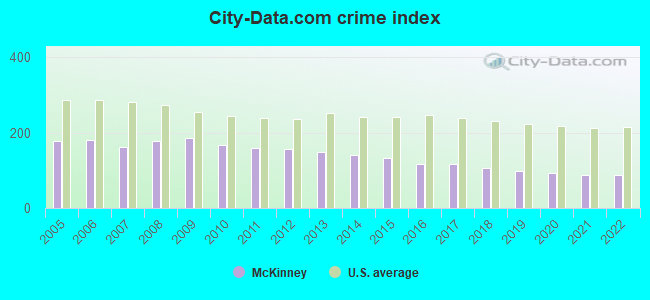
The City-Data.com crime index weighs serious crimes and violent crimes more heavily. Higher means more crime, U.S. average is 246.1. It adjusts for the number of visitors and daily workers commuting into cities.
- means the value is smaller than the state average.- means the value is about the same as the state average.
- means the value is bigger than the state average.
According to our research of Texas and other state lists, there were 85 registered sex offenders living in McKinney, Texas as of June 01, 2024.
The ratio of all residents to sex offenders in McKinney is 1,955 to 1.
The ratio of registered sex offenders to all residents in this city is much lower than the state average.
Violent crime rate in 2022
| McKinney: | 71.0 |
| U.S. Average: | 219.8 |
Violent crime rate in 2021
| McKinney: | 79.4 |
| U.S. Average: | 224.8 |
Violent crime rate in 2020
| McKinney: | 84.5 |
| U.S. Average: | 228.2 |
Violent crime rate in 2019
| McKinney: | 89.0 |
| U.S. Average: | 219.9 |
Violent crime rate in 2018
| McKinney: | 96.3 |
| U.S. Average: | 221.2 |
Violent crime rate in 2017
| McKinney: | 93.9 |
| U.S. Average: | 226.2 |
Violent crime rate in 2016
| McKinney: | 89.9 |
| U.S. Average: | 227.3 |
Violent crime rate in 2015
| McKinney: | 99.8 |
| U.S. Average: | 219.3 |
Violent crime rate in 2014
| McKinney: | 90.0 |
| U.S. Average: | 211.1 |
Violent crime rate in 2013
| McKinney: | 89.2 |
| U.S. Average: | 214.2 |
Violent crime rate in 2012
| McKinney: | 103.2 |
| U.S. Average: | 187.4 |
Violent crime rate in 2011
| McKinney: | 104.9 |
| U.S. Average: | 187.1 |
Violent crime rate in 2010
| McKinney: | 99.1 |
| U.S. Average: | 195.7 |
Violent crime rate in 2009
| McKinney: | 112.0 |
| U.S. Average: | 208.9 |
Violent crime rate in 2008
| McKinney: | 132.2 |
| U.S. Average: | 222.5 |
Violent crime rate in 2007
| McKinney: | 115.5 |
| U.S. Average: | 229.1 |
Violent crime rate in 2006
| McKinney: | 147.7 |
| U.S. Average: | 232.6 |
Violent crime rate in 2005
| McKinney: | 135.5 |
| U.S. Average: | 227.0 |
Property crime rate in 2022
| McKinney: | 75.9 |
| U.S. Average: | 166.5 |
Property crime rate in 2021
| McKinney: | 67.9 |
| U.S. Average: | 157.8 |
Property crime rate in 2020
| McKinney: | 73.1 |
| U.S. Average: | 169.6 |
Property crime rate in 2019
| McKinney: | 77.0 |
| U.S. Average: | 179.7 |
Property crime rate in 2018
| McKinney: | 81.0 |
| U.S. Average: | 190.2 |
Property crime rate in 2017
| McKinney: | 100.9 |
| U.S. Average: | 206.4 |
Property crime rate in 2016
| McKinney: | 101.3 |
| U.S. Average: | 216.6 |
Property crime rate in 2015
| McKinney: | 119.3 |
| U.S. Average: | 221.5 |
Property crime rate in 2014
| McKinney: | 142.2 |
| U.S. Average: | 230.8 |
Property crime rate in 2013
| McKinney: | 161.7 |
| U.S. Average: | 250.4 |
Property crime rate in 2012
| McKinney: | 162.4 |
| U.S. Average: | 267.3 |
Property crime rate in 2011
| McKinney: | 184.4 |
| U.S. Average: | 273.5 |
Property crime rate in 2010
| McKinney: | 203.0 |
| U.S. Average: | 276.4 |
Property crime rate in 2009
| McKinney: | 215.8 |
| U.S. Average: | 285.6 |
Property crime rate in 2008
| McKinney: | 178.6 |
| U.S. Average: | 302.2 |
Property crime rate in 2007
| McKinney: | 170.1 |
| U.S. Average: | 309.2 |
Property crime rate in 2006
| McKinney: | 177.1 |
| U.S. Average: | 317.3 |
Property crime rate in 2005
| McKinney: | 183.3 |
| U.S. Average: | 322.3 |


Full-time law enforcement employees in 2021, including police officers: 295 (225 officers - 197 male; 28 female).
| Officers per 1,000 residents here: | 1.03 |
| Texas average: | 2.07 |
Full-time law enforcement employees in 2020, including police officers: 287 (218 officers - 193 male; 25 female).
| Officers per 1,000 residents here: | 1.05 |
| Texas average: | 2.05 |
Full-time law enforcement employees in 2019, including police officers: 277 (210 officers - 187 male; 23 female).
| Officers per 1,000 residents here: | 1.05 |
| Texas average: | 2.02 |
Full-time law enforcement employees in 2018, including police officers: 273 (212 officers - 185 male; 27 female).
| Officers per 1,000 residents here: | 1.12 |
| Texas average: | 2.18 |
Full-time law enforcement employees in 2017, including police officers: 245 (192 officers - 169 male; 23 female).
| Officers per 1,000 residents here: | 1.07 |
| Texas average: | 2.06 |
Full-time law enforcement employees in 2016, including police officers: 234 (189 officers - 169 male; 20 female).
| Officers per 1,000 residents here: | 1.11 |
| Texas average: | 2.11 |
Full-time law enforcement employees in 2015, including police officers: 222 (176 officers - 155 male; 21 female).
| Officers per 1,000 residents here: | 1.08 |
| Texas average: | 2.13 |
Full-time law enforcement employees in 2014, including police officers: 231 (185 officers - 162 male; 23 female).
| Officers per 1,000 residents here: | 1.21 |
| Texas average: | 2.01 |
Full-time law enforcement employees in 2013, including police officers: 213 (165 officers - 144 male; 21 female).
| Officers per 1,000 residents here: | 1.12 |
| Texas average: | 2.05 |
Full-time law enforcement employees in 2012, including police officers: 203 (157 officers - 138 male; 19 female).
| Officers per 1,000 residents here: | 1.14 |
| Texas average: | 1.95 |
Full-time law enforcement employees in 2011, including police officers: 194 (153 officers - 135 male; 18 female).
| Officers per 1,000 residents here: | 1.14 |
| Texas average: | 2.17 |
Full-time law enforcement employees in 2010, including police officers: 199 (155 officers - 138 male; 17 female).
| Officers per 1,000 residents here: | 1.18 |
| Texas average: | 2.20 |
Full-time law enforcement employees in 2009, including police officers: 202 (159 officers - 140 male; 19 female).
| Officers per 1,000 residents here: | 1.20 |
| Texas average: | 2.23 |
Full-time law enforcement employees in 2008, including police officers: 198 (155 officers - 137 male; 18 female).
| Officers per 1,000 residents here: | 1.22 |
| Texas average: | 2.17 |
Full-time law enforcement employees in 2007, including police officers: 191 (149 officers - 129 male; 20 female).
| Officers per 1,000 residents here: | 1.26 |
| Texas average: | 2.18 |
Full-time law enforcement employees in 2006, including police officers: 161 (129 officers - 111 male; 18 female).
| Officers per 1,000 residents here: | 1.30 |
| Texas average: | 2.13 |
Full-time law enforcement employees in 2005, including police officers: 133 (103 officers - 87 male; 16 female).
| Officers per 1,000 residents here: | 1.15 |
| Texas average: | 2.18 |
Full-time law enforcement employees in 2004, including police officers: 118 (95 officers - 83 male; 12 female).
| Officers per 1,000 residents here: | 1.17 |
| Texas average: | 2.19 |
Full-time law enforcement employees in 2003, including police officers: 117 (94 officers - 83 male; 11 female).
| Officers per 1,000 residents here: | 1.27 |
| Texas average: | 2.17 |


Zip codes: 75070.