Crime rate in Corpus Christi, Texas (TX): murders, rapes, robberies, assaults, burglaries, thefts, auto thefts, arson, law enforcement employees, police officers, crime map
Crime rate in Corpus Christi, TX
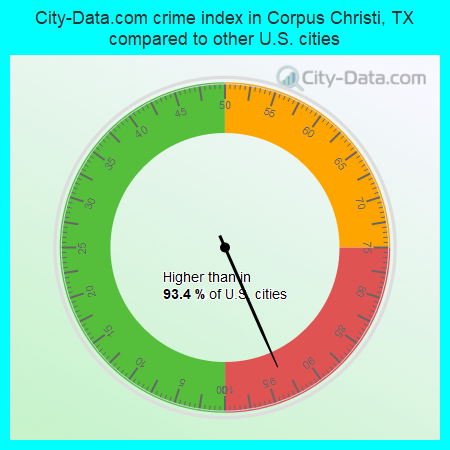
The 2022 crime rate in Corpus Christi, TX is 388 (City-Data.com crime index), which is 1.6 times higher than the U.S. average. It was higher than in 93.4% U.S. cities. The 2022 Corpus Christi crime rate fell by 3% compared to 2021. The number of homicides stood at 41 - an increase of 22 compared to 2021. In the last 5 years Corpus Christi has seen increasing violent crime and decline of property crime.See how dangerous Corpus Christi, TX is compared to the nearest cities:
(Note: Higher means more crime)
(Note: Higher means more crime)
| Corpus Christi: | 388.4 |
| Portland: | 106.7 |
| Gregory: | 77.4 |
| Ingleside: | 226.5 |
| Taft: | 67.7 |
| Robstown: | 307.8 |
| Odem: | 122.1 |
| Aransas Pass: | 389.2 |
| Port Aransas: | 497.3 |
The City-Data.com crime index weighs serious crimes and violent crimes more heavily. Higher means more crime, U.S. average is 246.1. It adjusts for the number of visitors and daily workers commuting into cities.
- means the value is smaller than the state average.- means the value is about the same as the state average.
- means the value is bigger than the state average.
- means the value is much bigger than the state average.
According to our research of Texas and other state lists, there were 1,069 registered sex offenders living in Corpus Christi, Texas as of June 01, 2024.
The ratio of all residents to sex offenders in Corpus Christi is 305 to 1.

Violent crime rate in 2022
| Corpus Christi: | 452.5 |
| U.S. Average: | 219.8 |
Violent crime rate in 2021
| Corpus Christi: | 477.5 |
| U.S. Average: | 224.8 |
Violent crime rate in 2020
| Corpus Christi: | 480.5 |
| U.S. Average: | 228.2 |
Violent crime rate in 2019
| Corpus Christi: | 460.8 |
| U.S. Average: | 219.9 |
Violent crime rate in 2018
| Corpus Christi: | 434.4 |
| U.S. Average: | 221.2 |
Violent crime rate in 2017
| Corpus Christi: | 396.0 |
| U.S. Average: | 226.2 |
Violent crime rate in 2016
| Corpus Christi: | 405.4 |
| U.S. Average: | 227.3 |
Violent crime rate in 2015
| Corpus Christi: | 373.9 |
| U.S. Average: | 219.3 |
Violent crime rate in 2014
| Corpus Christi: | 384.5 |
| U.S. Average: | 211.1 |
Violent crime rate in 2013
| Corpus Christi: | 340.2 |
| U.S. Average: | 214.2 |
Violent crime rate in 2012
| Corpus Christi: | 366.2 |
| U.S. Average: | 187.4 |
Violent crime rate in 2011
| Corpus Christi: | 355.7 |
| U.S. Average: | 187.1 |
Violent crime rate in 2010
| Corpus Christi: | 377.9 |
| U.S. Average: | 195.7 |
Violent crime rate in 2009
| Corpus Christi: | 454.4 |
| U.S. Average: | 208.9 |
Violent crime rate in 2008
| Corpus Christi: | 431.8 |
| U.S. Average: | 222.5 |
Violent crime rate in 2007
| Corpus Christi: | 371.3 |
| U.S. Average: | 229.1 |
Violent crime rate in 2006
| Corpus Christi: | 316.0 |
| U.S. Average: | 232.6 |
Violent crime rate in 2005
| Corpus Christi: | 320.7 |
| U.S. Average: | 227.0 |
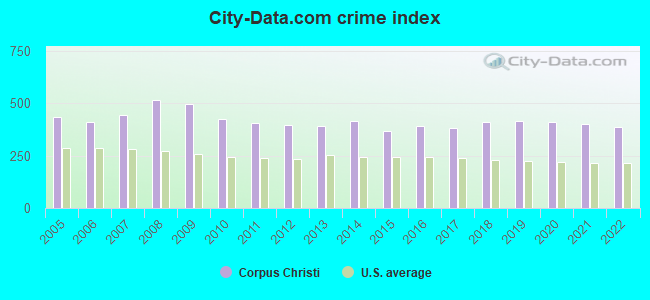
Property crime rate in 2022
| Corpus Christi: | 257.8 |
| U.S. Average: | 166.5 |
Property crime rate in 2021
| Corpus Christi: | 270.0 |
| U.S. Average: | 157.8 |
Property crime rate in 2020
| Corpus Christi: | 284.9 |
| U.S. Average: | 169.6 |
Property crime rate in 2019
| Corpus Christi: | 289.9 |
| U.S. Average: | 179.7 |
Property crime rate in 2018
| Corpus Christi: | 308.0 |
| U.S. Average: | 190.2 |
Property crime rate in 2017
| Corpus Christi: | 302.2 |
| U.S. Average: | 206.4 |
Property crime rate in 2016
| Corpus Christi: | 311.0 |
| U.S. Average: | 216.6 |
Property crime rate in 2015
| Corpus Christi: | 290.3 |
| U.S. Average: | 221.5 |
Property crime rate in 2014
| Corpus Christi: | 347.4 |
| U.S. Average: | 230.8 |
Property crime rate in 2013
| Corpus Christi: | 371.4 |
| U.S. Average: | 250.4 |
Property crime rate in 2012
| Corpus Christi: | 356.8 |
| U.S. Average: | 267.3 |
Property crime rate in 2011
| Corpus Christi: | 382.4 |
| U.S. Average: | 273.5 |
Property crime rate in 2010
| Corpus Christi: | 391.1 |
| U.S. Average: | 276.4 |
Property crime rate in 2009
| Corpus Christi: | 456.3 |
| U.S. Average: | 285.6 |
Property crime rate in 2008
| Corpus Christi: | 513.2 |
| U.S. Average: | 302.2 |
Property crime rate in 2007
| Corpus Christi: | 427.8 |
| U.S. Average: | 309.2 |
Property crime rate in 2006
| Corpus Christi: | 410.7 |
| U.S. Average: | 317.3 |
Property crime rate in 2005
| Corpus Christi: | 448.6 |
| U.S. Average: | 322.3 |


Full-time law enforcement employees in 2021, including police officers: 594 (425 officers - 351 male; 74 female).
| Officers per 1,000 residents here: | 1.29 |
| Texas average: | 2.07 |
Full-time law enforcement employees in 2020, including police officers: 626 (425 officers - 358 male; 67 female).
| Officers per 1,000 residents here: | 1.29 |
| Texas average: | 2.05 |
Full-time law enforcement employees in 2019, including police officers: 660 (426 officers - 359 male; 67 female).
| Officers per 1,000 residents here: | 1.29 |
| Texas average: | 2.02 |
Full-time law enforcement employees in 2018, including police officers: 652 (443 officers - 378 male; 65 female).
| Officers per 1,000 residents here: | 1.35 |
| Texas average: | 2.18 |
Full-time law enforcement employees in 2017, including police officers: 604 (436 officers - 375 male; 61 female).
| Officers per 1,000 residents here: | 1.32 |
| Texas average: | 2.06 |
Full-time law enforcement employees in 2016, including police officers: 625 (444 officers - 381 male; 63 female).
| Officers per 1,000 residents here: | 1.35 |
| Texas average: | 2.11 |
Full-time law enforcement employees in 2015, including police officers: 649 (445 officers - 383 male; 62 female).
| Officers per 1,000 residents here: | 1.37 |
| Texas average: | 2.13 |
Full-time law enforcement employees in 2014, including police officers: 602 (427 officers - 377 male; 50 female).
| Officers per 1,000 residents here: | 1.34 |
| Texas average: | 2.01 |
Full-time law enforcement employees in 2013, including police officers: 667 (449 officers - 392 male; 57 female).
| Officers per 1,000 residents here: | 1.43 |
| Texas average: | 2.05 |
Full-time law enforcement employees in 2012, including police officers: 619 (432 officers - 395 male; 37 female).
| Officers per 1,000 residents here: | 1.38 |
| Texas average: | 1.95 |
Full-time law enforcement employees in 2011, including police officers: 624 (428 officers - 392 male; 36 female).
| Officers per 1,000 residents here: | 1.37 |
| Texas average: | 2.17 |
Full-time law enforcement employees in 2010, including police officers: 657 (445 officers - 415 male; 30 female).
| Officers per 1,000 residents here: | 1.46 |
| Texas average: | 2.20 |
Full-time law enforcement employees in 2009, including police officers: 646 (446 officers - 416 male; 30 female).
| Officers per 1,000 residents here: | 1.55 |
| Texas average: | 2.23 |
Full-time law enforcement employees in 2008, including police officers: 627 (448 officers - 410 male; 38 female).
| Officers per 1,000 residents here: | 1.56 |
| Texas average: | 2.17 |
Full-time law enforcement employees in 2006, including police officers: 636 (439 officers - 403 male; 36 female).
| Officers per 1,000 residents here: | 1.51 |
| Texas average: | 2.13 |
Full-time law enforcement employees in 2005, including police officers: 579 (409 officers - 376 male; 33 female).
| Officers per 1,000 residents here: | 1.43 |
| Texas average: | 2.18 |
Full-time law enforcement employees in 2004, including police officers: 594 (421 officers - 386 male; 35 female).
| Officers per 1,000 residents here: | 1.48 |
| Texas average: | 2.19 |
Full-time law enforcement employees in 2003, including police officers: 615 (444 officers - 410 male; 34 female).
| Officers per 1,000 residents here: | 1.57 |
| Texas average: | 2.17 |


Zip codes: 78370, 78373, 78374, 78401, 78402, 78404, 78405, 78406, 78407, 78408, 78409, 78410, 78411, 78412, 78413, 78414, 78415, 78416, 78417, 78418, 78419.