Crime rate in Columbia, South Carolina (SC): murders, rapes, robberies, assaults, burglaries, thefts, auto thefts, arson, law enforcement employees, police officers, crime map
Crime rate in Columbia, SC
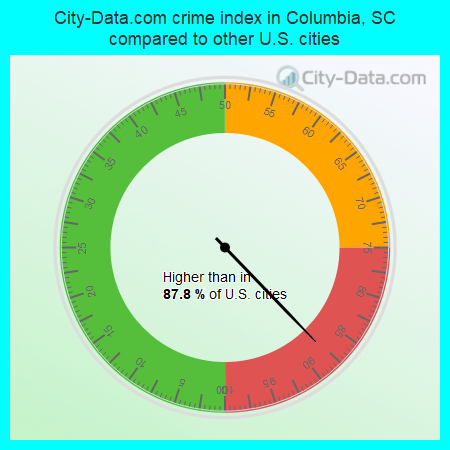
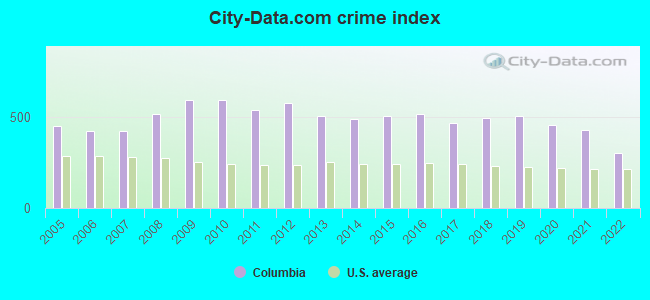
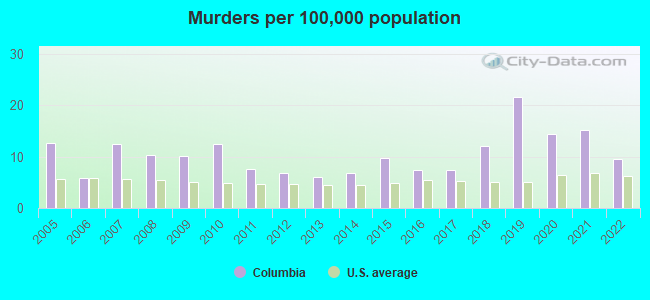
The 2022 crime rate in Columbia, SC is 301 (City-Data.com crime index), which is 1.2 times greater than the U.S. average. It was higher than in 87.8% U.S. cities. The 2022 Columbia crime rate fell by 30% compared to 2021. The number of homicides stood at 13 - a decrease of 7 compared to 2021. In the last 5 years Columbia has seen decline of violent crime and decreasing property crime.See how dangerous Columbia, SC is compared to the nearest cities:
(Note: Higher means more crime)
(Note: Higher means more crime)
| Columbia: | 301.0 |
| Forest Acres: | 283.1 |
| West Columbia: | 449.9 |
| Cayce: | 460.2 |
| Springdale: | 423.8 |
| Pine Ridge: | 50.3 |
| South Congaree: | 398.2 |
| Irmo: | 298.3 |
| Lexington: | 159.3 |
The City-Data.com crime index weighs serious crimes and violent crimes more heavily. Higher means more crime, U.S. average is 246.1. It adjusts for the number of visitors and daily workers commuting into cities.
- means the value is smaller than the state average.- means the value is about the same as the state average.
- means the value is bigger than the state average.
- means the value is much bigger than the state average.
According to our research of South Carolina and other state lists, there were 815 registered sex offenders living in Columbia, South Carolina as of June 08, 2024.
The ratio of all residents to sex offenders in Columbia is 164 to 1.
Violent crime rate in 2022
| Columbia: | 329.9 |
| U.S. Average: | 219.8 |
Violent crime rate in 2021
| Columbia: | 419.3 |
| U.S. Average: | 224.8 |
Violent crime rate in 2020
| Columbia: | 437.9 |
| U.S. Average: | 228.2 |
Violent crime rate in 2019
| Columbia: | 453.7 |
| U.S. Average: | 219.9 |
Violent crime rate in 2018
| Columbia: | 449.7 |
| U.S. Average: | 221.2 |
Violent crime rate in 2017
| Columbia: | 402.7 |
| U.S. Average: | 226.2 |
Violent crime rate in 2016
| Columbia: | 463.6 |
| U.S. Average: | 227.3 |
Violent crime rate in 2015
| Columbia: | 444.2 |
| U.S. Average: | 219.3 |
Violent crime rate in 2014
| Columbia: | 426.1 |
| U.S. Average: | 211.1 |
Violent crime rate in 2013
| Columbia: | 394.0 |
| U.S. Average: | 214.2 |
Violent crime rate in 2012
| Columbia: | 511.6 |
| U.S. Average: | 187.4 |
Violent crime rate in 2011
| Columbia: | 454.6 |
| U.S. Average: | 187.1 |
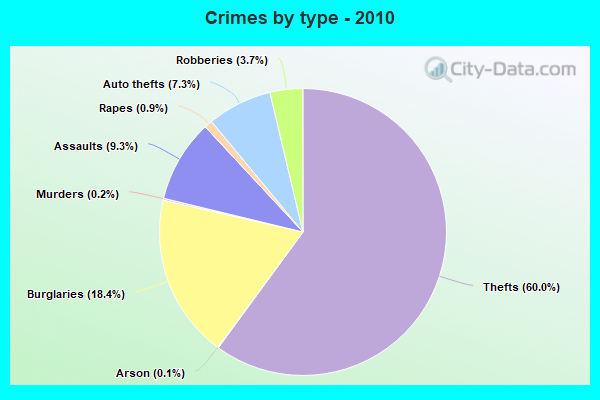
Violent crime rate in 2010
| Columbia: | 554.6 |
| U.S. Average: | 195.7 |
Violent crime rate in 2009
| Columbia: | 565.4 |
| U.S. Average: | 208.9 |
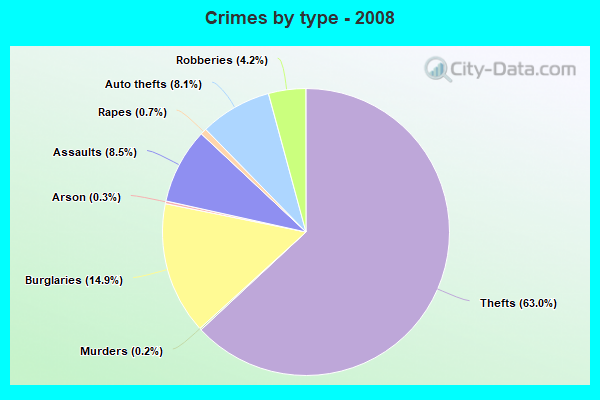
Violent crime rate in 2008
| Columbia: | 473.4 |
| U.S. Average: | 222.5 |
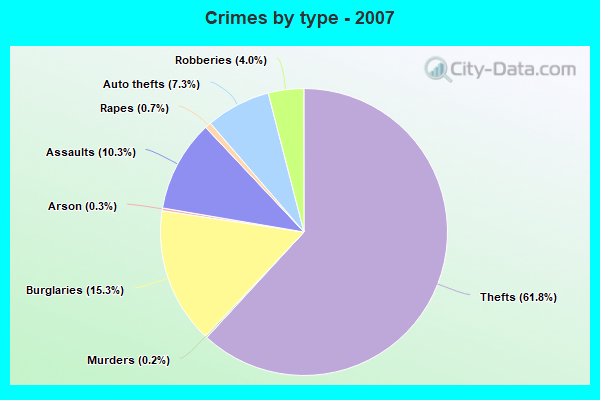
Violent crime rate in 2007
| Columbia: | 421.5 |
| U.S. Average: | 229.1 |
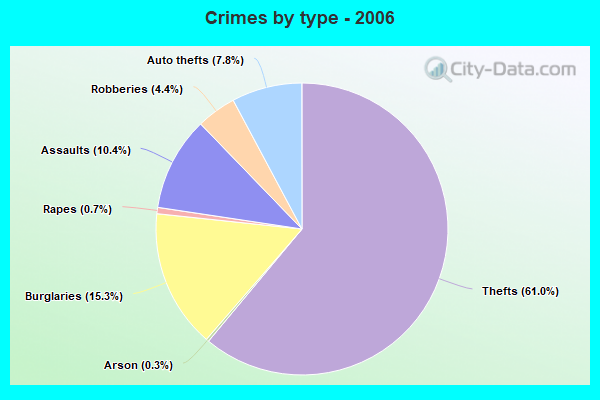
Violent crime rate in 2006
| Columbia: | 425.8 |
| U.S. Average: | 232.6 |
Violent crime rate in 2005
| Columbia: | 429.7 |
| U.S. Average: | 227.0 |
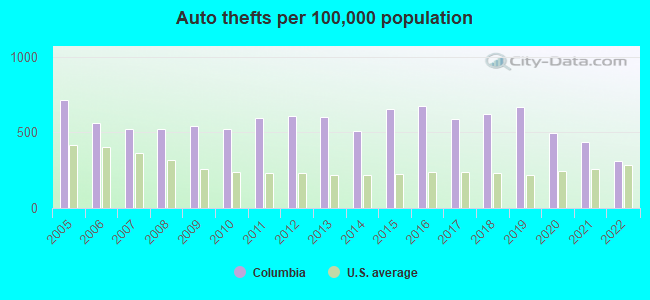
Property crime rate in 2022
| Columbia: | 227.7 |
| U.S. Average: | 166.5 |
Property crime rate in 2021
| Columbia: | 337.2 |
| U.S. Average: | 157.8 |
Property crime rate in 2020
| Columbia: | 365.0 |
| U.S. Average: | 169.6 |
Property crime rate in 2019
| Columbia: | 432.5 |
| U.S. Average: | 179.7 |
Property crime rate in 2018
| Columbia: | 439.0 |
| U.S. Average: | 190.2 |
Property crime rate in 2017
| Columbia: | 429.0 |
| U.S. Average: | 206.4 |
Property crime rate in 2016
| Columbia: | 466.2 |
| U.S. Average: | 216.6 |
Property crime rate in 2015
| Columbia: | 466.7 |
| U.S. Average: | 221.5 |
Property crime rate in 2014
| Columbia: | 445.3 |
| U.S. Average: | 230.8 |
Property crime rate in 2013
| Columbia: | 521.1 |
| U.S. Average: | 250.4 |
Property crime rate in 2012
| Columbia: | 588.2 |
| U.S. Average: | 267.3 |
Property crime rate in 2011
| Columbia: | 549.3 |
| U.S. Average: | 273.5 |
Property crime rate in 2010
| Columbia: | 556.3 |
| U.S. Average: | 276.4 |
Property crime rate in 2009
| Columbia: | 554.9 |
| U.S. Average: | 285.6 |
Property crime rate in 2008
| Columbia: | 468.6 |
| U.S. Average: | 302.2 |
Property crime rate in 2007
| Columbia: | 371.1 |
| U.S. Average: | 309.2 |
Property crime rate in 2006
| Columbia: | 376.1 |
| U.S. Average: | 317.3 |
Property crime rate in 2005
| Columbia: | 406.4 |
| U.S. Average: | 322.3 |
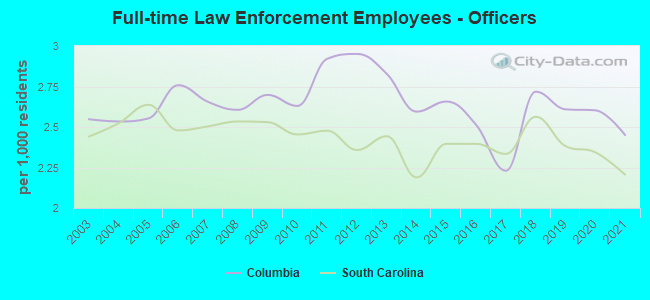
Full-time law enforcement employees in 2021, including police officers: 421 (324 officers - 254 male; 70 female).
| Officers per 1,000 residents here: | 2.45 |
| South Carolina average: | 2.21 |
Full-time law enforcement employees in 2020, including police officers: 431 (343 officers - 275 male; 68 female).
| Officers per 1,000 residents here: | 2.60 |
| South Carolina average: | 2.34 |
Full-time law enforcement employees in 2019, including police officers: 442 (349 officers - 292 male; 57 female).
| Officers per 1,000 residents here: | 2.61 |
| South Carolina average: | 2.38 |
Full-time law enforcement employees in 2018, including police officers: 454 (363 officers - 301 male; 62 female).
| Officers per 1,000 residents here: | 2.72 |
| South Carolina average: | 2.56 |
Full-time law enforcement employees in 2017, including police officers: 386 (301 officers - 247 male; 54 female).
| Officers per 1,000 residents here: | 2.23 |
| South Carolina average: | 2.33 |
Full-time law enforcement employees in 2016, including police officers: 424 (338 officers - 280 male; 58 female).
| Officers per 1,000 residents here: | 2.51 |
| South Carolina average: | 2.40 |
Full-time law enforcement employees in 2015, including police officers: 434 (352 officers - 296 male; 56 female).
| Officers per 1,000 residents here: | 2.66 |
| South Carolina average: | 2.40 |
Full-time law enforcement employees in 2014, including police officers: 435 (348 officers - 297 male; 51 female).
| Officers per 1,000 residents here: | 2.59 |
| South Carolina average: | 2.19 |
Full-time law enforcement employees in 2013, including police officers: 443 (374 officers - 318 male; 56 female).
| Officers per 1,000 residents here: | 2.83 |
| South Carolina average: | 2.44 |
Full-time law enforcement employees in 2012, including police officers: 450 (389 officers - 330 male; 59 female).
| Officers per 1,000 residents here: | 2.95 |
| South Carolina average: | 2.36 |
Full-time law enforcement employees in 2011, including police officers: 444 (382 officers - 325 male; 57 female).
| Officers per 1,000 residents here: | 2.92 |
| South Carolina average: | 2.48 |
Full-time law enforcement employees in 2010, including police officers: 402 (340 officers - 286 male; 54 female).
| Officers per 1,000 residents here: | 2.63 |
| South Carolina average: | 2.45 |
Full-time law enforcement employees in 2009, including police officers: 383 (345 officers - 283 male; 62 female).
| Officers per 1,000 residents here: | 2.70 |
| South Carolina average: | 2.53 |
Full-time law enforcement employees in 2008, including police officers: 364 (327 officers - 265 male; 62 female).
| Officers per 1,000 residents here: | 2.61 |
| South Carolina average: | 2.53 |
Full-time law enforcement employees in 2007, including police officers: 360 (320 officers - 262 male; 58 female).
| Officers per 1,000 residents here: | 2.65 |
| South Carolina average: | 2.50 |
Full-time law enforcement employees in 2006, including police officers: 368 (328 officers - 270 male; 58 female).
| Officers per 1,000 residents here: | 2.76 |
| South Carolina average: | 2.48 |
Full-time law enforcement employees in 2005, including police officers: 339 (301 officers - 248 male; 53 female).
| Officers per 1,000 residents here: | 2.55 |
| South Carolina average: | 2.64 |
Full-time law enforcement employees in 2004, including police officers: 381 (301 officers - 249 male; 52 female).
| Officers per 1,000 residents here: | 2.53 |
| South Carolina average: | 2.52 |
Full-time law enforcement employees in 2003, including police officers: 377 (302 officers - 249 male; 53 female).
| Officers per 1,000 residents here: | 2.55 |
| South Carolina average: | 2.44 |


Zip codes: 29044, 29045, 29061, 29063, 29147, 29202, 29203, 29204, 29205, 29207, 29208, 29210, 29212, 29225, 29229.