Tehama County, California (CA)
County owner-occupied free and clear houses and condos in 2010: 5,312
County owner-occupied houses and condos in 2000: 14,222
Renter-occupied apartments: 8,404 (it was 6,791 in 2000)
| % of renters here: | 32% |
| State: | 44% |
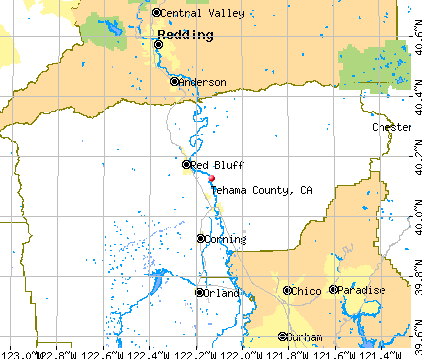
Land area: 2951 sq. mi.
Water area: 11.3 sq. mi.
Population density: 22 people per square mile (low).
Industries providing employment: Educational, health and social services (22.8%), Retail trade (11.5%).
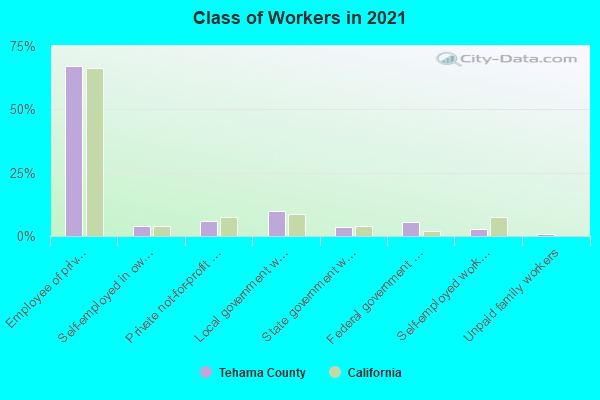
Type of workers:
- Private wage or salary: 69%
- Government: 23%
- Self-employed, not incorporated: 8%
- Unpaid family work: 1%
- OSM Map
- General Map
- Google Map
- MSN Map

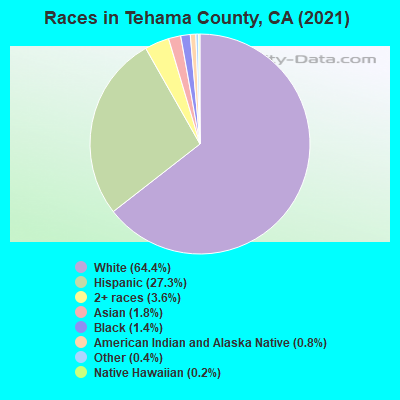
- 39,94061.2%White Non-Hispanic Alone
- 18,52928.4%Hispanic or Latino
- 4,8007.4%Two or more races
- 1,1421.8%American Indian and Alaska Native alone
- 4670.7%Some other race alone
- 2680.4%Asian alone
- 990.2%Black Non-Hispanic Alone
| Median resident age: | 40.9 years |
| California median age: | 37.9 years |
| Males: 32,586 | |
| Females: 32,659 |


| Tehama County: | 2.0 people |
| California: | 3 people |
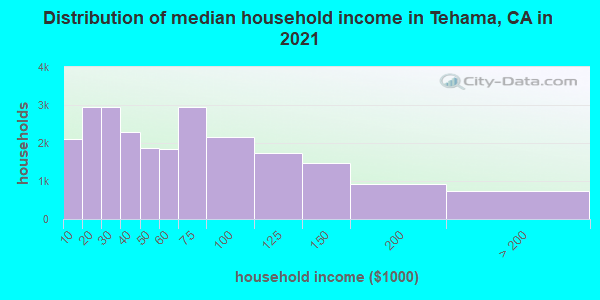
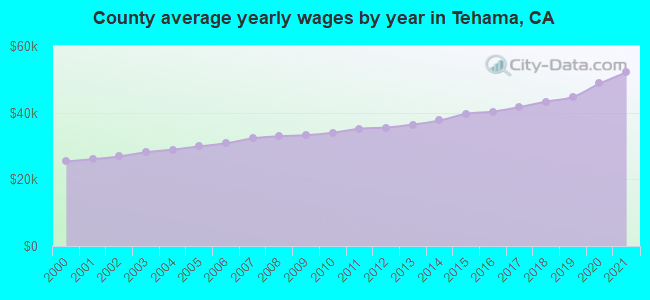
Estimated median household income in 2022: $58,884 ($31,206 in 1999)
| This county: | $58,884 |
| California: | $91,551 |
Median contract rent in 2022 for apartments: $839 (lower quartile is $648, upper quartile is $1,114)
| This county: | $839 |
| State: | $1719 |
Estimated median house or condo value in 2022: $342,100 (it was $97,000 in 2000)
| Tehama: | $342,100 |
| California: | $715,900 |
Mean price in 2022:
Median monthly housing costs for homes and condos with a mortgage: $1,644Detached houses: $378,867
Here: $378,867 State: $988,808 Townhouses or other attached units: $281,544
Here: $281,544 State: $838,546 In 5-or-more-unit structures: $207,517
Here: $207,517 State: $730,996 Mobile homes: $211,680
Here: $211,680 State: $184,506 Occupied boats, RVs, vans, etc.: $84,243
Here: $84,243 State: $204,957
Median monthly housing costs for units without a mortgage: $559
Institutionalized population: 505
Crime in 2020 (reported by the sheriff's office or county police, not the county total):
- Murders: 5
- Rapes: 14
- Robberies: 12
- Assaults: 130
- Burglaries: 131
- Thefts: 238
- Auto thefts: 15
Crime in 2019 (reported by the sheriff's office or county police, not the county total):
- Murders: 2
- Rapes: 14
- Robberies: 12
- Assaults: 67
- Burglaries: 179
- Thefts: 278
- Auto thefts: 15
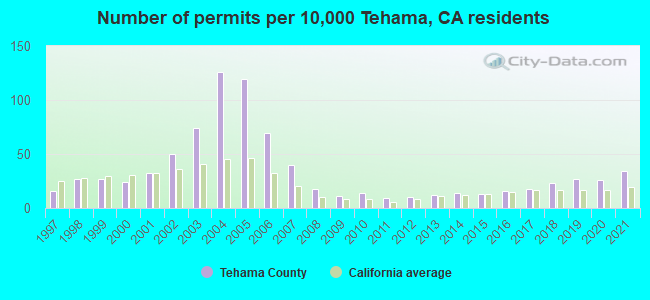
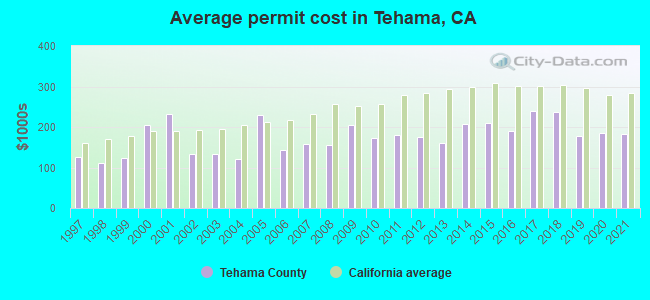
Single-family new house construction building permits:
- 2022: 183 buildings, average cost: $184,200
- 2021: 190 buildings, average cost: $182,400
- 2020: 147 buildings, average cost: $185,900
- 2019: 152 buildings, average cost: $178,900
- 2018: 128 buildings, average cost: $236,800
- 2017: 101 buildings, average cost: $238,800
- 2016: 92 buildings, average cost: $190,200
- 2015: 73 buildings, average cost: $210,800
- 2014: 76 buildings, average cost: $207,700
- 2013: 70 buildings, average cost: $159,700
- 2012: 58 buildings, average cost: $175,600
- 2011: 48 buildings, average cost: $180,700
- 2010: 77 buildings, average cost: $173,500
- 2009: 62 buildings, average cost: $204,200
- 2008: 102 buildings, average cost: $156,300
- 2007: 225 buildings, average cost: $156,700
- 2006: 385 buildings, average cost: $142,400
- 2005: 667 buildings, average cost: $229,100
- 2004: 706 buildings, average cost: $120,600
- 2003: 417 buildings, average cost: $134,400
- 2002: 282 buildings, average cost: $133,400
- 2001: 180 buildings, average cost: $231,900
- 2000: 135 buildings, average cost: $203,700
- 1999: 154 buildings, average cost: $122,800
- 1998: 154 buildings, average cost: $110,600
- 1997: 92 buildings, average cost: $127,000
Median real estate property taxes paid for housing units with mortgages in 2022: $2,119 (0.5%)
Median real estate property taxes paid for housing units with no mortgage in 2022: $1,274 (0.4%)


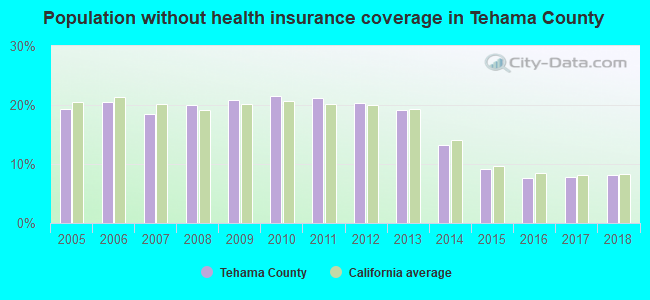
| Tehama County: | 14.5% |
| California: | 12.2% |
Median age of residents in 2022: 40.9 years old
(Males: 40.0 years old, Females: 43.2 years old)
(Median age for: White residents: 48.8 years old, American Indian residents: 33.8 years old, Asian residents: 53.1 years old, Hispanic or Latino residents: 24.8 years old, Other race residents: 37.2 years old)
Fair market rent in 2006 for a 1-bedroom apartment in Tehama County is $463 a month.
Fair market rent for a 2-bedroom apartment is $604 a month.
Fair market rent for a 3-bedroom apartment is $878 a month.
Cities in this county include: Red Bluff, Corning, West Tehama, East Tehama, Lake California, Los Molinos, Rancho Tehama Reserve, Gerber-Las Flores, Gerber, Bend.
| Zip code | City | Number of tests | Number of tests >= 4 pCi/L |
|---|---|---|---|
| 96021 | Corning | 6 | 0 |
| 96055 | Los Molinos | 2 | 0 |
| 96059 | Manton | 1 | 0 |
| 96063 | Mineral | 1 | 0 |
| 96080 | Red Bluff | 19 | 1 |
| 96090 | Tehama | 1 | 0 |
2023 air pollution in Tehama County:
Ozone (1-hour): 0.030 ppm (standard limit: 0.12 ppm). Near U.S. average.
Particulate Matter (PM2.5) Annual: 4.6 µg/m3(standard limit: 15.0 µg/m3). Below U.S. average.
Notable locations in this county outside city limits:
Notable locations in Tehama County: Bradys Camp (A), Browns Cabin (B), Spanish Creek (C), Spring Creek Campground (D), Upper Jamison Campground (E), Feather River Inn Golf Course (F), Gasner Park Picnic Area (G), White Horse Administration Site (H), The A-Tree (I), BSA Camp Timberwolf (J), Sandy Point Campground (K), Mill Creek Campground (L), Hutchins Group Campground (M), Sundew Campground (N), Three Lakes Trailhead (O), Three Lakes Campground (P), Silver Lake Campground (Q), Feather River Rod and Gun Club (R), Warner Valley Campground (S), Stover Camp (T). Display/hide their locations on the map
Church in Tehama County: Indian Mission (A). Display/hide its location on the map
Cemeteries: Plumas County Cemetery (1), Big Flat Cemetery (2), Indian Cemetery (3), Shim Flat Cemetery (4), Westside Cemetery (5). Display/hide their locations on the map
Lakes, reservoirs, and swamps: Green Island Lake (A), Grassy Lakes (B), The Beaver Ponds (C), Grass Lake (D), Gold Lake (E), Fowler Lake (F), Wades Lake (G), Big Bear Lake (H). Display/hide their locations on the map
Streams, rivers, and creeks: Bunchgrass Creek (A), China Creek (B), Clearwater Creek (C), Cooks Creek (D), Coyote Creek (E), Dillon Creek (F), Domingo Creek (G), Fant Creek (H), Foreman Creek (I). Display/hide their locations on the map
Parks in Tehama County include: State Game Refuge One-P (1), State Game Refuge One-V (2), Mount Hough State Game Refuge (3), Gansner Park (4), Lake Basin Recreation Area (5), Little Last Chance Canyon Scenic Area (6). Display/hide their locations on the map
Beach: Catfish Beach (A). Display/hide its location on the map
Neighboring counties: Adams County, Colorado  , Coshocton County, Ohio , Marion County, West Virginia , Shasta County
  , Menard County, Illinois , Sarpy County, Nebraska .
| Here: | 6.4% |
| California: | 5.1% |
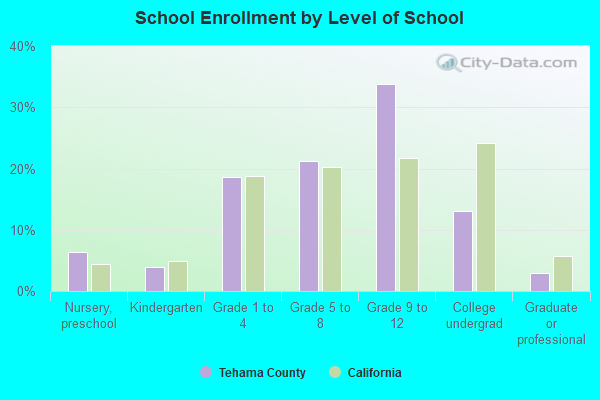
Current college students: 2,501
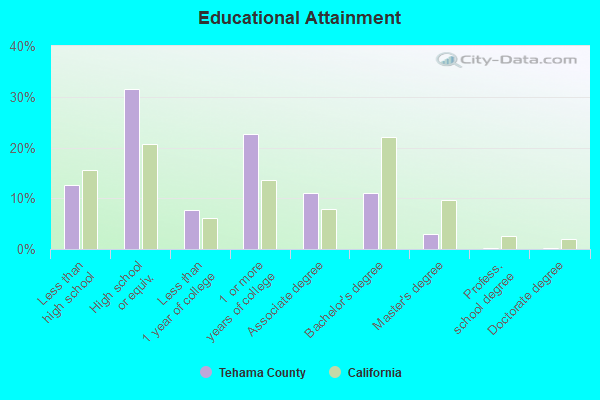
People 25 years of age or older with a high school degree or higher: 86.8%
People 25 years of age or older with a bachelor's degree or higher: 16.7%
Number of foreign born residents: 7,442 (31.4% naturalized citizens)
| Tehama County: | 11.4% |
| Whole state: | 26.7% |
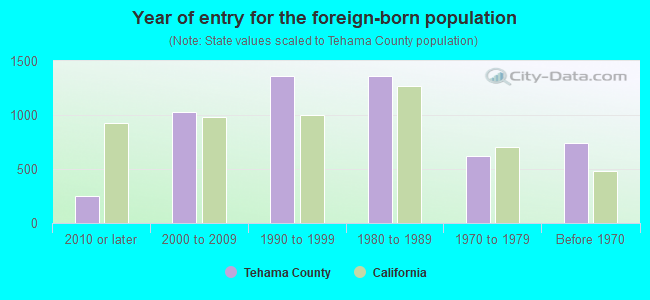
- Year of entry for the foreign-born population
- 1,2152010 or later
- 1,3202000 to 2009
- 1,5891990 to 1999
- 1,3611980 to 1989
- 6201970 to 1979
- 740Before 1970
Mean travel time to work (commute): minutes
Percentage of county residents living and working in this county: 99.0%
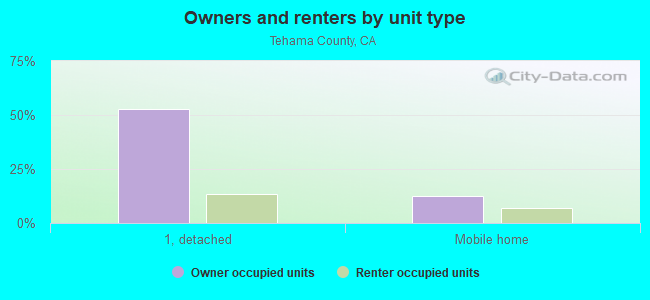
Housing units in structures:
- One, detached: 19,960
- One, attached: 293
- Two: 62
- 3 or 4: 1,180
- 5 to 9: 624
- 10 to 19: 855
- 50 or more: 178
- Mobile homes: 4,255
- Boats, RVs, vans, etc.: 259
Housing units in Tehama County with a mortgage: 9,793 (564 second mortgage, 0 home equity loan, 278 both second mortgage and home equity loan)
Houses without a mortgage: 88
| Here: | 9.3% with mortgage |
| State: | 98.6% with mortgage |
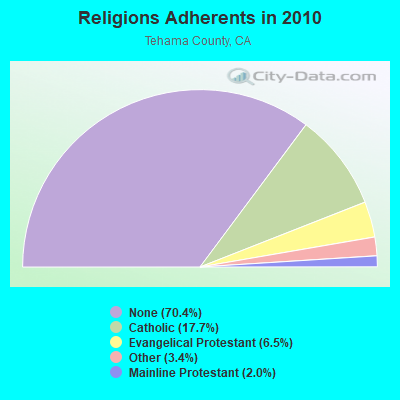
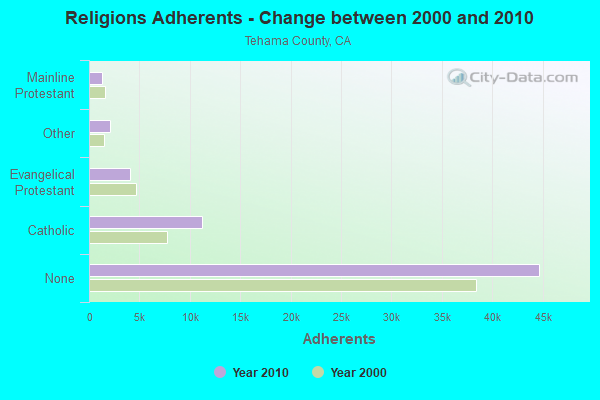
Religion statistics for Tehama County
| Religion | Adherents | Congregations |
|---|---|---|
| Catholic | 11,243 | 3 |
| Evangelical Protestant | 4,100 | 39 |
| Other | 2,130 | 6 |
| Mainline Protestant | 1,280 | 11 |
| Orthodox | 20 | 1 |
| None | 44,690 | - |
Source: Clifford Grammich, Kirk Hadaway, Richard Houseal, Dale E.Jones, Alexei Krindatch, Richie Stanley and Richard H.Taylor. 2012. 2010 U.S.Religion Census: Religious Congregations & Membership Study. Association of Statisticians of American Religious Bodies. Jones, Dale E., et al. 2002. Congregations and Membership in the United States 2000. Nashville, TN: Glenmary Research Center.
Food Environment Statistics:
| Tehama County: | 1.80 / 10,000 pop. |
| State: | 2.14 / 10,000 pop. |
| This county: | 0.98 / 10,000 pop. |
| California: | 0.62 / 10,000 pop. |
| Tehama County: | 3.12 / 10,000 pop. |
| California: | 1.49 / 10,000 pop. |
| This county: | 4.76 / 10,000 pop. |
| State: | 7.42 / 10,000 pop. |
| Tehama County: | 8.4% |
| California: | 7.3% |
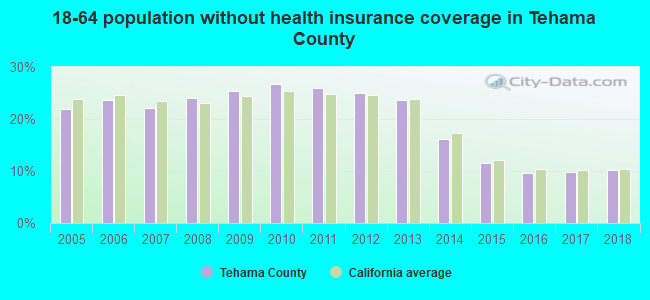
| Tehama County: | 25.5% |
| State: | 21.3% |
| Here: | 13.3% |
| State: | 17.9% |
Agriculture in Tehama County:
Average size of farms: 548 acresAverage value of agricultural products sold per farm: $70,018
Average value of crops sold per acre for harvested cropland: $1055.04
The value of livestock, poultry, and their products as a percentage of the total market value of agricultural products sold: 33.51%
Average total farm production expenses per farm: $66,165
Harvested cropland as a percentage of land in farms: 8.05%
Irrigated harvested cropland as a percentage of land in farms: 89.04%
Average market value of all machinery and equipment per farm: $42,217
The percentage of farms operated by a family or individual: 91.54%
Average age of principal farm operators: 58 years
Average number of cattle and calves per 100 acres of all land in farms: 7.91
Milk cows as a percentage of all cattle and calves: 8.05%
Corn for grain: 1199 harvested acres
All wheat for grain: 1520 harvested acres
Vegetables: 100 harvested acres
Land in orchards: 45,236 acres
Earthquake activity:
Tehama County-area historical earthquake activity is significantly above California state average. It is 5727% greater than the overall U.S. average.On 4/18/1906 at 13:12:21, a magnitude 7.9 (7.9 UK, Class: Major, Intensity: VIII - XII) earthquake occurred 154.0 miles away from Tehama County center, causing $524,000,000 total damage
On 1/31/1922 at 13:17:28, a magnitude 7.6 (7.6 UK) earthquake occurred 184.3 miles away from the county center
On 4/25/1992 at 18:06:04, a magnitude 7.2 (6.3 MB, 7.1 MS, 7.2 MW, 7.1 MW, Depth: 9.4 mi) earthquake occurred 103.2 miles away from the county center, causing $75,000,000 total damage
On 11/8/1980 at 10:27:34, a magnitude 7.2 (6.2 MB, 7.2 MS, 7.2 MW, 7.0 ML) earthquake occurred 132.6 miles away from the county center
On 10/3/1915 at 06:52:48, a magnitude 7.6 (7.6 UK) earthquake occurred 245.8 miles away from Tehama County center
On 1/22/1923 at 09:04:18, a magnitude 7.2 (7.2 UK) earthquake occurred 170.1 miles away from the county center
Magnitude types: body-wave magnitude (MB), local magnitude (ML), surface-wave magnitude (MS), moment magnitude (MW)
Most recent natural disasters:
- California Covid-19 Pandemic, Incident Period: January 20, 2020, FEMA Id: 4482, Natural disaster type: Other
- California Severe Winter Storms, Flooding, Landslides, And Mudslides, Incident Period: February 24, 2019 - March 1, 2019, FEMA Id: 4434, Natural disaster type: Winter Storm, Mudslide, Landslide, Flood
- California Severe Winter Storms, Flooding, Mudslides, Incident Period: February 1, 2017 - February 23, 2017, FEMA Id: 4308, Natural disaster type: Winter Storm, Mudslide, Flood
- California Hurricane Katrina Evacuation, Incident Period: August 29, 2005 to October 01, 2005, Emergency Declared EM-3248: September 13, 2005, FEMA Id: 3248, Natural disaster type: Hurricane
- California Manton Fire, Incident Period: August 26, 2005 to September 02, 2005, Fire Management Assistance Declared: August 26, 2005, FEMA Id: 2580, Natural disaster type: Fire
- California Extreme Fire Hazards, Incident Period: August 24, 1999 to November 29, 1999, Emergency Declared EM-3140: September 01, 1999, FEMA Id: 3140, Natural disaster type: Fire
- California Severe Winter Storms and Flooding, Incident Period: February 02, 1998 to April 30, 1998, Major Disaster (Presidential) Declared DR-1203: February 09, 1998, FEMA Id: 1203, Natural disaster type: Winter Storm, Flood
- California Severe Storms/Flooding, Incident Period: December 28, 1996 to April 01, 1997, Major Disaster (Presidential) Declared DR-1155: January 04, 1997, FEMA Id: 1155, Natural disaster type: Storm, Flood
- California Severe Winter Storms, Flooding, Landslides, Mud Flows, Incident Period: February 13, 1995 to April 19, 1995, Major Disaster (Presidential) Declared DR-1046: March 12, 1995, FEMA Id: 1046, Natural disaster type: Winter Storm, Landslide, Flood
- California Severe Winter Storms, Flooding, Landslides, Mud Flows, Incident Period: January 03, 1995 to February 10, 1995, Major Disaster (Presidential) Declared DR-1044: January 10, 1995, FEMA Id: 1044, Natural disaster type: Winter Storm, Landslide, Flood
- 9 other natural disasters have been reported since 1953.
The number of natural disasters in Tehama County (19) is greater than the US average (15).
Major Disasters (Presidential) Declared: 12
Emergencies Declared: 3
Causes of natural disasters: Floods: 13, Storms: 7, Winter Storms: 6, Landslides: 4, Fires: 2, Mudslides: 2, Drought: 1, Freeze: 1, Heavy Rain: 1, Hurricane: 1, Tornado: 1, Other: 1 (Note: some incidents may be assigned to more than one category).

Means of transportation to work:
- Drove a car alone: 16,884 (75.0%)
- Carpooled: 2,105 (9.3%)
- Bus: 18 (0.1%)
- Taxicab, motorcycle, or other means: 203 (0.9%)
- Bicycle: 8 (0.0%)
- Walked: 337 (1.5%)
- Worked at home: 2,865 (12.7%)
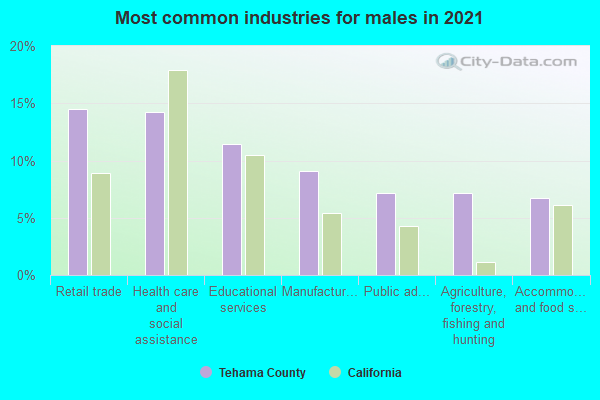
- Health care and social assistance (21%)
- Educational services (14%)
- Public administration (9%)
- Agriculture, forestry, fishing and hunting (7%)
- Manufacturing (6%)
- Retail trade (6%)
- Other services, except public administration (5%)
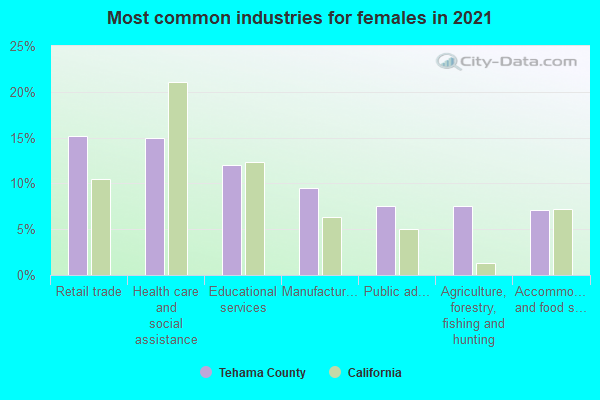
- Health care and social assistance (25%)
- Educational services (16%)
- Public administration (10%)
- Agriculture, forestry, fishing and hunting (8%)
- Manufacturing (8%)
- Retail trade (7%)
- Other services, except public administration (5%)
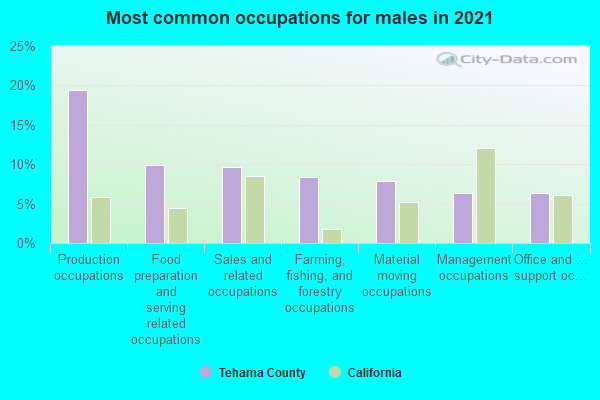
- Production occupations (12%)
- Construction and extraction occupations (10%)
- Building and grounds cleaning and maintenance occupations (8%)
- Farming, fishing, and forestry occupations (7%)
- Sales and related occupations (7%)
- Material moving occupations (7%)
- Office and administrative support occupations (7%)
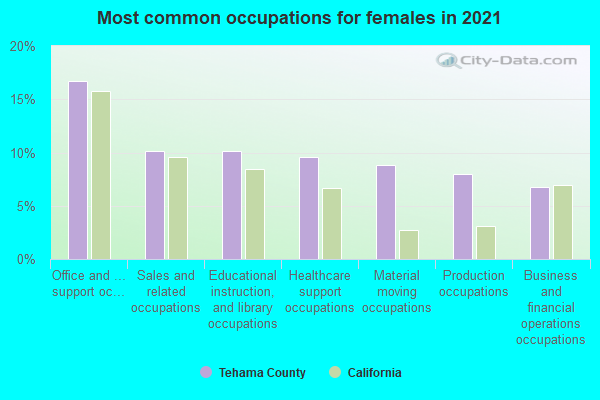
- Office and administrative support occupations (25%)
- Educational instruction, and library occupations (9%)
- Healthcare support occupations (8%)
- Management occupations (7%)
- Sales and related occupations (6%)
- Food preparation and serving related occupations (5%)
- Health diagnosing and treating practitioners and other technical occupations (5%)

- Mexico (77%)
- Laos (3%)
- Germany (2%)
- Philippines (2%)
- Ecuador (1%)
- Thailand (1%)
- India (1%)
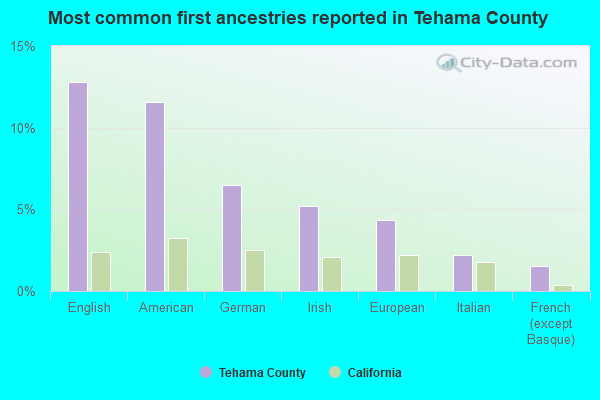
- American (14%)
- English (12%)
- German (6%)
- Irish (5%)
- European (4%)
- Italian (2%)
- French (except Basque) (2%)

People in group quarters in Tehama County, California in 2010:
- 194 people in state prisons
- 178 people in local jails and other municipal confinement facilities
- 164 people in group homes intended for adults
- 133 people in other noninstitutional facilities
- 100 people in nursing facilities/skilled-nursing facilities
- 31 people in residential treatment centers for adults
- 17 people in group homes for juveniles (non-correctional)
- 15 people in correctional facilities intended for juveniles
- 9 people in workers' group living quarters and job corps centers
People in group quarters in Tehama County, California in 2000:
- 271 people in nursing homes
- 197 people in local jails and other confinement facilities (including police lockups)
- 121 people in other noninstitutional group quarters
- 120 people in other workers' dormitories
- 108 people in state prisons
- 40 people in homes or halfway houses for drug/alcohol abuse
- 29 people in homes for the mentally retarded
- 28 people in short-term care, detention or diagnostic centers for delinquent children
- 26 people in homes for the mentally ill
- 25 people in other group homes
- 25 people in religious group quarters
- 12 people in training schools for juvenile delinquents
- 3 people in agriculture workers' dormitories on farms
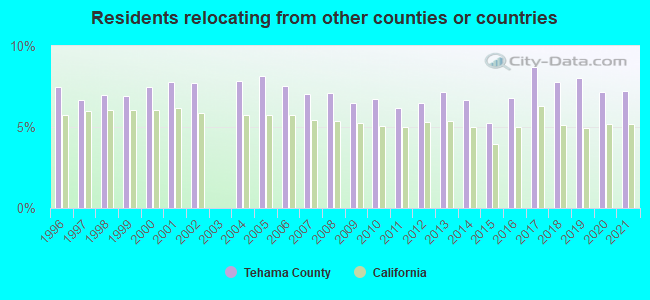
7.23% of this county's 2021 resident taxpayers lived in other counties in 2020 ($52,689 average adjusted gross income)
| Here: | 7.23% |
| California average: | 5.19% |
10 or fewer of this county's residents moved from foreign countries.
5.76% relocated from other counties in California ($44,262 average AGI)
1.47% relocated from other states ($8,427 average AGI)
Tehama County: 1.47% California average: 1.56%
Top counties from which taxpayers relocated into this county between 2020 and 2021:
| from Shasta County, CA | |
| from Butte County, CA | |
| from Glenn County, CA | |
| from Sacramento County, CA | |
| from Contra Costa County, CA | |
| from Sonoma County, CA | |
| from Alameda County, CA |
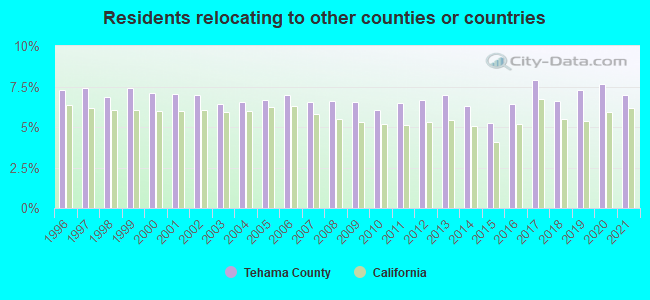
6.99% of this county's 2020 resident taxpayers moved to other counties in 2021 ($51,706 average adjusted gross income)
| Here: | 6.99% |
| California average: | 6.14% |
10 or fewer of this county's residents moved to foreign countries.
4.80% relocated to other counties in California ($35,727 average AGI)
2.19% relocated to other states ($15,979 average AGI)
Tehama County: 2.19% California average: 2.55%
Top counties to which taxpayers relocated from this county between 2020 and 2021:
| to Shasta County, CA | |
| to Butte County, CA | |
| to Glenn County, CA | |
| to Sacramento County, CA |
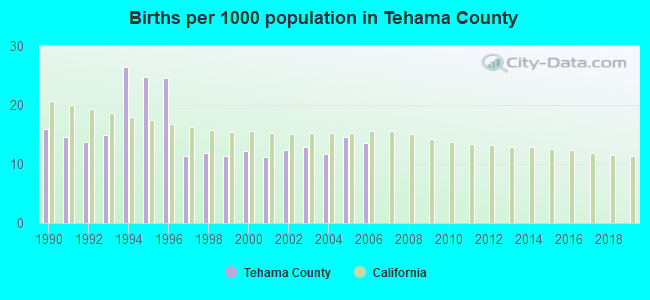
Births per 1000 population from 1990 to 1999: 16.9
Births per 1000 population from 2000 to 2006: 12.6
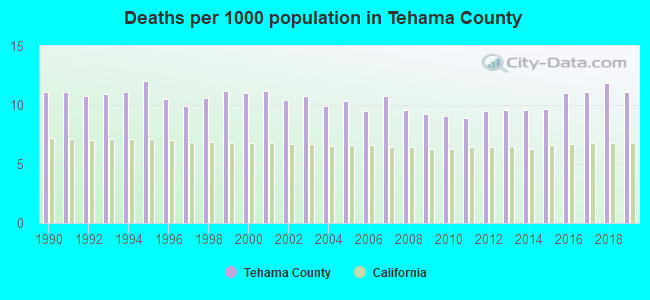
Deaths per 1000 population from 1990 to 1999: 10.9
Deaths per 1000 population from 2000 to 2009: 10.3
Deaths per 1000 population from 2010 to 2020: 10.3
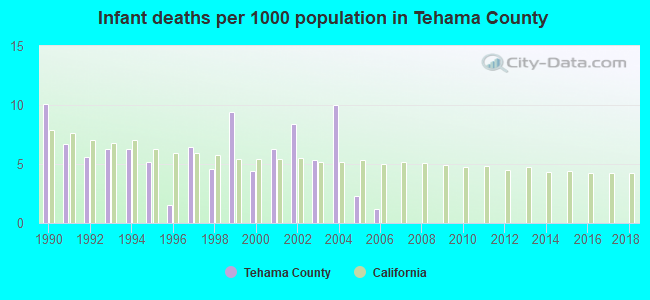
Infant deaths per 1000 live births from 1990 to 1999: 6.2
Infant deaths per 1000 live births from 2000 to 2006: 5.4
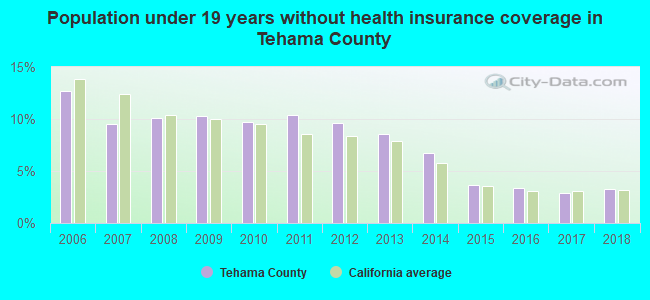
Persons under 19 years old without health insurance coverage in 2018: 3.3%

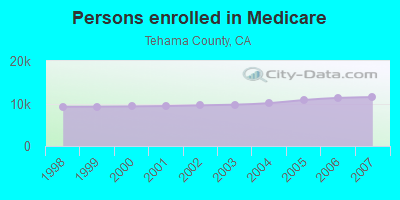
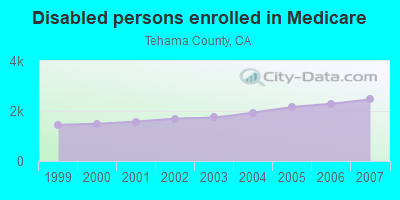
Persons enrolled in hospital insurance and/or supplemental medical insurance (Medicare) in July 1, 2007: 11,499 (9,033 aged, 2,466 disabled)
Children under 18 without health insurance coverage in 2007: 1,326 (9%)

Most common underlying causes of death in Tehama County, California in 1999 - 2019:
- Acute myocardial infarction, unspecified (899)
- Bronchus or lung, unspecified - Malignant neoplasms (882)
- Atherosclerotic heart disease (878)
- Chronic obstructive pulmonary disease, unspecified (785)
- Alzheimer disease, unspecified (428)
- Stroke, not specified as haemorrhage or infarction (416)
- Congestive heart failure (253)
- Pneumonia, unspecified (176)
- Unspecified dementia (174)
- Colon, unspecified - Malignant neoplasms (106)
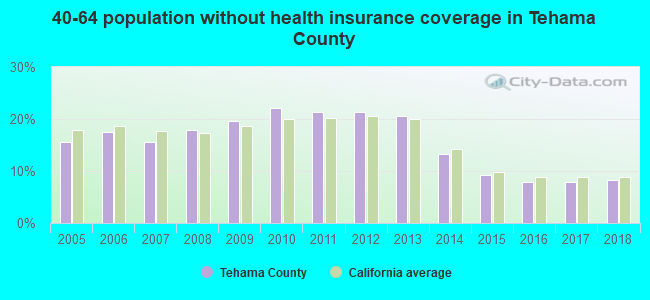
Population without health insurance coverage in 2000: 20%
Children under 18 without health insurance coverage in 2000: 17%
Suicides per 1,000,000 population from 2000 to 2006: 167.4. This is less than state average.
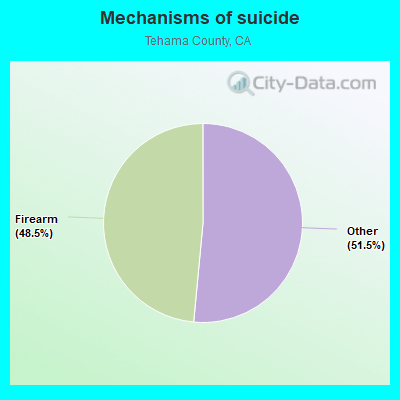
- Firearm - 81.2
- Other - 86.2
Household type by relationship:
Households: 65,245- Male householders: 11,608 (2,673 living alone), Female householders: 13,017 (3,952 living alone)
12,081 spouses (11,978 opposite-sex spouses), 1,862 unmarried partners, (1,714 opposite-sex unmarried partners), 18,021 children (15,954 natural, 590 adopted, 1,477 stepchildren), 3,292 grandchildren, 317 brothers or sisters, 1,072 parents, 0 foster children, 1,313 other relatives, 1,421 non-relatives
- In group quarters: 1,241
Size of family households: 7,665 2-persons, 3,486 3-persons, 2,435 4-persons, 1,685 5-persons, 750 6-persons, 1,223 7-or-more-persons.
Size of nonfamily households: 6,625 1-person, 544 2-persons, 137 3-persons, 75 4-persons.
8,318 married couples with children.
4,543 single-parent households (1,295 men, 3,248 women).
79.6% of residents of Tehama speak English at home.
18.3% of residents speak Spanish at home (70% speak English very well, 11% speak English well, 10% speak English not well, 8% don't speak English at all).
0.6% of residents speak other Indo-European language at home (78% speak English very well, 16% speak English well, 5% speak English not well, 1% don't speak English at all).
1.0% of residents speak Asian or Pacific Island language at home (35% speak English very well, 47% speak English well, 12% speak English not well, 6% don't speak English at all).
0.2% of residents speak other language at home (100% speak English very well).
In fiscal year 2004:
Federal Government expenditure: $329,612,000 ($5,487 per capita)
Department of Defense expenditure: $7,019,000
Federal direct payments to individuals for retirement and disability: $150,788,000
Federal other direct payments to individuals: $73,367,000
Federal direct payments not to individuals: $3,205,000
Federal grants: $77,371,000
Federal procurement contracts: $10,581,000 ($915,000 Department of Defense)
Federal salaries and wages: $14,300,000 ($695,000 Department of Defense)
Federal Government direct loans: $11,606,000
Federal guaranteed/insured loans: $17,682,000
Federal Government insurance: $149,652,000
Population change from April 1, 2000 to July 1, 2005:
Births: 3,778| Here: | 62 per 1000 residents |
| State: | 77 per 1000 residents |
Deaths: 3,343
| Here: | 55 per 1000 residents |
| State: | 34 per 1000 residents |
Net international migration: +502
| Here: | +8 per 1000 residents |
| State: | +39 per 1000 residents |
Net internal migration: +4,288
| Here: | |
| State: |

Total withdrawal of fresh water for public supply: 6.73 millions of gallons per day (all from ground)
| Here: | 5.9 |
| State: | 6.0 |
| Here: | 4.4 |
| State: | 3.9 |
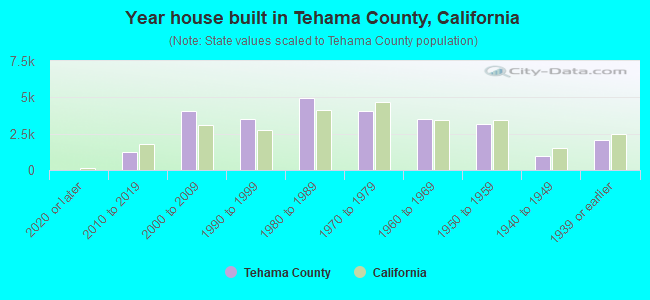
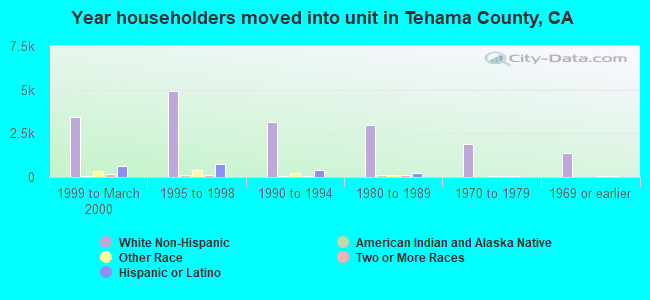
- Year house built in Tehama County, California
- 822020 or later
- 9912010 to 2019
- 2,7532000 to 2009
- 4,6791990 to 1999
- 5,9361980 to 1989
- 4,8771970 to 1979
- 2,5111960 to 1969
- 2,8591950 to 1959
- 6741940 to 1949
- 2,3041939 or earlier
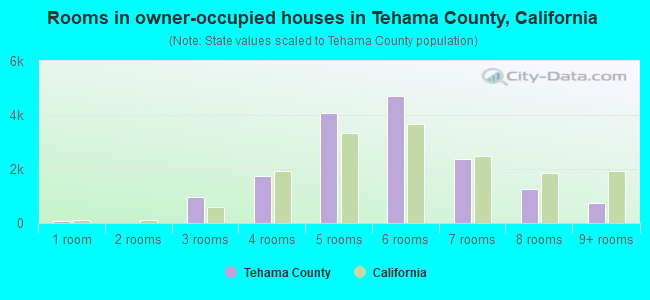
- Rooms in owner-occupied houses in Tehama County, California
- 3211 room
- 872 rooms
- 3053 rooms
- 1,7414 rooms
- 3,3855 rooms
- 4,6336 rooms
- 3,0937 rooms
- 8608 rooms
- 9539+ rooms
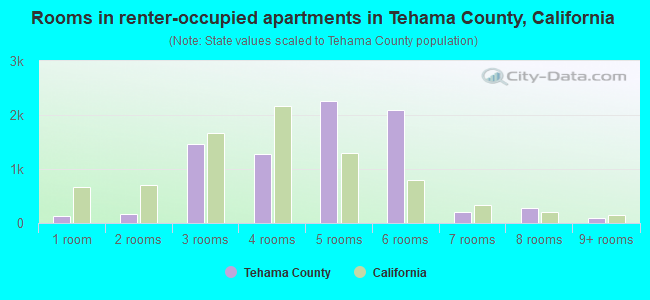
- Rooms in renter-occupied apartments in Tehama County, California
- 01 room
- 1,2572 rooms
- 9123 rooms
- 2,7684 rooms
- 1,5065 rooms
- 1,8316 rooms
- 5657 rooms
- 398 rooms
- 3699+ rooms
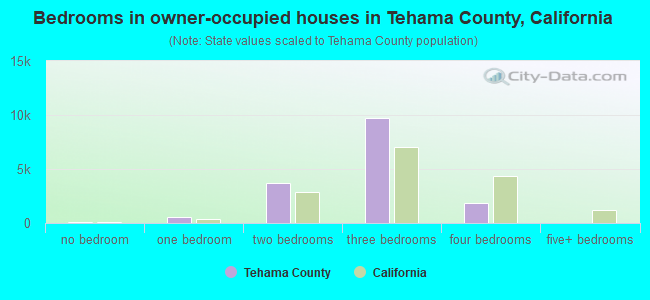
- Bedrooms in owner-occupied houses in Tehama County, California
- 321no bedroom
- 1901 bedroom
- 3,4172 bedrooms
- 8,9273 bedrooms
- 2,2734 bedrooms
- 2505+ bedrooms

- Bedrooms in renter-occupied apartments in Tehama County, California
- 0no bedroom
- 1,7071 bedroom
- 4,1912 bedrooms
- 2,7793 bedrooms
- 5704 bedrooms
- 05+ bedrooms
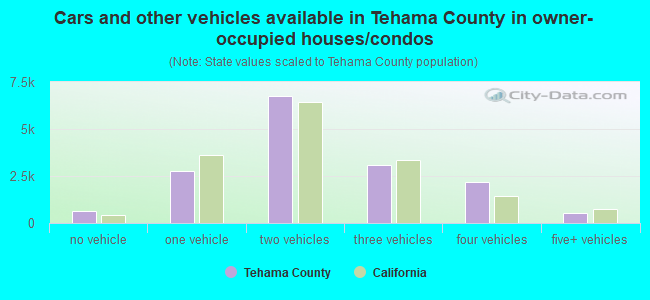
- Cars and other vehicles available in Tehama County in owner-occupied houses/condos
- 483no vehicle
- 3,7711 vehicle
- 5,4722 vehicles
- 2,9283 vehicles
- 2,0954 vehicles
- 6295+ vehicles
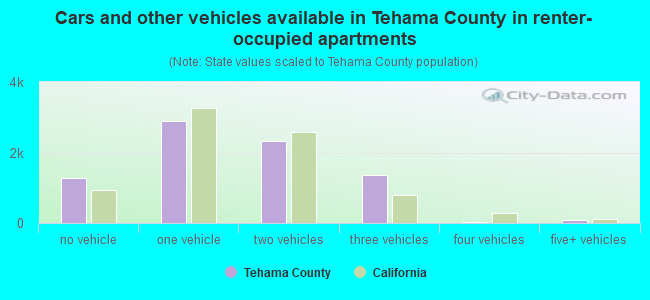
- Cars and other vehicles available in Tehama County in renter-occupied apartments
- 1,081no vehicle
- 4,0781 vehicle
- 2,5162 vehicles
- 1,1653 vehicles
- 4074 vehicles
- 05+ vehicles
93.0% of Tehama County residents lived in the same house 1 years ago.
Out of people who lived in different houses, 30% lived in this county.
Out of people who lived in different counties, 79% lived in California.
| Tehama County: | 93.0% |
| State average: | 88.9% |
Place of birth for U.S.-born residents:
- This state: 43,619
- Other state: 13,915
- Northeast: 1,612
- Midwest: 3,417
- South: 4,239
- West: 4,647
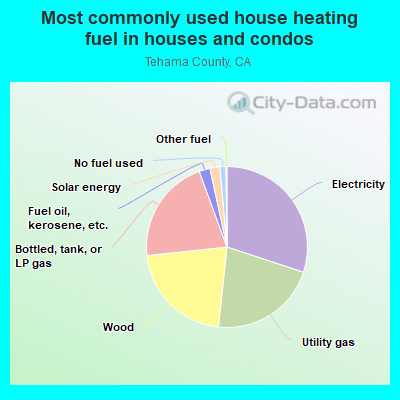
- 27.6%Utility gas
- 23.4%Bottled, tank, or LP gas
- 23.0%Wood
- 17.5%Electricity
- 3.8%Fuel oil, kerosene, etc.
- 3.8%Solar energy
- 1.0%Other fuel
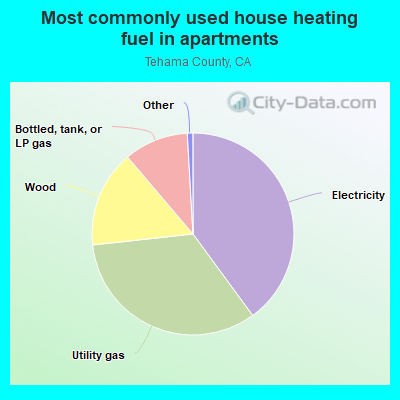
- 44.6%Electricity
- 27.7%Utility gas
- 15.1%Bottled, tank, or LP gas
- 11.1%Wood
- 1.2%Fuel oil, kerosene, etc.
- 0.3%Solar energy
Private vs. public school enrollment:
| Here: | 10.5% |
| California: | 10.5% |
| Here: | 10.0% |
| California: | 8.5% |
| Here: | 13.8% |
| California: | 15.9% |


Tehama County government finances - Expenditure in 2020:
- Bond Funds - Cash and Securities: $17,745,000
Cash and Securities: $15,297,000
- Charges - Other: $9,679,000
Other: $8,530,000
Solid Waste Management: $6,267,000
Solid Waste Management: $4,895,000
Miscellaneous Commercial Activities: $401,000
Regular Highways: $255,000
Sewerage: $165,000
Parks and Recreation: $146,000
Parks and Recreation: $111,000
Sewerage: $69,000
- Construction - Regular Highways: $24,132,000
Regular Highways: $10,916,000
Public Welfare - Other: $2,849,000
Police Protection: $2,078,000
Parks and Recreation: $1,418,000
Police Protection: $1,293,000
Public Welfare - Other: $429,000
Central Staff Services: $268,000
Parks and Recreation: $104,000
Health - Other: $56,000
Miscellaneous Commercial Activities - Other: $17,000
- Current Operations - Police Protection: $44,422,000
Police Protection: $40,690,000
Public Welfare - Other: $33,207,000
Public Welfare - Other: $27,445,000
Central Staff Services: $23,286,000
Central Staff Services: $17,739,000
Regular Highways: $12,880,000
Regular Highways: $10,027,000
Health - Other: $8,124,000
Health - Other: $7,250,000
Judicial and Legal Services: $5,668,000
Solid Waste Management: $4,303,000
Solid Waste Management: $3,695,000
Financial Administration: $2,474,000
Parks and Recreation: $1,990,000
Parks and Recreation: $1,615,000
Corrections - Other: $400,000
Miscellaneous Commercial Activities - Other: $353,000
Housing and Community Development: $350,000
Natural Resources - Other: $209,000
Transit Utilities: $175,000
Sewerage: $156,000
Sewerage: $141,000
General - Other: $127,000
General - Other: $44,000
Natural Resources - Other: $20,000
- General - Interest on Debt: $788,000
Interest on Debt: $638,000
- Intergovernmental to Local - Other - Sewerage: $54,000
- Local Intergovernmental - Other: $4,700,000
Sewerage: $52,000
- Long Term Debt - Beginning Outstanding - Unspecified Public Purpose: $20,945,000
Outstanding Unspecified Public Purpose: $20,460,000
Beginning Outstanding - Unspecified Public Purpose: $15,823,000
Retired Unspecified Public Purpose: $14,996,000
Retired Nonguaranteed - Public Debt for Private Purpose: $7,515,000
Beginning Outstanding - Public Debt for Private Purpose: $7,515,000
Retired Unspecified Public Purpose: $920,000
Outstanding Unspecified Public Purpose: $827,000
Issue, Unspecified Public Purpose: $435,000
- Miscellaneous - Interest Earnings: $6,486,000
General Revenue - Other: $4,463,000
Interest Earnings: $1,311,000
General Revenue - Other: $964,000
Fines and Forfeits: $921,000
Fines and Forfeits: $316,000
Sale of Property: $96,000
Sale of Property: $11,000
- Other Capital Outlay - General - Other: $10,000
- Other Funds - Cash and Securities: $51,817,000
Cash and Securities: $37,449,000
- Revenue - Transit Utilities: $150,000
- Sinking Funds - Cash and Securities: $55,981,000
Cash and Securities: $18,000
- State Intergovernmental - Public Welfare: $25,452,000
Other: $21,004,000
Public Welfare: $19,961,000
General Local Government Support: $13,287,000
Highways: $10,503,000
Highways: $9,086,000
Other: $6,700,000
Health and Hospitals: $5,673,000
Health and Hospitals: $3,094,000
General Local Government Support: $813,000
Housing and Community Development: $133,000
- Tax - General Sales and Gross Receipts: $46,529,000
Property: $40,995,000
General Sales and Gross Receipts: $39,675,000
Property: $26,945,000
Other License: $2,379,000
Other License: $1,204,000
Motor Vehicle License: $119,000
- Total Salaries and Wages: $176,555,000
Tehama County government finances - Revenue in 2020:
- Bond Funds - Cash and Securities: $17,745,000
Cash and Securities: $15,297,000
- Charges - Other: $9,679,000
Other: $8,530,000
Solid Waste Management: $6,267,000
Solid Waste Management: $4,895,000
Miscellaneous Commercial Activities: $401,000
Regular Highways: $255,000
Sewerage: $165,000
Parks and Recreation: $146,000
Parks and Recreation: $111,000
Sewerage: $69,000
- Construction - Regular Highways: $24,132,000
Regular Highways: $10,916,000
Public Welfare - Other: $2,849,000
Police Protection: $2,078,000
Parks and Recreation: $1,418,000
Police Protection: $1,293,000
Public Welfare - Other: $429,000
Central Staff Services: $268,000
Parks and Recreation: $104,000
Health - Other: $56,000
Miscellaneous Commercial Activities - Other: $17,000
- Current Operations - Police Protection: $44,422,000
Police Protection: $40,690,000
Public Welfare - Other: $33,207,000
Public Welfare - Other: $27,445,000
Central Staff Services: $23,286,000
Central Staff Services: $17,739,000
Regular Highways: $12,880,000
Regular Highways: $10,027,000
Health - Other: $8,124,000
Health - Other: $7,250,000
Judicial and Legal Services: $5,668,000
Solid Waste Management: $4,303,000
Solid Waste Management: $3,695,000
Financial Administration: $2,474,000
Parks and Recreation: $1,990,000
Parks and Recreation: $1,615,000
Corrections - Other: $400,000
Miscellaneous Commercial Activities - Other: $353,000
Housing and Community Development: $350,000
Natural Resources - Other: $209,000
Transit Utilities: $175,000
Sewerage: $156,000
Sewerage: $141,000
General - Other: $127,000
General - Other: $44,000
Natural Resources - Other: $20,000
- General - Interest on Debt: $788,000
Interest on Debt: $638,000
- Intergovernmental to Local - Other - Sewerage: $54,000
- Local Intergovernmental - Other: $4,700,000
Sewerage: $52,000
- Long Term Debt - Beginning Outstanding - Unspecified Public Purpose: $20,945,000
Outstanding Unspecified Public Purpose: $20,460,000
Beginning Outstanding - Unspecified Public Purpose: $15,823,000
Retired Unspecified Public Purpose: $14,996,000
Retired Nonguaranteed - Public Debt for Private Purpose: $7,515,000
Beginning Outstanding - Public Debt for Private Purpose: $7,515,000
Retired Unspecified Public Purpose: $920,000
Outstanding Unspecified Public Purpose: $827,000
Issue, Unspecified Public Purpose: $435,000
- Miscellaneous - Interest Earnings: $6,486,000
General Revenue - Other: $4,463,000
Interest Earnings: $1,311,000
General Revenue - Other: $964,000
Fines and Forfeits: $921,000
Fines and Forfeits: $316,000
Sale of Property: $96,000
Sale of Property: $11,000
- Other Capital Outlay - General - Other: $10,000
- Other Funds - Cash and Securities: $51,817,000
Cash and Securities: $37,449,000
- Revenue - Transit Utilities: $150,000
- Sinking Funds - Cash and Securities: $55,981,000
Cash and Securities: $18,000
- State Intergovernmental - Public Welfare: $25,452,000
Other: $21,004,000
Public Welfare: $19,961,000
General Local Government Support: $13,287,000
Highways: $10,503,000
Highways: $9,086,000
Other: $6,700,000
Health and Hospitals: $5,673,000
Health and Hospitals: $3,094,000
General Local Government Support: $813,000
Housing and Community Development: $133,000
- Tax - General Sales and Gross Receipts: $46,529,000
Property: $40,995,000
General Sales and Gross Receipts: $39,675,000
Property: $26,945,000
Other License: $2,379,000
Other License: $1,204,000
Motor Vehicle License: $119,000
- Total Salaries and Wages: $176,555,000
Tehama County government finances - Debt in 2020:
- Bond Funds - Cash and Securities: $17,745,000
Cash and Securities: $15,297,000
- Charges - Other: $9,679,000
Other: $8,530,000
Solid Waste Management: $6,267,000
Solid Waste Management: $4,895,000
Miscellaneous Commercial Activities: $401,000
Regular Highways: $255,000
Sewerage: $165,000
Parks and Recreation: $146,000
Parks and Recreation: $111,000
Sewerage: $69,000
- Construction - Regular Highways: $24,132,000
Regular Highways: $10,916,000
Public Welfare - Other: $2,849,000
Police Protection: $2,078,000
Parks and Recreation: $1,418,000
Police Protection: $1,293,000
Public Welfare - Other: $429,000
Central Staff Services: $268,000
Parks and Recreation: $104,000
Health - Other: $56,000
Miscellaneous Commercial Activities - Other: $17,000
- Current Operations - Police Protection: $44,422,000
Police Protection: $40,690,000
Public Welfare - Other: $33,207,000
Public Welfare - Other: $27,445,000
Central Staff Services: $23,286,000
Central Staff Services: $17,739,000
Regular Highways: $12,880,000
Regular Highways: $10,027,000
Health - Other: $8,124,000
Health - Other: $7,250,000
Judicial and Legal Services: $5,668,000
Solid Waste Management: $4,303,000
Solid Waste Management: $3,695,000
Financial Administration: $2,474,000
Parks and Recreation: $1,990,000
Parks and Recreation: $1,615,000
Corrections - Other: $400,000
Miscellaneous Commercial Activities - Other: $353,000
Housing and Community Development: $350,000
Natural Resources - Other: $209,000
Transit Utilities: $175,000
Sewerage: $156,000
Sewerage: $141,000
General - Other: $127,000
General - Other: $44,000
Natural Resources - Other: $20,000
- General - Interest on Debt: $788,000
Interest on Debt: $638,000
- Intergovernmental to Local - Other - Sewerage: $54,000
- Local Intergovernmental - Other: $4,700,000
Sewerage: $52,000
- Long Term Debt - Beginning Outstanding - Unspecified Public Purpose: $20,945,000
Outstanding Unspecified Public Purpose: $20,460,000
Beginning Outstanding - Unspecified Public Purpose: $15,823,000
Retired Unspecified Public Purpose: $14,996,000
Retired Nonguaranteed - Public Debt for Private Purpose: $7,515,000
Beginning Outstanding - Public Debt for Private Purpose: $7,515,000
Retired Unspecified Public Purpose: $920,000
Outstanding Unspecified Public Purpose: $827,000
Issue, Unspecified Public Purpose: $435,000
- Miscellaneous - Interest Earnings: $6,486,000
General Revenue - Other: $4,463,000
Interest Earnings: $1,311,000
General Revenue - Other: $964,000
Fines and Forfeits: $921,000
Fines and Forfeits: $316,000
Sale of Property: $96,000
Sale of Property: $11,000
- Other Capital Outlay - General - Other: $10,000
- Other Funds - Cash and Securities: $51,817,000
Cash and Securities: $37,449,000
- Revenue - Transit Utilities: $150,000
- Sinking Funds - Cash and Securities: $55,981,000
Cash and Securities: $18,000
- State Intergovernmental - Public Welfare: $25,452,000
Other: $21,004,000
Public Welfare: $19,961,000
General Local Government Support: $13,287,000
Highways: $10,503,000
Highways: $9,086,000
Other: $6,700,000
Health and Hospitals: $5,673,000
Health and Hospitals: $3,094,000
General Local Government Support: $813,000
Housing and Community Development: $133,000
- Tax - General Sales and Gross Receipts: $46,529,000
Property: $40,995,000
General Sales and Gross Receipts: $39,675,000
Property: $26,945,000
Other License: $2,379,000
Other License: $1,204,000
Motor Vehicle License: $119,000
- Total Salaries and Wages: $176,555,000
Tehama County government finances - Cash and Securities in 2020:
- Bond Funds - Cash and Securities: $17,745,000
Cash and Securities: $15,297,000
- Charges - Other: $9,679,000
Other: $8,530,000
Solid Waste Management: $6,267,000
Solid Waste Management: $4,895,000
Miscellaneous Commercial Activities: $401,000
Regular Highways: $255,000
Sewerage: $165,000
Parks and Recreation: $146,000
Parks and Recreation: $111,000
Sewerage: $69,000
- Construction - Regular Highways: $24,132,000
Regular Highways: $10,916,000
Public Welfare - Other: $2,849,000
Police Protection: $2,078,000
Parks and Recreation: $1,418,000
Police Protection: $1,293,000
Public Welfare - Other: $429,000
Central Staff Services: $268,000
Parks and Recreation: $104,000
Health - Other: $56,000
Miscellaneous Commercial Activities - Other: $17,000
- Current Operations - Police Protection: $44,422,000
Police Protection: $40,690,000
Public Welfare - Other: $33,207,000
Public Welfare - Other: $27,445,000
Central Staff Services: $23,286,000
Central Staff Services: $17,739,000
Regular Highways: $12,880,000
Regular Highways: $10,027,000
Health - Other: $8,124,000
Health - Other: $7,250,000
Judicial and Legal Services: $5,668,000
Solid Waste Management: $4,303,000
Solid Waste Management: $3,695,000
Financial Administration: $2,474,000
Parks and Recreation: $1,990,000
Parks and Recreation: $1,615,000
Corrections - Other: $400,000
Miscellaneous Commercial Activities - Other: $353,000
Housing and Community Development: $350,000
Natural Resources - Other: $209,000
Transit Utilities: $175,000
Sewerage: $156,000
Sewerage: $141,000
General - Other: $127,000
General - Other: $44,000
Natural Resources - Other: $20,000
- General - Interest on Debt: $788,000
Interest on Debt: $638,000
- Intergovernmental to Local - Other - Sewerage: $54,000
- Local Intergovernmental - Other: $4,700,000
Sewerage: $52,000
- Long Term Debt - Beginning Outstanding - Unspecified Public Purpose: $20,945,000
Outstanding Unspecified Public Purpose: $20,460,000
Beginning Outstanding - Unspecified Public Purpose: $15,823,000
Retired Unspecified Public Purpose: $14,996,000
Retired Nonguaranteed - Public Debt for Private Purpose: $7,515,000
Beginning Outstanding - Public Debt for Private Purpose: $7,515,000
Retired Unspecified Public Purpose: $920,000
Outstanding Unspecified Public Purpose: $827,000
Issue, Unspecified Public Purpose: $435,000
- Miscellaneous - Interest Earnings: $6,486,000
General Revenue - Other: $4,463,000
Interest Earnings: $1,311,000
General Revenue - Other: $964,000
Fines and Forfeits: $921,000
Fines and Forfeits: $316,000
Sale of Property: $96,000
Sale of Property: $11,000
- Other Capital Outlay - General - Other: $10,000
- Other Funds - Cash and Securities: $51,817,000
Cash and Securities: $37,449,000
- Revenue - Transit Utilities: $150,000
- Sinking Funds - Cash and Securities: $55,981,000
Cash and Securities: $18,000
- State Intergovernmental - Public Welfare: $25,452,000
Other: $21,004,000
Public Welfare: $19,961,000
General Local Government Support: $13,287,000
Highways: $10,503,000
Highways: $9,086,000
Other: $6,700,000
Health and Hospitals: $5,673,000
Health and Hospitals: $3,094,000
General Local Government Support: $813,000
Housing and Community Development: $133,000
- Tax - General Sales and Gross Receipts: $46,529,000
Property: $40,995,000
General Sales and Gross Receipts: $39,675,000
Property: $26,945,000
Other License: $2,379,000
Other License: $1,204,000
Motor Vehicle License: $119,000
- Total Salaries and Wages: $176,555,000
Supplemental Security Income (SSI) in 2006:
- Total number of recipients: 3,163
- Number of aged recipients: 349
- Number of blind and disabled recipients: 2,814
- Number of recipients under 18: 234
- Number of recipients between 18 and 64: 2,230
- Number of recipients older than 64: 699
- Number of recipients also receiving OASDI: 1,595
- Amount of payments (thousands of dollars): 1,761
| Most common first names in Tehama County, CA among deceased individuals | ||
| Name | Count | Lived (average) |
|---|---|---|
| John | 352 | 75.7 years |
| William | 299 | 75.0 years |
| Robert | 268 | 72.7 years |
| James | 262 | 73.1 years |
| Mary | 244 | 78.6 years |
| Charles | 182 | 75.7 years |
| George | 171 | 78.7 years |
| Richard | 142 | 69.2 years |
| Helen | 127 | 79.7 years |
| Dorothy | 122 | 78.8 years |
| Most common last names in Tehama County, CA among deceased individuals | ||
| Last name | Count | Lived (average) |
|---|---|---|
| Smith | 150 | 76.2 years |
| Johnson | 117 | 74.8 years |
| Brown | 105 | 78.4 years |
| Jones | 81 | 77.5 years |
| Williams | 75 | 79.2 years |
| Davis | 75 | 77.5 years |
| Wilson | 71 | 73.1 years |
| Miller | 68 | 76.8 years |
| Anderson | 65 | 77.7 years |
| Martin | 59 | 77.2 years |
| Businesses in Tehama County, CA | ||||
| Name | Count | Name | Count | |
|---|---|---|---|---|
| 7-Eleven | 1 | KFC | 1 | |
| AT&T | 1 | La-Z-Boy | 1 | |
| Ace Hardware | 3 | Lane Furniture | 1 | |
| Applebee's | 1 | Little Caesars Pizza | 1 | |
| Arby's | 2 | MasterBrand Cabinets | 2 | |
| AutoZone | 1 | McDonald's | 3 | |
| Baskin-Robbins | 1 | Motel 6 | 1 | |
| Best Western | 2 | Payless | 1 | |
| Blockbuster | 1 | Quiznos | 1 | |
| Burger King | 2 | RadioShack | 2 | |
| CVS | 1 | Rite Aid | 1 | |
| Chevrolet | 1 | Sears | 1 | |
| Comfort Inn | 1 | Staples | 1 | |
| Days Inn | 2 | Starbucks | 3 | |
| Dennys | 2 | Super 8 | 3 | |
| Domino's Pizza | 1 | T-Mobile | 1 | |
| FedEx | 7 | Taco Bell | 2 | |
| GNC | 2 | Travelodge | 1 | |
| GameStop | 1 | True Value | 2 | |
| H&R Block | 2 | U-Haul | 6 | |
| Hilton | 1 | UPS | 9 | |
| Holiday Inn | 1 | Vons | 1 | |
| Home Depot | 1 | Walgreens | 1 | |
| Jack In The Box | 1 | Walmart | 1 | |
| Jones New York | 2 | Wendy's | 1 | |
Tehama County on our top lists:
- #29 on the list of "Top 101 counties with highest percentage of residents voting for 3rd party candidates in the 2012 Presidential Election (pop. 50,000+)"
- #60 on the list of "Top 101 counties with the largest decrease in the number of deaths per 1000 residents 2000-2006 to 2007-2013 (pop. 50,000+)"