Sabine County, Texas (TX)
County owner-occupied free and clear houses and condos in 2010: 2,742
County owner-occupied houses and condos in 2000: 3,868
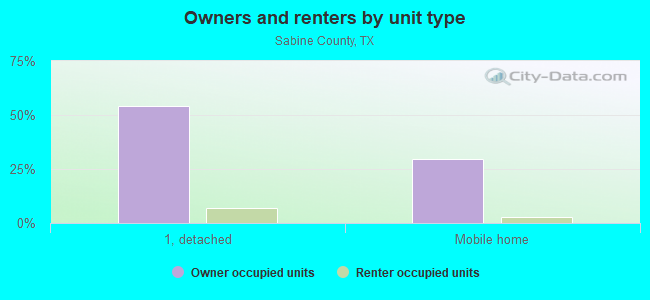
Renter-occupied apartments: 724 (it was 617 in 2000)
| % of renters here: | 14% |
| State: | 36% |
Land area: 490 sq. mi.
Water area: 86.3 sq. mi.
Population density: 21 people per square mile (low).
Industries providing employment: Educational, health and social services (30.1%), Retail trade (13.1%).
Type of workers:
- Private wage or salary: 71%
- Government: 24%
- Self-employed, not incorporated: 5%
- Unpaid family work: 0%
- OSM Map
- General Map
- Google Map
- MSN Map

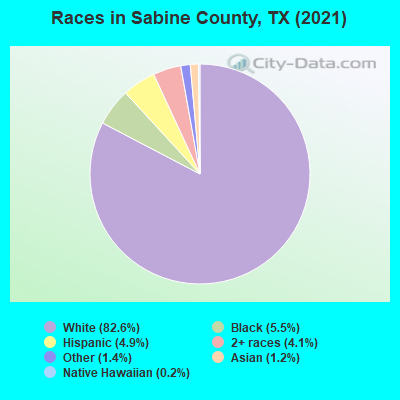
- 8,34382.5%White Non-Hispanic Alone
- 5265.2%Hispanic or Latino
- 5065.0%Black Non-Hispanic Alone
- 3943.9%Two or more races
- 1441.4%Some other race alone
- 1401.4%Asian alone
- 470.5%Native Hawaiian and Other
Pacific Islander alone - 160.2%American Indian and Alaska Native alone
| Median resident age: | 54.7 years |
| Texas median age: | 35.6 years |
| Males: 5,124 | |
| Females: 5,124 |

 | East TX “like third world”? (70 replies) |
| New County Population Estimates from the Census Bureau for Jluy 1, 2016 posted this morning about 9 A. M. (13 replies) |
| Anyone familiar with Conner Feud in Sabine County? (60 replies) |
| What's to do in Jasper, TX? (19 replies) |
| Wild Pigs (21 replies) |
| Did anyone feel the earthquakes in East Texas yesterday? (20 replies) |
| Sabine County: | 2.0 people |
| Texas: | 3 people |
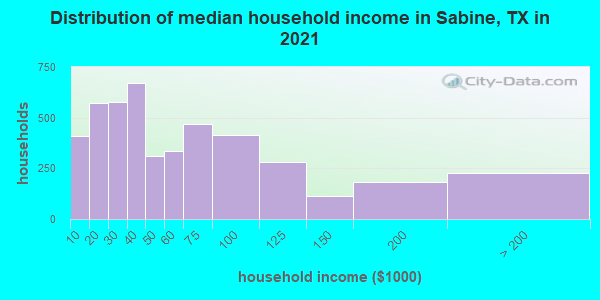
Estimated median household income in 2022: $46,577 ($27,198 in 1999)
| This county: | $46,577 |
| Texas: | $72,284 |
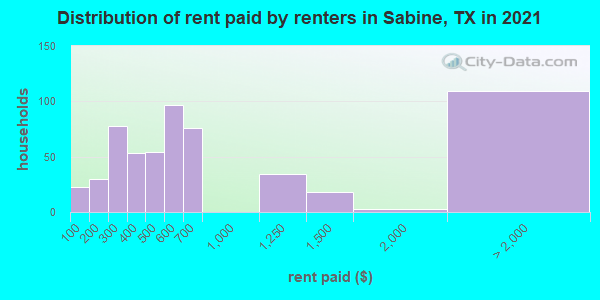
Median contract rent in 2022 for apartments: $496 (lower quartile is $319, upper quartile is $630)
| This county: | $496 |
| State: | $1117 |
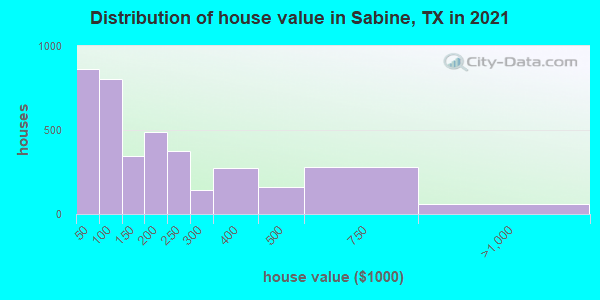
Estimated median house or condo value in 2022: $155,404 (it was $47,000 in 2000)
| Sabine: | $155,404 |
| Texas: | $275,400 |
Mean price in 2022:
Median monthly housing costs for homes and condos with a mortgage: $1,384Detached houses: $238,044
Here: $238,044 State: $369,058 Townhouses or other attached units: $400,347
Here: $400,347 State: $327,631 Mobile homes: $117,000
Here: $117,000 State: $124,413
Median monthly housing costs for units without a mortgage: $455
Institutionalized population: 73
Crime in 2021 (reported by the sheriff's office or county police, not the county total):
- Murders: 0
- Rapes: 7
- Robberies: 0
- Assaults: 13
- Burglaries: 15
- Thefts: 47
- Auto thefts: 7
Crime in 2020 (reported by the sheriff's office or county police, not the county total):
- Murders: 2
- Rapes: 1
- Robberies: 2
- Assaults: 10
- Burglaries: 25
- Thefts: 21
- Auto thefts: 12
Single-family new house construction building permits:
- 2022: 1 building, cost: $170,000
- 2021: 0 buildings
- 2020: 1 building, cost: $170,000
- 2019: 1 building, cost: $150,000
- 2018: 1 building, cost: $150,000
- 2017: 2 buildings, average cost: $187,500
- 2016: 3 buildings, average cost: $139,200
- 2015: 3 buildings, average cost: $135,000
- 2014: 0 buildings
- 2013: 0 buildings
- 2012: 0 buildings
- 2011: 0 buildings
- 2010: 5 buildings, average cost: $62,000
- 2009: 2 buildings, average cost: $148,500
- 2008: 0 buildings
- 2007: 1 building, cost: $170,500
- 2006: 0 buildings
- 2005: 0 buildings
- 2004: 1 building, cost: $160,000
- 2003: 1 building, cost: $70,000
- 2002: 1 building, cost: $70,000
- 2001: 0 buildings
- 2000: 0 buildings
- 1999: 0 buildings
- 1998: 1 building, cost: $56,000
- 1997: 2 buildings, average cost: $25,000

Median real estate property taxes paid for housing units with mortgages in 2022: $1,723 (0.7%)
Median real estate property taxes paid for housing units with no mortgage in 2022: $1,044 (0.8%)
| Sabine County: | 17.4% |
| Texas: | 14.0% |
Median age of residents in 2022: 54.7 years old
(Males: 54.9 years old, Females: 54.4 years old)
(Median age for: White residents: 55.0 years old, Black residents: 50.0 years old, American Indian residents: 40.1 years old, Asian residents: 33.6 years old, Hispanic or Latino residents: 33.7 years old, Other race residents: 68.4 years old)
Fair market rent in 2006 for a 1-bedroom apartment in Sabine County is $402 a month.
Fair market rent for a 2-bedroom apartment is $484 a month.
Fair market rent for a 3-bedroom apartment is $629 a month.
Neighboring counties: Lawrence County, Mississippi  , Pike County, Mississippi , Wayne County, Mississippi , Mills County
  , Trinity County
  .
.
| Here: | 5.4% |
| Texas: | 3.5% |

Current college students: 188
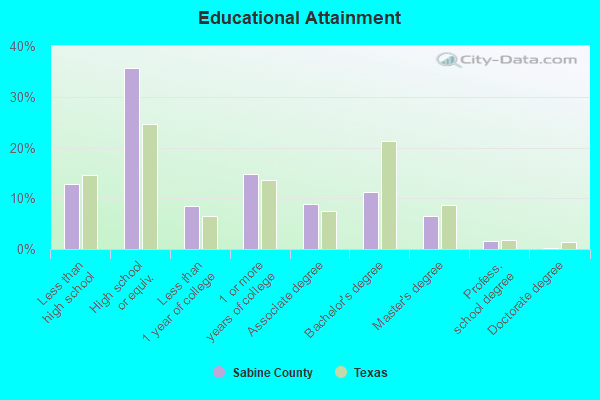
People 25 years of age or older with a high school degree or higher: 86.9%
People 25 years of age or older with a bachelor's degree or higher: 17.9%
Number of foreign born residents: 188 (77.1% naturalized citizens)
| Sabine County: | 1.8% |
| Whole state: | 17.2% |

- Year of entry for the foreign-born population
- 462010 or later
- 352000 to 2009
- 01990 to 1999
- 51980 to 1989
- 391970 to 1979
- 38Before 1970
Mean travel time to work (commute): # minutes
Percentage of county residents living and working in this county: 86.0%
Housing units in structures:
- One, detached: 4,731
- One, attached: 87
- Two: 69
- 3 or 4: 36
- 5 to 9: 43
- 20 or more: 3
- Mobile homes: 2,782
- Boats, RVs, vans, etc.: 46
Housing units in Sabine County with a mortgage: 1,061 (0 second mortgage, 0 home equity loan, 0 both second mortgage and home equity loan)
Houses without a mortgage: 0
| Here: | 100.0% with mortgage |
| State: | 98.4% with mortgage |
Religion statistics for Sabine County
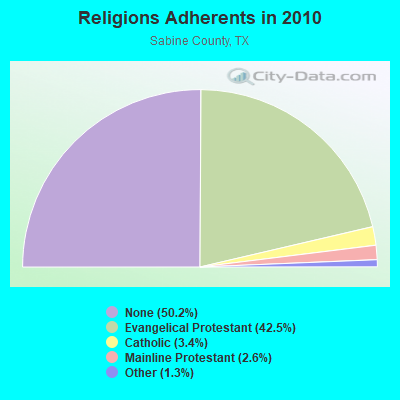
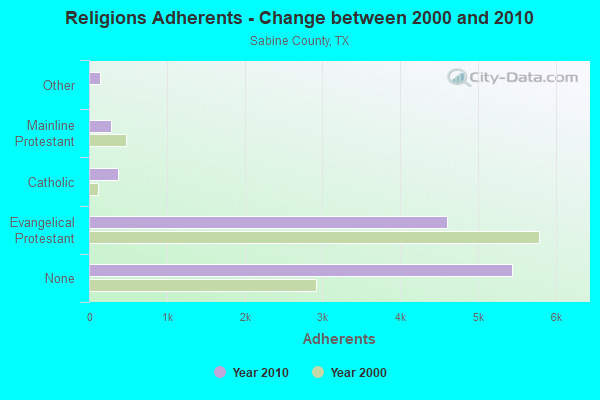
| Religion | Adherents | Congregations |
|---|---|---|
| Evangelical Protestant | 4,603 | 28 |
| Catholic | 367 | 1 |
| Mainline Protestant | 282 | 3 |
| Other | 142 | 1 |
| None | 5,440 | - |
Source: Clifford Grammich, Kirk Hadaway, Richard Houseal, Dale E.Jones, Alexei Krindatch, Richie Stanley and Richard H.Taylor. 2012. 2010 U.S.Religion Census: Religious Congregations & Membership Study. Association of Statisticians of American Religious Bodies. Jones, Dale E., et al. 2002. Congregations and Membership in the United States 2000. Nashville, TN: Glenmary Research Center.
Food Environment Statistics:
| Sabine County: | 2.97 / 10,000 pop. |
| State: | 1.47 / 10,000 pop. |
| This county: | 0.99 / 10,000 pop. |
| Texas: | 1.11 / 10,000 pop. |
| Sabine County: | 7.93 / 10,000 pop. |
| Texas: | 3.95 / 10,000 pop. |
| This county: | 4.95 / 10,000 pop. |
| State: | 6.13 / 10,000 pop. |
| Sabine County: | 11.8% |
| Texas: | 8.9% |
| Sabine County: | 26.6% |
| State: | 26.6% |
| Here: | 5.2% |
| State: | 15.7% |
Agriculture in Sabine County:
Average size of farms: 141 acresAverage value of agricultural products sold per farm: $31,291
Average value of crops sold per acre for harvested cropland: $108.73
The value of livestock, poultry, and their products as a percentage of the total market value of agricultural products sold: 94.55%
Average total farm production expenses per farm: $27,465
Harvested cropland as a percentage of land in farms: 11.15%
Irrigated harvested cropland as a percentage of land in farms: 3.87%
Average market value of all machinery and equipment per farm: $39,108
The percentage of farms operated by a family or individual: 96.35%
Average age of principal farm operators: 58 years
Average number of cattle and calves per 100 acres of all land in farms: 24.34
Milk cows as a percentage of all cattle and calves: 0.08%
Vegetables: 97 harvested acres
Land in orchards: 8 acres
Earthquake activity:
Sabine County-area historical earthquake activity is significantly above Texas state average. It is 253% greater than the overall U.S. average.On 5/17/2012 at 08:12:00, a magnitude 4.8 (4.8 MW, Depth: 3.1 mi, Class: Light, Intensity: IV - V) earthquake occurred 50.5 miles away from Sabine County center
On 9/2/2013 at 23:51:15, a magnitude 4.3 (4.3 MW, Depth: 2.9 mi) earthquake occurred 51.8 miles away from the county center
On 11/6/2011 at 03:53:10, a magnitude 5.7 (5.7 MW, Depth: 3.2 mi, Class: Moderate, Intensity: VI - VII) earthquake occurred 335.0 miles away from the county center
On 9/2/2013 at 21:52:38, a magnitude 4.2 (4.2 MW, Depth: 3.0 mi) earthquake occurred 58.5 miles away from the county center
On 1/25/2013 at 07:01:19, a magnitude 4.1 (4.1 MB, Depth: 3.1 mi) earthquake occurred 43.6 miles away from Sabine County center
On 9/3/2016 at 12:02:44, a magnitude 5.8 (5.8 MW, Depth: 3.5 mi) earthquake occurred 393.4 miles away from the county center
Magnitude types: body-wave magnitude (MB), moment magnitude (MW)
Most recent natural disasters:
- Texas Covid-19 Pandemic, Incident Period: January 20, 2020, FEMA Id: 4485, Natural disaster type: Other
- Texas Hurricane Harvey, Incident Period: August 23, 2017 - September 15, 2017, FEMA Id: 4332, Natural disaster type: Hurricane
- Texas Severe Storms, Tornadoes, and Flooding, Incident Period: March 07, 2016 to March 29, 2016, Major Disaster (Presidential) Declared DR-4266: March 19, 2016, FEMA Id: 4266, Natural disaster type: Storm, Tornado, Flood
- Texas Severe Storms, Tornadoes, Straight-line Winds, and Flooding, Incident Period: May 04, 2015 to June 23, 2015, Major Disaster (Presidential) Declared DR-4223: May 29, 2015, FEMA Id: 4223, Natural disaster type: Storm, Tornado, Flood, Wind
- Texas Hurricane Ike, Incident Period: September 07, 2008 to October 02, 2008, Major Disaster (Presidential) Declared DR-1791: September 13, 2008, FEMA Id: 1791, Natural disaster type: Hurricane
- Texas Hurricane Ike, Incident Period: September 07, 2008 to September 26, 2008, Emergency Declared EM-3294: September 10, 2008, FEMA Id: 3294, Natural disaster type: Hurricane
- Texas Hurricane Gustav, Incident Period: August 27, 2008 to September 07, 2008, Emergency Declared EM-3290: August 29, 2008, FEMA Id: 3290, Natural disaster type: Hurricane
- Texas Wildfires, Incident Period: March 14, 2008 to September 01, 2008, Emergency Declared EM-3284: March 14, 2008, FEMA Id: 3284, Natural disaster type: Fire
- Texas Hurricane Rita, Incident Period: September 23, 2005 to October 14, 2005, Major Disaster (Presidential) Declared DR-1606: September 24, 2005, FEMA Id: 1606, Natural disaster type: Hurricane
- Texas Hurricane Rita, Incident Period: September 20, 2005 to October 14, 2005, Emergency Declared EM-3261: September 21, 2005, FEMA Id: 3261, Natural disaster type: Hurricane
- 7 other natural disasters have been reported since 1953.
The number of natural disasters in Sabine County (17) is near the US average (15).
Major Disasters (Presidential) Declared: 7
Emergencies Declared: 8
Causes of natural disasters: Hurricanes: 7, Floods: 5, Storms: 5, Fires: 3, Tornadoes: 3, Wind: 1, Other: 2 (Note: some incidents may be assigned to more than one category).
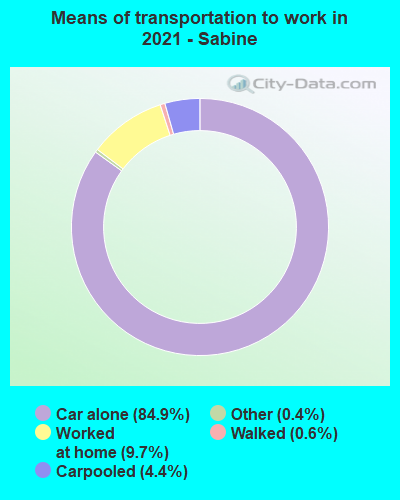
Means of transportation to work:
- Drove a car alone: 1,995 (77.7%)
- Carpooled: 170 (6.6%)
- Taxicab, motorcycle, or other means: 19 (0.7%)
- Walked: 86 (3.4%)
- Worked at home: 256 (10.0%)
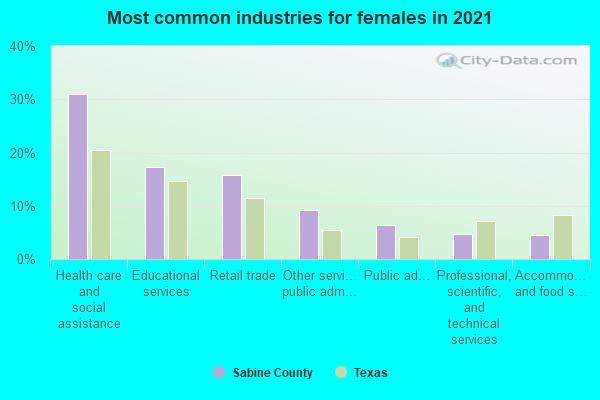
- Health care and social assistance (31%)
- Retail trade (20%)
- Educational services (17%)
- Other services, except public administration (6%)
- Public administration (5%)
- Professional, scientific, and technical services (3%)
- Transportation and warehousing (3%)
- Health care and social assistance (31%)
- Retail trade (20%)
- Educational services (17%)
- Other services, except public administration (6%)
- Public administration (5%)
- Professional, scientific, and technical services (3%)
- Transportation and warehousing (3%)
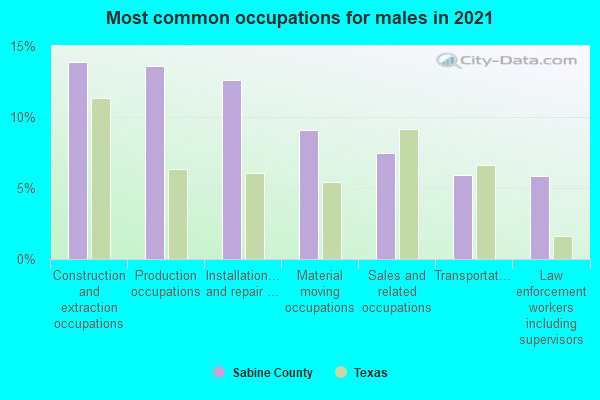
- Construction and extraction occupations (16%)
- Production occupations (15%)
- Installation, maintenance, and repair occupations (9%)
- Transportation occupations (7%)
- Sales and related occupations (6%)
- Building and grounds cleaning and maintenance occupations (5%)
- Health diagnosing and treating practitioners and other technical occupations (5%)

- Office and administrative support occupations (20%)
- Sales and related occupations (15%)
- Educational instruction, and library occupations (13%)
- Healthcare support occupations (12%)
- Health diagnosing and treating practitioners and other technical occupations (8%)
- Food preparation and serving related occupations (5%)
- Personal care and service occupations (5%)
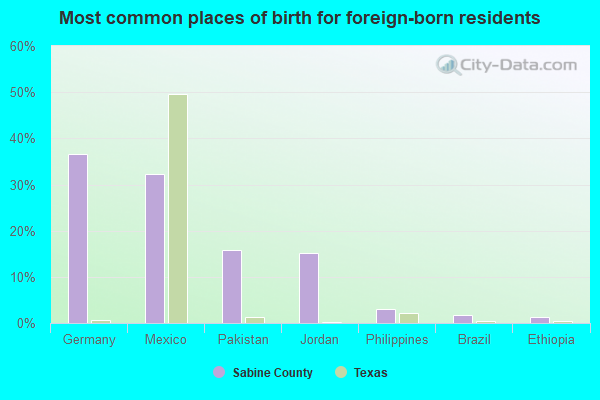
- Mexico (41%)
- Pakistan (18%)
- Germany (17%)
- Jordan (12%)
- Philippines (4%)
- Brazil (2%)
- China, excluding Hong Kong and Taiwan (2%)
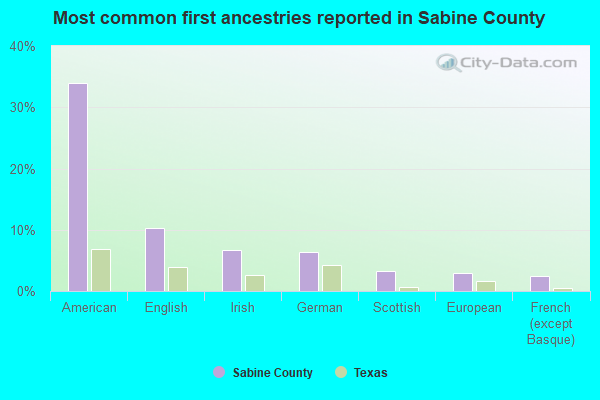
- American (39%)
- English (10%)
- Irish (5%)
- German (4%)
- French (except Basque) (3%)
- European (2%)
- French Canadian (2%)

6 people in residential treatment centers for adults
People in group quarters in Sabine County, Texas in 2000:
- 111 people in nursing homes
- 7 people in local jails and other confinement facilities (including police lockups)
- 6 people in homes for the mentally retarded
10.14% of this county's 2021 resident taxpayers lived in other counties in 2020 ($66,507 average adjusted gross income)
| Here: | 10.14% |
| Texas average: | 8.12% |
10 or fewer of this county's residents moved from foreign countries.
7.79% relocated from other counties in Texas ($52,375 average AGI)
2.35% relocated from other states ($14,132 average AGI)
Sabine County: 2.35% Texas average: 2.83%
Top counties from which taxpayers relocated into this county between 2020 and 2021:
| from Harris County, TX | |
| from Jefferson County, TX | |
| from Jasper County, TX | |
| from Angelina County, TX | |
| from Orange County, TX |
7.61% of this county's 2020 resident taxpayers moved to other counties in 2021 ($56,775 average adjusted gross income)
| Here: | 7.61% |
| Texas average: | 7.40% |
10 or fewer of this county's residents moved to foreign countries.
6.07% relocated to other counties in Texas ($45,465 average AGI)
1.55% relocated to other states ($11,310 average AGI)
Sabine County: 1.55% Texas average: 2.08%
Top counties to which taxpayers relocated from this county between 2020 and 2021:
| to Jasper County, TX | |
| to Angelina County, TX |
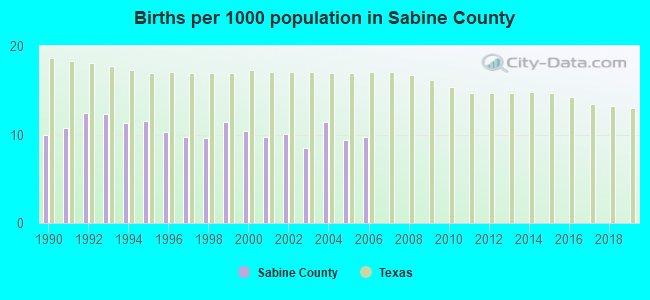
Births per 1000 population from 1990 to 1999: 10.9
Births per 1000 population from 2000 to 2006: 9.9
Deaths per 1000 population from 1990 to 1999: 15.3
Deaths per 1000 population from 2000 to 2009: 15.6
Deaths per 1000 population from 2010 to 2020: 16.6

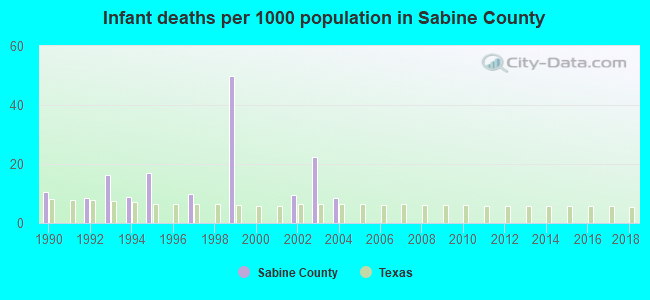
Infant deaths per 1000 live births from 1990 to 1999: 12.1
Infant deaths per 1000 live births from 2000 to 2006: 5.8
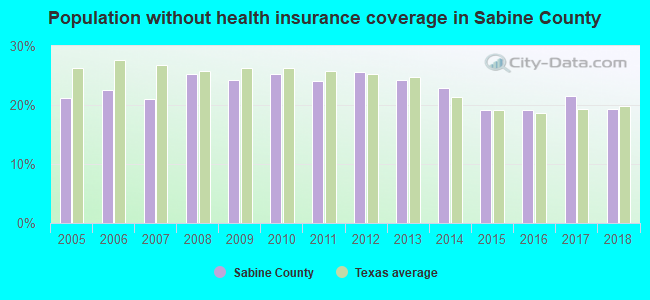
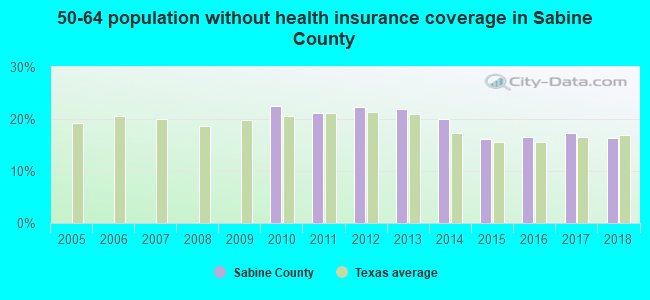
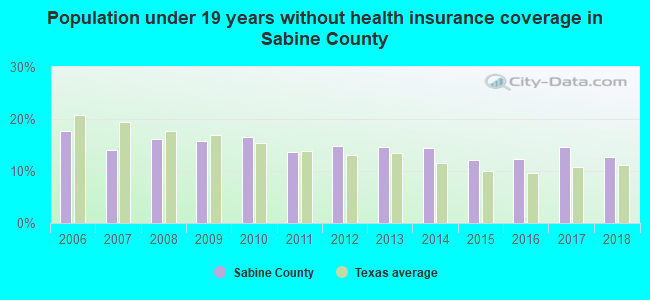
Persons under 19 years old without health insurance coverage in 2018: 12.7%
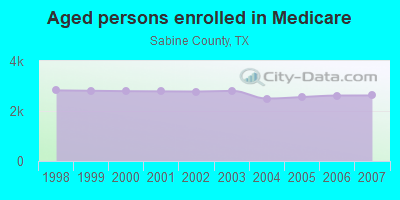
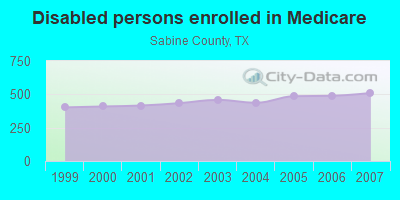
Persons enrolled in hospital insurance and/or supplemental medical insurance (Medicare) in July 1, 2007: 3,131 (2,621 aged, 510 disabled)
Children under 18 without health insurance coverage in 2007: 277 (13%)

Most common underlying causes of death in Sabine County, Texas in 1999 - 2019:
- Acute myocardial infarction, unspecified (498)
- Bronchus or lung, unspecified - Malignant neoplasms (173)
- Chronic obstructive pulmonary disease, unspecified (110)
- Stroke, not specified as haemorrhage or infarction (90)
- Atherosclerotic heart disease (75)
- Alzheimer disease, unspecified (46)
- Congestive heart failure (23)
- Unspecified diabetes mellitus, without complications (11)
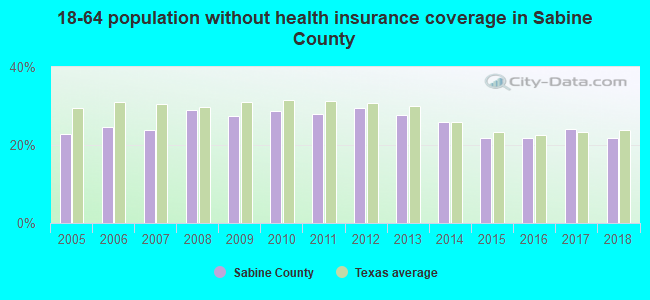
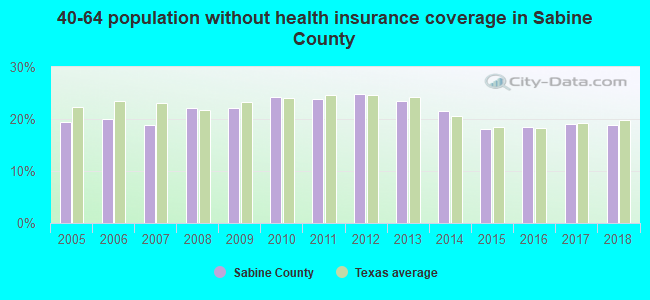
Population without health insurance coverage in 2000: 16%
Children under 18 without health insurance coverage in 2000: 14%
Short term general hospital admissions per 100,000 population in 2004: 3,296
Short term general hospital beds per 100,000 population in 2004: 279
Emergency room visits per 100,000 population in 2004: 26,655
General practice office based MDs per 100,000 population in 2005: 1,075
Medical specialist MDs per 100,000 population in 2005: 1,507
Dentists per 100,000 population in 1998: 10
Total births per 100,000 population, July 2005 - July 2006 : 28
Total deaths per 100,000 population, July 2005 - July 2006: 19
Limited-service eating places per 100,000 population in 2005 : 10
Household type by relationship:
Households: 10,248- Male householders: 2,362 (667 living alone), Female householders: 2,363 (766 living alone)
2,528 spouses (2,522 opposite-sex spouses), 203 unmarried partners, (159 opposite-sex unmarried partners), 2,130 children (1,877 natural, 81 adopted, 172 stepchildren), 220 grandchildren, 34 brothers or sisters, 109 parents, 8 foster children, 205 other relatives, 64 non-relatives
- In group quarters: 110
Size of family households: 2,028 2-persons, 588 3-persons, 357 4-persons, 147 5-persons, 41 6-persons, 17 7-or-more-persons.
Size of nonfamily households: 1,433 1-person, 125 2-persons, 4 3-persons, 9 4-persons.
1,035 married couples with children.
504 single-parent households (188 men, 316 women).
96.8% of residents of Sabine speak English at home.
2.5% of residents speak Spanish at home (98% speak English very well, 1% speak English well, 1% don't speak English at all).
0.2% of residents speak other Indo-European language at home (44% speak English very well, 56% speak English well).
0.8% of residents speak Asian or Pacific Island language at home (100% speak English very well).
0.3% of residents speak other language at home (71% speak English very well, 29% speak English well).
In fiscal year 2004:
Federal Government expenditure: $98,578,000 ($9,472 per capita)
Department of Defense expenditure: $2,789,000
Federal direct payments to individuals for retirement and disability: $50,279,000
Federal other direct payments to individuals: $26,068,000
Federal direct payments not to individuals: $193,000
Federal grants: $18,949,000
Federal procurement contracts: $439,000 ($0,000 Department of Defense)
Federal salaries and wages: $2,651,000 ($0,000 Department of Defense)
Federal Government direct loans: $83,000
Federal guaranteed/insured loans: $1,539,000
Federal Government insurance: $848,000
Population change from April 1, 2000 to July 1, 2005:
Births: 509| Here: | 49 per 1000 residents |
| State: | 85 per 1000 residents |
Deaths: 853
| Here: | 82 per 1000 residents |
| State: | 35 per 1000 residents |
Net international migration: +14
| Here: | +1 per 1000 residents |
| State: | +29 per 1000 residents |
Net internal migration: +306
| Here: | +29 per 1000 residents |
| State: | +10 per 1000 residents |
Total withdrawal of fresh water for public supply: 1.97 millions of gallons per day (14% from ground, 86% from surface)
| Here: | 5.6 |
| State: | 6.3 |
| Here: | 4.6 |
| State: | 4.0 |
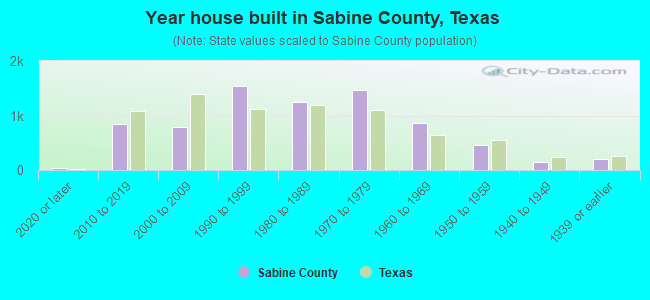
- Year house built in Sabine County, Texas
- 652020 or later
- 7472010 to 2019
- 1,0192000 to 2009
- 1,6271990 to 1999
- 1,1651980 to 1989
- 1,5101970 to 1979
- 6481960 to 1969
- 4621950 to 1959
- 801940 to 1949
- 1961939 or earlier
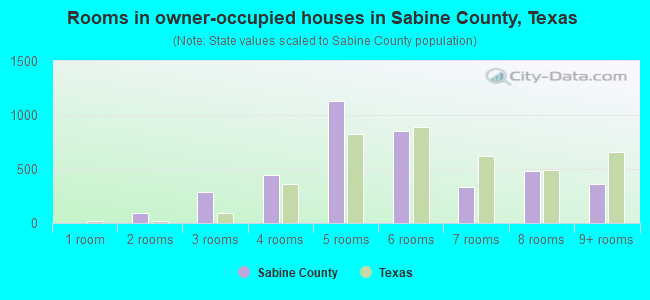
- Rooms in owner-occupied houses in Sabine County, Texas
- 01 room
- 1092 rooms
- 2363 rooms
- 5574 rooms
- 1,0515 rooms
- 9286 rooms
- 3947 rooms
- 4418 rooms
- 3229+ rooms
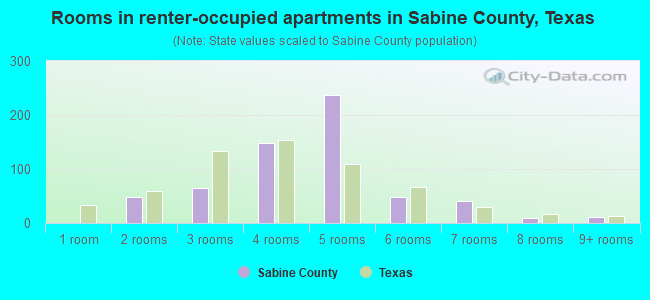
- Rooms in renter-occupied apartments in Sabine County, Texas
- 01 room
- 192 rooms
- 1083 rooms
- 1664 rooms
- 2295 rooms
- 1086 rooms
- 187 rooms
- 338 rooms
- 149+ rooms
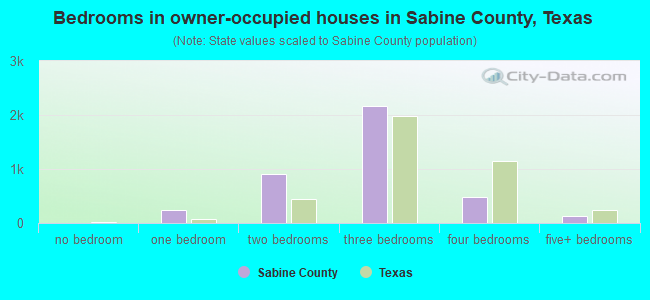
- Bedrooms in owner-occupied houses in Sabine County, Texas
- 0no bedroom
- 2131 bedroom
- 9822 bedrooms
- 2,3403 bedrooms
- 3214 bedrooms
- 1315+ bedrooms
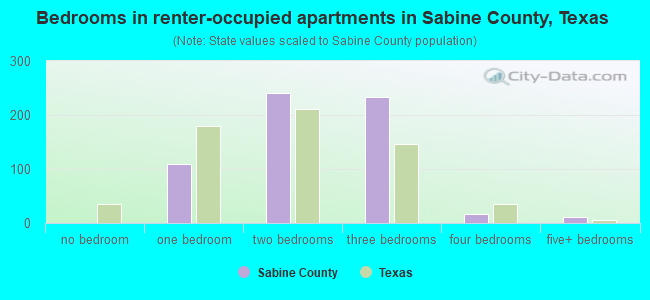
- Bedrooms in renter-occupied apartments in Sabine County, Texas
- 0no bedroom
- 851 bedroom
- 2852 bedrooms
- 2973 bedrooms
- 204 bedrooms
- 145+ bedrooms

- Cars and other vehicles available in Sabine County in owner-occupied houses/condos
- 139no vehicle
- 1,1961 vehicle
- 1,7982 vehicles
- 7603 vehicles
- 1054 vehicles
- 305+ vehicles

- Cars and other vehicles available in Sabine County in renter-occupied apartments
- 81no vehicle
- 3521 vehicle
- 2202 vehicles
- 573 vehicles
- 04 vehicles
- 45+ vehicles
84.5% of Sabine County residents lived in the same house 1 years ago.
Out of people who lived in different houses, 28% lived in this county.
Out of people who lived in different counties, 49% lived in Texas.
| Sabine County: | 84.5% |
| State average: | 85.7% |
Place of birth for U.S.-born residents:
- This state: 6,864
- Other state: 3,123
- Northeast: 290
- Midwest: 616
- South: 1,691
- West: 507
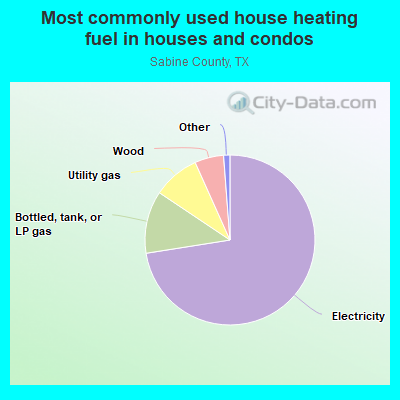
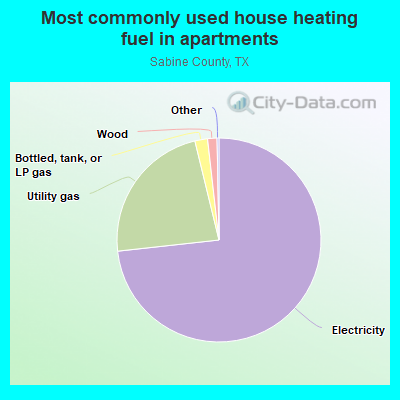
- 75.0%Electricity
- 11.3%Bottled, tank, or LP gas
- 7.2%Utility gas
- 5.4%Wood
- 0.6%Other fuel
- 0.4%No fuel used
- 73.6%Electricity
- 20.6%Utility gas
- 3.5%Wood
- 2.2%Bottled, tank, or LP gas
Private vs. public school enrollment:
| Here: | 1.5% |
| Texas: | 8.8% |
| Here: | 7.5% |
| Texas: | 8.0% |
| Here: | 18.9% |
| Texas: | 16.2% |
Sabine County government finances - Expenditure in 2017:
- Bond Funds - Cash and Securities: $54,000
Cash and Securities: $50,000
- Charges - Other: $425,000
Other: $407,000
Regular Highways: $9,000
Regular Highways: $9,000
- Construction - Regular Highways: $242,000
Regular Highways: $229,000
General - Other: $83,000
General - Other: $78,000
Judicial and Legal Services: $4,000
Judicial and Legal Services: $4,000
- Current Operations - Correctional Institutions: $874,000
Correctional Institutions: $790,000
Judicial and Legal Services: $717,000
Judicial and Legal Services: $649,000
Corrections - Other: $586,000
Corrections - Other: $530,000
Police Protection: $525,000
Police Protection: $475,000
General - Other: $385,000
Regular Highways: $380,000
General - Other: $348,000
Regular Highways: $343,000
Financial Administration: $152,000
Financial Administration: $138,000
General Public Buildings: $80,000
General Public Buildings: $73,000
Local Fire Protection: $38,000
Central Staff Services: $36,000
Local Fire Protection: $34,000
Central Staff Services: $33,000
Public Welfare, Vendor Payments for Medical Care: $30,000
Public Welfare, Vendor Payments for Medical Care: $27,000
Public Welfare - Other: $26,000
Public Welfare - Other: $24,000
Natural Resources - Other: $11,000
Natural Resources - Other: $10,000
Solid Waste Management: $10,000
Solid Waste Management: $9,000
- Federal Intergovernmental - Other: $26,000
Other: $26,000
- General - Interest on Debt: $45,000
Interest on Debt: $45,000
- Local Intergovernmental - Other: $46,000
Other: $46,000
- Long Term Debt - Beginning Outstanding - Unspecified Public Purpose: $1,236,000
Outstanding Unspecified Public Purpose: $1,078,000
Beginning Outstanding - Unspecified Public Purpose: $920,000
Outstanding Unspecified Public Purpose: $762,000
Retired Unspecified Public Purpose: $158,000
Retired Unspecified Public Purpose: $158,000
- Miscellaneous - General Revenue - Other: $172,000
General Revenue - Other: $141,000
Fines and Forfeits: $75,000
Fines and Forfeits: $62,000
Interest Earnings: $15,000
Interest Earnings: $12,000
Rents: $4,000
Rents: $3,000
Sale of Property: $2,000
Sale of Property: $2,000
Donations From Private Sources: $1,000
Donations From Private Sources: $1,000
- Other Capital Outlay - General - Other: $64,000
General - Other: $52,000
Corrections - Other: $25,000
Corrections - Other: $20,000
Correctional Institutions: $11,000
Correctional Institutions: $9,000
Judicial and Legal Services: $4,000
Judicial and Legal Services: $3,000
Central Staff Services: $1,000
Police Protection: $1,000
Police Protection: $1,000
Central Staff Services: $1,000
- Other Funds - Cash and Securities: $2,395,000
Cash and Securities: $2,221,000
- Sinking Funds - Cash and Securities: $74,000
Cash and Securities: $69,000
- State Intergovernmental - Other: $161,000
Other: $102,000
General Local Government Support: $25,000
General Local Government Support: $16,000
Highways: $5,000
Highways: $3,000
- Tax - Property: $2,773,000
Property: $2,422,000
General Sales and Gross Receipts: $884,000
General Sales and Gross Receipts: $772,000
Motor Vehicle License: $175,000
Motor Vehicle License: $153,000
Other Selective Sales: $107,000
Other Selective Sales: $93,000
Amusements Sales: $4,000
Amusements Sales: $4,000
Sabine County government finances - Revenue in 2017:
- Bond Funds - Cash and Securities: $54,000
Cash and Securities: $50,000
- Charges - Other: $425,000
Other: $407,000
Regular Highways: $9,000
Regular Highways: $9,000
- Construction - Regular Highways: $242,000
Regular Highways: $229,000
General - Other: $83,000
General - Other: $78,000
Judicial and Legal Services: $4,000
Judicial and Legal Services: $4,000
- Current Operations - Correctional Institutions: $874,000
Correctional Institutions: $790,000
Judicial and Legal Services: $717,000
Judicial and Legal Services: $649,000
Corrections - Other: $586,000
Corrections - Other: $530,000
Police Protection: $525,000
Police Protection: $475,000
General - Other: $385,000
Regular Highways: $380,000
General - Other: $348,000
Regular Highways: $343,000
Financial Administration: $152,000
Financial Administration: $138,000
General Public Buildings: $80,000
General Public Buildings: $73,000
Local Fire Protection: $38,000
Central Staff Services: $36,000
Local Fire Protection: $34,000
Central Staff Services: $33,000
Public Welfare, Vendor Payments for Medical Care: $30,000
Public Welfare, Vendor Payments for Medical Care: $27,000
Public Welfare - Other: $26,000
Public Welfare - Other: $24,000
Natural Resources - Other: $11,000
Natural Resources - Other: $10,000
Solid Waste Management: $10,000
Solid Waste Management: $9,000
- Federal Intergovernmental - Other: $26,000
Other: $26,000
- General - Interest on Debt: $45,000
Interest on Debt: $45,000
- Local Intergovernmental - Other: $46,000
Other: $46,000
- Long Term Debt - Beginning Outstanding - Unspecified Public Purpose: $1,236,000
Outstanding Unspecified Public Purpose: $1,078,000
Beginning Outstanding - Unspecified Public Purpose: $920,000
Outstanding Unspecified Public Purpose: $762,000
Retired Unspecified Public Purpose: $158,000
Retired Unspecified Public Purpose: $158,000
- Miscellaneous - General Revenue - Other: $172,000
General Revenue - Other: $141,000
Fines and Forfeits: $75,000
Fines and Forfeits: $62,000
Interest Earnings: $15,000
Interest Earnings: $12,000
Rents: $4,000
Rents: $3,000
Sale of Property: $2,000
Sale of Property: $2,000
Donations From Private Sources: $1,000
Donations From Private Sources: $1,000
- Other Capital Outlay - General - Other: $64,000
General - Other: $52,000
Corrections - Other: $25,000
Corrections - Other: $20,000
Correctional Institutions: $11,000
Correctional Institutions: $9,000
Judicial and Legal Services: $4,000
Judicial and Legal Services: $3,000
Central Staff Services: $1,000
Police Protection: $1,000
Police Protection: $1,000
Central Staff Services: $1,000
- Other Funds - Cash and Securities: $2,395,000
Cash and Securities: $2,221,000
- Sinking Funds - Cash and Securities: $74,000
Cash and Securities: $69,000
- State Intergovernmental - Other: $161,000
Other: $102,000
General Local Government Support: $25,000
General Local Government Support: $16,000
Highways: $5,000
Highways: $3,000
- Tax - Property: $2,773,000
Property: $2,422,000
General Sales and Gross Receipts: $884,000
General Sales and Gross Receipts: $772,000
Motor Vehicle License: $175,000
Motor Vehicle License: $153,000
Other Selective Sales: $107,000
Other Selective Sales: $93,000
Amusements Sales: $4,000
Amusements Sales: $4,000
Sabine County government finances - Debt in 2017:
- Bond Funds - Cash and Securities: $54,000
Cash and Securities: $50,000
- Charges - Other: $425,000
Other: $407,000
Regular Highways: $9,000
Regular Highways: $9,000
- Construction - Regular Highways: $242,000
Regular Highways: $229,000
General - Other: $83,000
General - Other: $78,000
Judicial and Legal Services: $4,000
Judicial and Legal Services: $4,000
- Current Operations - Correctional Institutions: $874,000
Correctional Institutions: $790,000
Judicial and Legal Services: $717,000
Judicial and Legal Services: $649,000
Corrections - Other: $586,000
Corrections - Other: $530,000
Police Protection: $525,000
Police Protection: $475,000
General - Other: $385,000
Regular Highways: $380,000
General - Other: $348,000
Regular Highways: $343,000
Financial Administration: $152,000
Financial Administration: $138,000
General Public Buildings: $80,000
General Public Buildings: $73,000
Local Fire Protection: $38,000
Central Staff Services: $36,000
Local Fire Protection: $34,000
Central Staff Services: $33,000
Public Welfare, Vendor Payments for Medical Care: $30,000
Public Welfare, Vendor Payments for Medical Care: $27,000
Public Welfare - Other: $26,000
Public Welfare - Other: $24,000
Natural Resources - Other: $11,000
Natural Resources - Other: $10,000
Solid Waste Management: $10,000
Solid Waste Management: $9,000
- Federal Intergovernmental - Other: $26,000
Other: $26,000
- General - Interest on Debt: $45,000
Interest on Debt: $45,000
- Local Intergovernmental - Other: $46,000
Other: $46,000
- Long Term Debt - Beginning Outstanding - Unspecified Public Purpose: $1,236,000
Outstanding Unspecified Public Purpose: $1,078,000
Beginning Outstanding - Unspecified Public Purpose: $920,000
Outstanding Unspecified Public Purpose: $762,000
Retired Unspecified Public Purpose: $158,000
Retired Unspecified Public Purpose: $158,000
- Miscellaneous - General Revenue - Other: $172,000
General Revenue - Other: $141,000
Fines and Forfeits: $75,000
Fines and Forfeits: $62,000
Interest Earnings: $15,000
Interest Earnings: $12,000
Rents: $4,000
Rents: $3,000
Sale of Property: $2,000
Sale of Property: $2,000
Donations From Private Sources: $1,000
Donations From Private Sources: $1,000
- Other Capital Outlay - General - Other: $64,000
General - Other: $52,000
Corrections - Other: $25,000
Corrections - Other: $20,000
Correctional Institutions: $11,000
Correctional Institutions: $9,000
Judicial and Legal Services: $4,000
Judicial and Legal Services: $3,000
Central Staff Services: $1,000
Police Protection: $1,000
Police Protection: $1,000
Central Staff Services: $1,000
- Other Funds - Cash and Securities: $2,395,000
Cash and Securities: $2,221,000
- Sinking Funds - Cash and Securities: $74,000
Cash and Securities: $69,000
- State Intergovernmental - Other: $161,000
Other: $102,000
General Local Government Support: $25,000
General Local Government Support: $16,000
Highways: $5,000
Highways: $3,000
- Tax - Property: $2,773,000
Property: $2,422,000
General Sales and Gross Receipts: $884,000
General Sales and Gross Receipts: $772,000
Motor Vehicle License: $175,000
Motor Vehicle License: $153,000
Other Selective Sales: $107,000
Other Selective Sales: $93,000
Amusements Sales: $4,000
Amusements Sales: $4,000
Sabine County government finances - Cash and Securities in 2017:
- Bond Funds - Cash and Securities: $54,000
Cash and Securities: $50,000
- Charges - Other: $425,000
Other: $407,000
Regular Highways: $9,000
Regular Highways: $9,000
- Construction - Regular Highways: $242,000
Regular Highways: $229,000
General - Other: $83,000
General - Other: $78,000
Judicial and Legal Services: $4,000
Judicial and Legal Services: $4,000
- Current Operations - Correctional Institutions: $874,000
Correctional Institutions: $790,000
Judicial and Legal Services: $717,000
Judicial and Legal Services: $649,000
Corrections - Other: $586,000
Corrections - Other: $530,000
Police Protection: $525,000
Police Protection: $475,000
General - Other: $385,000
Regular Highways: $380,000
General - Other: $348,000
Regular Highways: $343,000
Financial Administration: $152,000
Financial Administration: $138,000
General Public Buildings: $80,000
General Public Buildings: $73,000
Local Fire Protection: $38,000
Central Staff Services: $36,000
Local Fire Protection: $34,000
Central Staff Services: $33,000
Public Welfare, Vendor Payments for Medical Care: $30,000
Public Welfare, Vendor Payments for Medical Care: $27,000
Public Welfare - Other: $26,000
Public Welfare - Other: $24,000
Natural Resources - Other: $11,000
Natural Resources - Other: $10,000
Solid Waste Management: $10,000
Solid Waste Management: $9,000
- Federal Intergovernmental - Other: $26,000
Other: $26,000
- General - Interest on Debt: $45,000
Interest on Debt: $45,000
- Local Intergovernmental - Other: $46,000
Other: $46,000
- Long Term Debt - Beginning Outstanding - Unspecified Public Purpose: $1,236,000
Outstanding Unspecified Public Purpose: $1,078,000
Beginning Outstanding - Unspecified Public Purpose: $920,000
Outstanding Unspecified Public Purpose: $762,000
Retired Unspecified Public Purpose: $158,000
Retired Unspecified Public Purpose: $158,000
- Miscellaneous - General Revenue - Other: $172,000
General Revenue - Other: $141,000
Fines and Forfeits: $75,000
Fines and Forfeits: $62,000
Interest Earnings: $15,000
Interest Earnings: $12,000
Rents: $4,000
Rents: $3,000
Sale of Property: $2,000
Sale of Property: $2,000
Donations From Private Sources: $1,000
Donations From Private Sources: $1,000
- Other Capital Outlay - General - Other: $64,000
General - Other: $52,000
Corrections - Other: $25,000
Corrections - Other: $20,000
Correctional Institutions: $11,000
Correctional Institutions: $9,000
Judicial and Legal Services: $4,000
Judicial and Legal Services: $3,000
Central Staff Services: $1,000
Police Protection: $1,000
Police Protection: $1,000
Central Staff Services: $1,000
- Other Funds - Cash and Securities: $2,395,000
Cash and Securities: $2,221,000
- Sinking Funds - Cash and Securities: $74,000
Cash and Securities: $69,000
- State Intergovernmental - Other: $161,000
Other: $102,000
General Local Government Support: $25,000
General Local Government Support: $16,000
Highways: $5,000
Highways: $3,000
- Tax - Property: $2,773,000
Property: $2,422,000
General Sales and Gross Receipts: $884,000
General Sales and Gross Receipts: $772,000
Motor Vehicle License: $175,000
Motor Vehicle License: $153,000
Other Selective Sales: $107,000
Other Selective Sales: $93,000
Amusements Sales: $4,000
Amusements Sales: $4,000
Supplemental Security Income (SSI) in 2006:
- Total number of recipients: 370
- Number of aged recipients: 49
- Number of blind and disabled recipients: 321
- Number of recipients under 18: 48
- Number of recipients between 18 and 64: 236
- Number of recipients older than 64: 86
- Number of recipients also receiving OASDI: 156
- Amount of payments (thousands of dollars): 171
| Most common first names in Sabine County, TX among deceased individuals | ||
| Name | Count | Lived (average) |
|---|---|---|
| James | 95 | 72.3 years |
| William | 93 | 78.0 years |
| John | 93 | 77.4 years |
| Mary | 59 | 77.9 years |
| Robert | 57 | 75.0 years |
| George | 40 | 72.1 years |
| Charles | 38 | 71.2 years |
| Thomas | 29 | 75.2 years |
| Willie | 29 | 78.8 years |
| Joseph | 28 | 77.2 years |
| Most common last names in Sabine County, TX among deceased individuals | ||
| Last name | Count | Lived (average) |
|---|---|---|
| Smith | 108 | 79.6 years |
| Williams | 52 | 74.2 years |
| Jones | 42 | 73.9 years |
| Clark | 34 | 75.3 years |
| Davis | 33 | 77.9 years |
| Brown | 29 | 73.1 years |
| White | 28 | 75.3 years |
| Wright | 27 | 81.8 years |
| Thomas | 27 | 72.0 years |
| Mcdaniel | 23 | 78.9 years |
| Businesses in Sabine County, TX | ||||
| Name | Count | Name | Count | |
|---|---|---|---|---|
| AT&T | 1 | H&R Block | 1 | |
| Ace Hardware | 1 | Lane Furniture | 1 | |
| Alco Stores | 1 | True Value | 1 | |
| Ashley Furniture | 1 | U-Haul | 3 | |
| Dairy Queen | 2 | UPS | 1 | |
| FedEx | 1 | |||
Sabine County on our top lists:
- #42 on the list of "Top 101 counties with the highest number of deaths per 1000 residents 2007-2013"