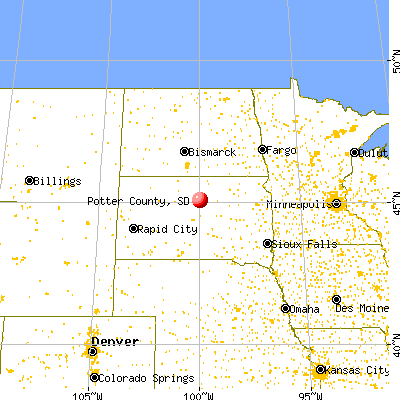
Potter County, South Dakota (SD)
County owner-occupied free and clear houses and condos in 2010: 585
County owner-occupied houses and condos in 2000: 906
Renter-occupied apartments: 186 (it was 239 in 2000)
| % of renters here: | 21% |
| State: | 32% |
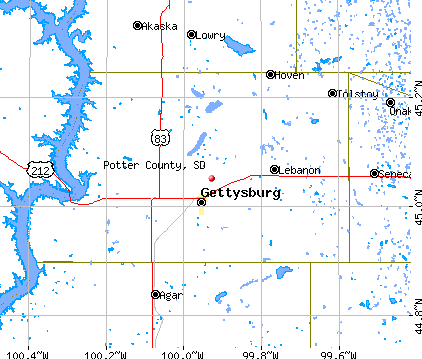
Land area: 866 sq. mi.
Water area: 31.9 sq. mi.
Population density: 3 people per square mile (very low).
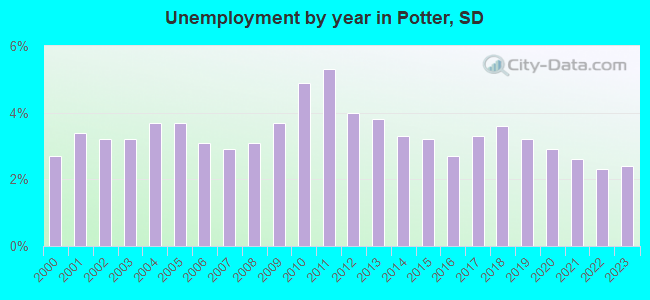
Industries providing employment: Agriculture,forestry,fishing and hunting, and mining (30.8%), Retail trade (15.7%), Educational, health and social services (15.1%).
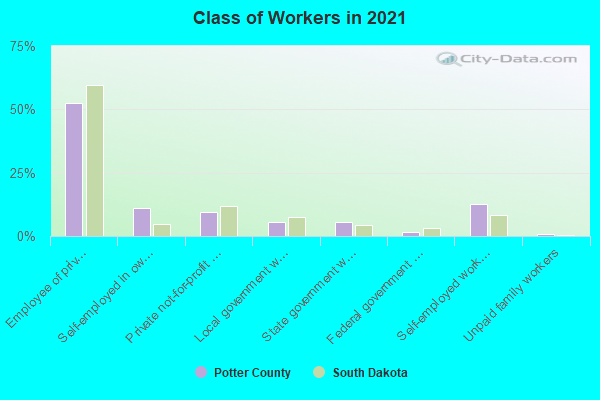
Type of workers:
- Private wage or salary: 74%
- Government: 12%
- Self-employed, not incorporated: 14%
- Unpaid family work: 0%
- OSM Map
- General Map
- Google Map
- MSN Map

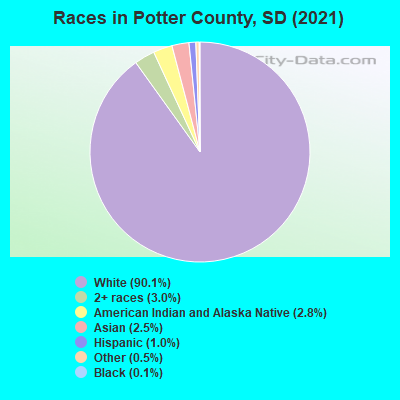
- 2,40690.5%White Non-Hispanic Alone
- 1395.2%Two or more races
- 371.4%Some other race alone
- 361.4%Black Non-Hispanic Alone
- 210.8%Asian alone
- 190.7%American Indian and Alaska Native alone
| Median resident age: | 45.9 years |
| South Dakota median age: | 38.5 years |
| Males: 1,293 | |
| Females: 1,350 |

| Potter County: | 2.0 people |
| South Dakota: | 2 people |
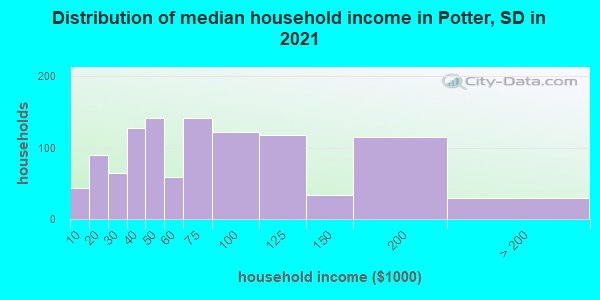
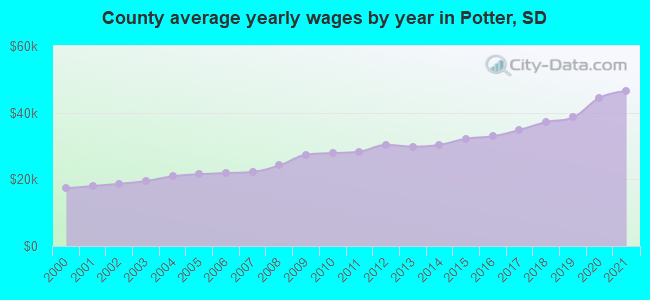
Estimated median household income in 2022: $72,066 ($30,086 in 1999)
| This county: | $72,066 |
| South Dakota: | $69,728 |
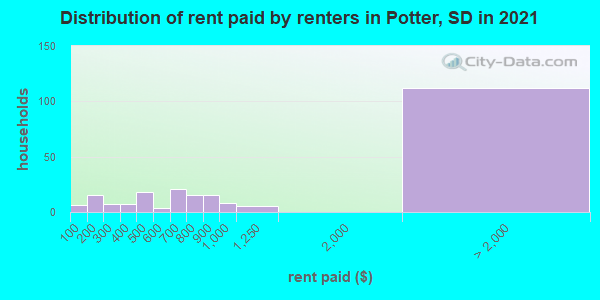
Median contract rent in 2022 for apartments: $612 (lower quartile is $338, upper quartile is $843)
| This county: | $612 |
| State: | $747 |
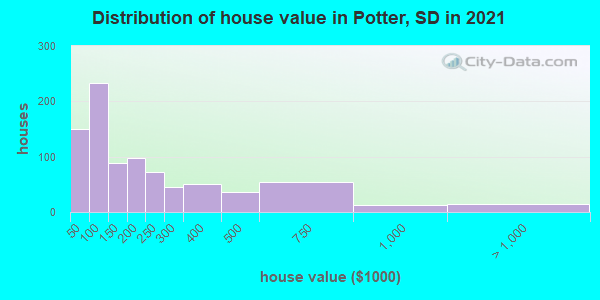
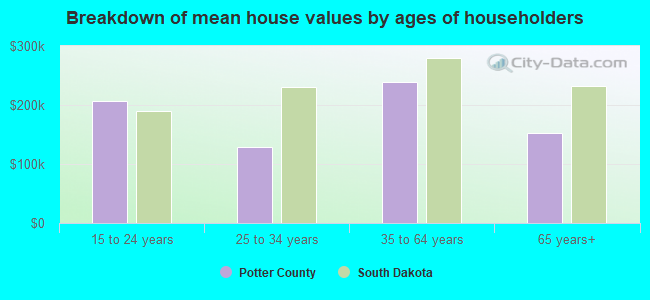
Estimated median house or condo value in 2022: $144,879 (it was $43,500 in 2000)
| Potter: | $144,879 |
| South Dakota: | $245,000 |
Median monthly housing costs for homes and condos with a mortgage: $1,258
Median monthly housing costs for units without a mortgage: $497
Institutionalized population: 63
Crime in 2021 (reported by the sheriff's office or county police, not the county total):
- Murders: 0
- Rapes: 0
- Robberies: 0
- Assaults: 2
- Burglaries: 0
- Thefts: 0
- Auto thefts: 1
Crime in 2020 (reported by the sheriff's office or county police, not the county total):
- Murders: 0
- Rapes: 0
- Robberies: 0
- Assaults: 0
- Burglaries: 1
- Thefts: 2
- Auto thefts: 0
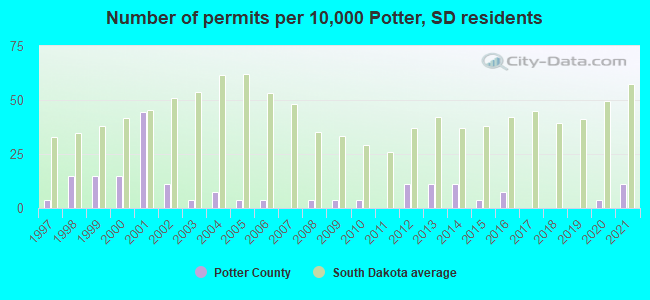
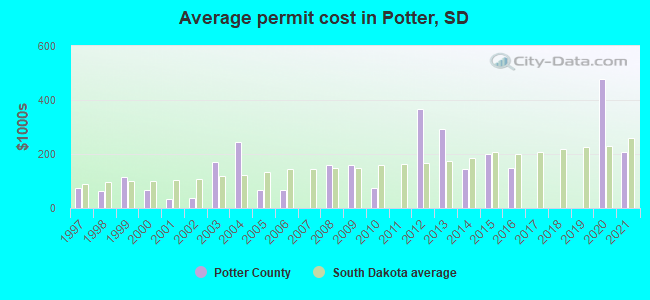
Single-family new house construction building permits:
- 2022: 1 building, cost: $273,300
- 2021: 3 buildings, average cost: $208,300
- 2020: 1 building, cost: $479,000
- 2019: 0 buildings
- 2018: 0 buildings
- 2017: 0 buildings
- 2016: 2 buildings, average cost: $150,000
- 2015: 1 building, cost: $200,000
- 2014: 3 buildings, average cost: $143,300
- 2013: 3 buildings, average cost: $293,300
- 2012: 3 buildings, average cost: $366,700
- 2011: 0 buildings
- 2010: 1 building, cost: $75,000
- 2009: 1 building, cost: $161,100
- 2008: 1 building, cost: $161,100
- 2007: 0 buildings
- 2006: 1 building, cost: $65,000
- 2005: 1 building, cost: $65,000
- 2004: 2 buildings, average cost: $245,000
- 2003: 1 building, cost: $170,000
- 2002: 3 buildings, average cost: $37,700
- 2001: 12 buildings, average cost: $33,800
- 2000: 4 buildings, average cost: $67,500
- 1999: 4 buildings, average cost: $115,000
- 1998: 4 buildings, average cost: $62,500
- 1997: 1 building, cost: $75,000
Median real estate property taxes paid for housing units with mortgages in 2022: $1,705 (0.8%)
Median real estate property taxes paid for housing units with no mortgage in 2022: $1,442 (1.2%)
| Potter County: | 7.1% |
| South Dakota: | 12.5% |
Median age of residents in 2022: 45.9 years old
(Males: 45.0 years old, Females: 47.2 years old)
(Median age for: White residents: 49.5 years old, Black residents: 64.6 years old, Asian residents: 56.7 years old, Other race residents: 4.3 years old)
Fair market rent in 2006 for a 1-bedroom apartment in Potter County is $379 a month.
Fair market rent for a 2-bedroom apartment is $484 a month.
Fair market rent for a 3-bedroom apartment is $648 a month.
Cities in this county include: Gettysburg, Hoven, Lebanon, Tolstoy.
Neighboring counties: Big Stone County, Minnesota  , Codington County , Door County, Wisconsin , Jefferson County, Oregon
  , McLeod County, Minnesota , Wright County, Minnesota , Yellow Medicine County, Minnesota .
| Here: | 2.2% |
| South Dakota: | 2.0% |
Current college students: 26
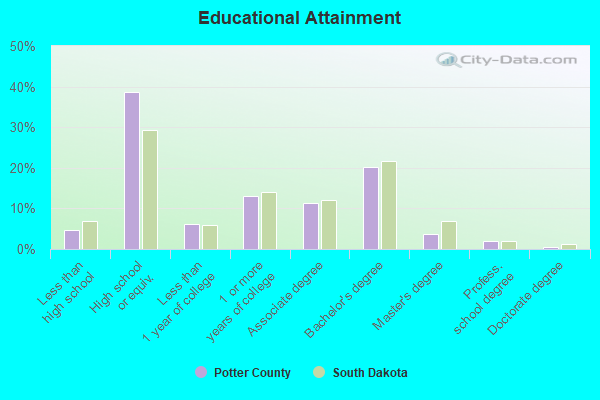
People 25 years of age or older with a high school degree or higher: 96.6%
People 25 years of age or older with a bachelor's degree or higher: 24.3%
Number of foreign born residents: 21 (103.1% naturalized citizens)
| Potter County: | 0.8% |
| Whole state: | 3.5% |
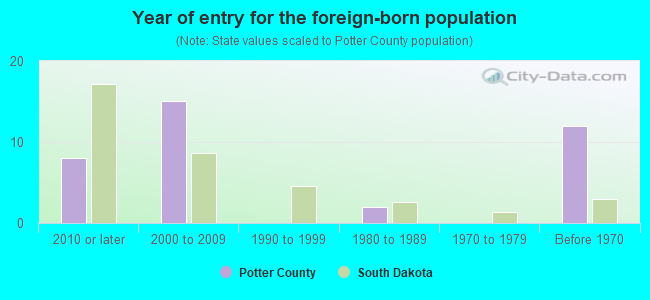
- Year of entry for the foreign-born population
- 52010 or later
- 52000 to 2009
- 01990 to 1999
- 21980 to 1989
- 01970 to 1979
- 12Before 1970
Mean travel time to work (commute): minutes
Percentage of county residents living and working in this county: 99.8%


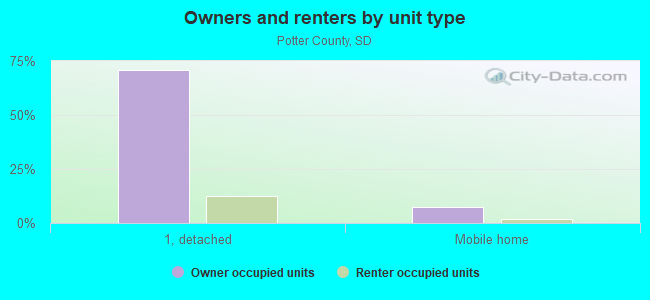
Housing units in structures:
- One, detached: 1,141
- One, attached: 4
- Two: 10
- 3 or 4: 25
- 5 to 9: 68
- Mobile homes: 340
Housing units in Potter County with a mortgage: 321 (17 second mortgage, 0 home equity loan, 18 both second mortgage and home equity loan)
Houses without a mortgage: 45
| Here: | 87.7% with mortgage |
| State: | 98.3% with mortgage |
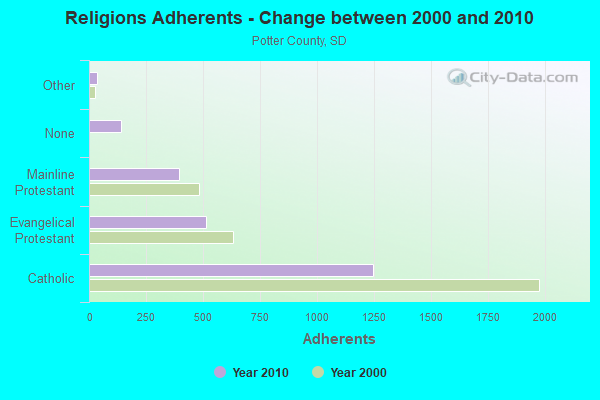
Religion statistics for Potter County
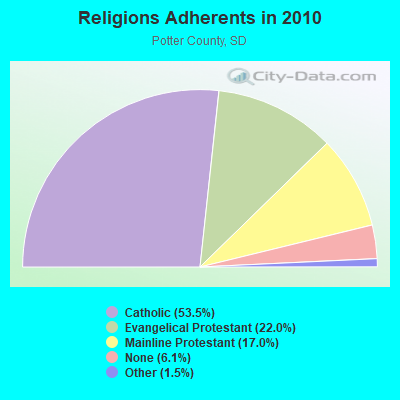
| Religion | Adherents | Congregations |
|---|---|---|
| Catholic | 1,245 | 2 |
| Evangelical Protestant | 512 | 6 |
| Mainline Protestant | 395 | 3 |
| Other | 35 | 1 |
| None | 142 | - |
Source: Clifford Grammich, Kirk Hadaway, Richard Houseal, Dale E.Jones, Alexei Krindatch, Richie Stanley and Richard H.Taylor. 2012. 2010 U.S.Religion Census: Religious Congregations & Membership Study. Association of Statisticians of American Religious Bodies. Jones, Dale E., et al. 2002. Congregations and Membership in the United States 2000. Nashville, TN: Glenmary Research Center.
Food Environment Statistics:
| Potter County: | 13.74 / 10,000 pop. |
| State: | 2.84 / 10,000 pop. |
| Potter County: | 18.32 / 10,000 pop. |
| South Dakota: | 6.68 / 10,000 pop. |
| This county: | 13.74 / 10,000 pop. |
| State: | 9.21 / 10,000 pop. |
| Potter County: | 9.5% |
| South Dakota: | 7.7% |
| Potter County: | 27.0% |
| State: | 27.7% |
Agriculture in Potter County:
Average size of farms: 1769 acresAverage value of agricultural products sold per farm: $113,718
Average value of crops sold per acre for harvested cropland: $100.98
The value of nursery, greenhouse, floriculture, and sod as a percentage of the total market value of agricultural products sold: 0.00%
The value of livestock, poultry, and their products as a percentage of the total market value of agricultural products sold: 42.62%
Average total farm production expenses per farm: $112,275
Harvested cropland as a percentage of land in farms: 36.52%
Average market value of all machinery and equipment per farm: $167,668
The percentage of farms operated by a family or individual: 77.73%
Average age of principal farm operators: 54 years
Average number of cattle and calves per 100 acres of all land in farms: 6.86
Corn for grain: 28737 harvested acres
All wheat for grain: 55088 harvested acres
Soybeans for beans: 22873 harvested acres
Earthquake activity:
Potter County-area historical earthquake activity is significantly above South Dakota state average. It is 56% greater than the overall U.S. average.On 8/18/1959 at 06:37:13, a magnitude 7.7 (7.7 UK, Class: Major, Intensity: VIII - XII) earthquake occurred 527.0 miles away from Potter County center, causing $26,000,000 total damage
On 3/4/1983 at 06:32:18, a magnitude 4.6 (4.4 MB, 4.6 LG, 4.4 ML, Class: Light, Intensity: IV - V) earthquake occurred 63.2 miles away from the county center
On 10/18/1984 at 15:30:23, a magnitude 5.5 (5.4 MB, 5.1 MS, 5.5 ML, Class: Moderate, Intensity: VI - VII) earthquake occurred 336.2 miles away from the county center
On 7/9/1975 at 14:54:15, a magnitude 4.6 (4.6 MB) earthquake occurred 193.8 miles away from the county center
On 9/8/1984 at 00:59:31, a magnitude 5.1 (5.1 MB) earthquake occurred 300.4 miles away from Potter County center
On 11/3/2002 at 20:41:56, a magnitude 4.3 (4.3 MB, Depth: 3.1 mi) earthquake occurred 166.0 miles away from the county center
Magnitude types: regional Lg-wave magnitude (LG), body-wave magnitude (MB), local magnitude (ML), surface-wave magnitude (MS)
Most recent natural disasters:
- South Dakota Covid-19 Pandemic, Incident Period: January 20, 2020, FEMA Id: 4527, Natural disaster type: Other
- South Dakota Severe Winter Storm, Snowstorm, And Flooding, Incident Period: March 13, 2019 - April 26, 2019, FEMA Id: 4440, Natural disaster type: Snowstorm, Winter Storm, Flood
- South Dakota Flooding, Incident Period: March 11, 2011 to July 22, 2011, Major Disaster (Presidential) Declared DR-1984: May 13, 2011, FEMA Id: 1984, Natural disaster type: Flood
- South Dakota Severe Winter Storm, Incident Period: January 20, 2010 to January 26, 2010, Major Disaster (Presidential) Declared DR-1887: March 10, 2010, FEMA Id: 1887, Natural disaster type: Winter Storm
- South Dakota Hurricane Katrina Evacuation, Incident Period: September 06, 2005 to October 01, 2005, Emergency Declared EM-3234: September 10, 2005, FEMA Id: 3234, Natural disaster type: Hurricane
- South Dakota Severe Storm, Incident Period: June 07, 2005 to June 08, 2005, Major Disaster (Presidential) Declared DR-1596: July 22, 2005, FEMA Id: 1596, Natural disaster type: Storm
- South Dakota Severe Storms/Flooding, Incident Period: February 03, 1997 to May 24, 1997, Major Disaster (Presidential) Declared DR-1173: April 07, 1997, FEMA Id: 1173, Natural disaster type: Storm, Flood
- South Dakota Severe Winter Storms/Blizzards, Incident Period: January 03, 1997 to January 31, 1997, Major Disaster (Presidential) Declared DR-1156: January 10, 1997, FEMA Id: 1156, Natural disaster type: Winter Storm, Blizzard
- South Dakota Severe Storms, Flooding, Incident Period: March 01, 1995 to June 20, 1995, Major Disaster (Presidential) Declared DR-1052: May 26, 1995, FEMA Id: 1052, Natural disaster type: Storm, Flood
- South Dakota Severe Winter Storms, Incident Period: January 13, 1995 to February 10, 1995, Major Disaster (Presidential) Declared DR-1045: March 14, 1995, FEMA Id: 1045, Natural disaster type: Winter Storm
- 3 other natural disasters have been reported since 1953.
The number of natural disasters in Potter County (13) is near the US average (15).
Major Disasters (Presidential) Declared: 9
Emergencies Declared: 2
Causes of natural disasters: Floods: 6, Storms: 5, Winter Storms: 4, Blizzard: 1, Drought: 1, Hurricane: 1, Snowstorm: 1, Other: 1 (Note: some incidents may be assigned to more than one category).
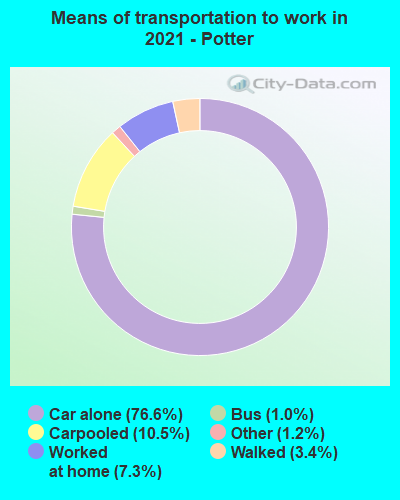
Means of transportation to work:
- Drove a car alone: 988 (73.4%)
- Carpooled: 167 (12.4%)
- Bus: 12 (0.9%)
- Taxicab, motorcycle, or other means: 17 (1.3%)
- Walked: 45 (3.3%)
- Worked at home: 100 (7.4%)
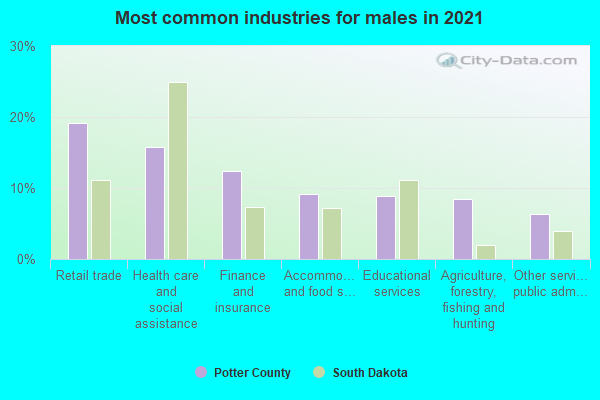
- Agriculture, forestry, fishing and hunting (21%)
- Health care and social assistance (17%)
- Retail trade (16%)
- Finance and insurance (9%)
- Educational services (8%)
- Other services, except public administration (4%)
- Accommodation and food services (4%)
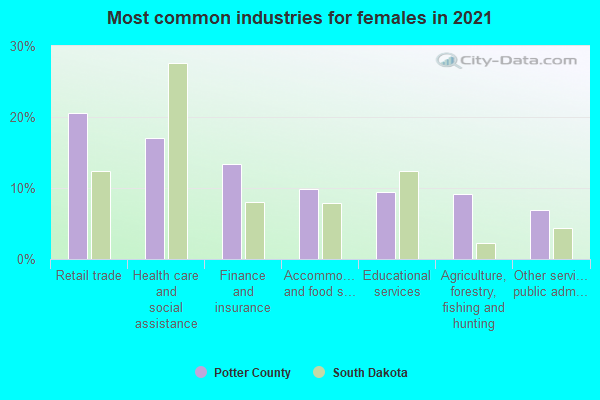
- Agriculture, forestry, fishing and hunting (22%)
- Health care and social assistance (18%)
- Retail trade (17%)
- Finance and insurance (10%)
- Educational services (8%)
- Other services, except public administration (5%)
- Accommodation and food services (5%)
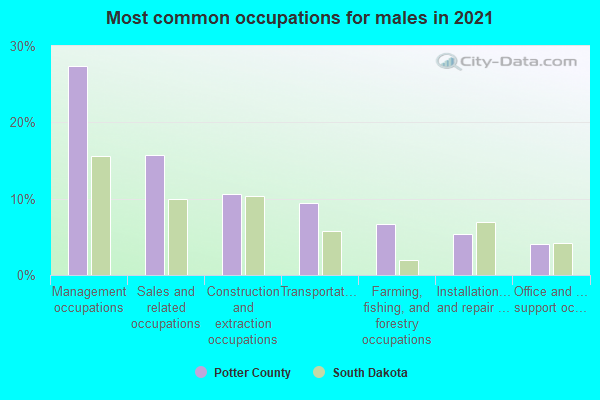
- Management occupations (32%)
- Sales and related occupations (18%)
- Transportation occupations (12%)
- Construction and extraction occupations (9%)
- Farming, fishing, and forestry occupations (8%)
- Installation, maintenance, and repair occupations (5%)
- Building and grounds cleaning and maintenance occupations (3%)
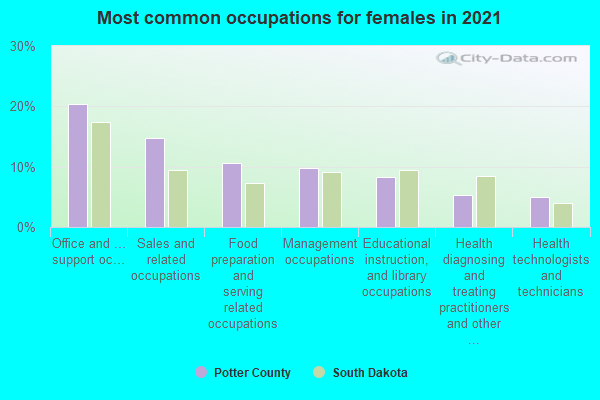
- Office and administrative support occupations (26%)
- Management occupations (13%)
- Sales and related occupations (11%)
- Farming, fishing, and forestry occupations (10%)
- Health diagnosing and treating practitioners and other technical occupations (9%)
- Food preparation and serving related occupations (8%)
- Educational instruction, and library occupations (7%)
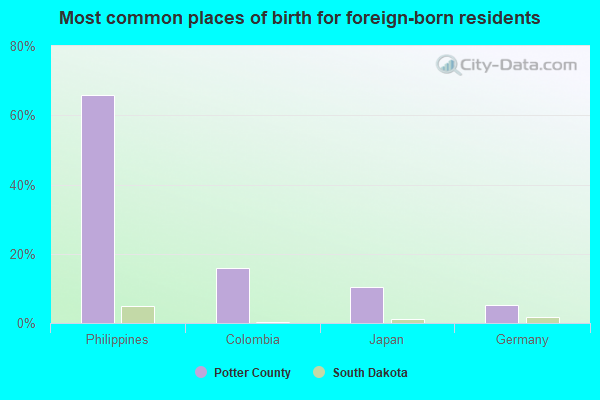
- Philippines (65%)
- Japan (17%)
- Germany (4%)
- Denmark (0%)
- Ireland (0%)
- Norway (0%)
- Sweden (0%)
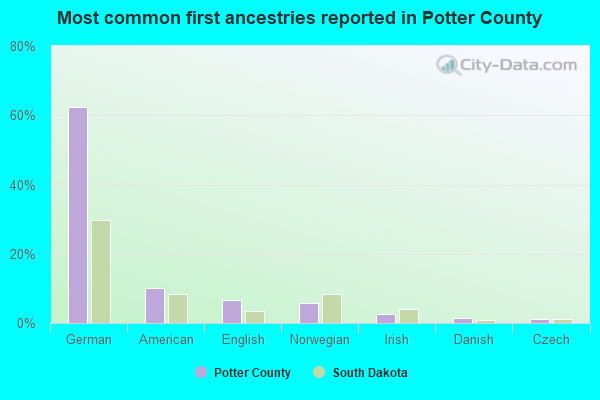
- German (60%)
- American (14%)
- English (7%)
- Norwegian (5%)
- Irish (2%)
- Polish (2%)
- Danish (1%)
55 people in nursing homes
13 people in other group homes
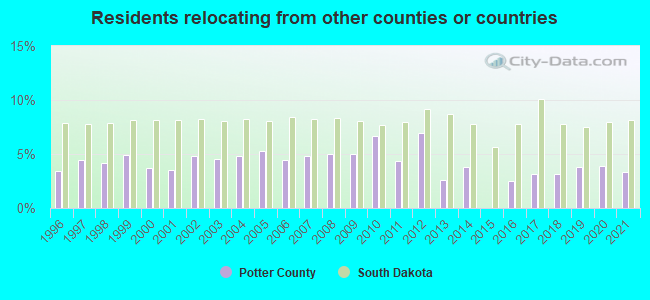
3.32% of this county's 2021 resident taxpayers lived in other counties in 2020 ($50,097 average adjusted gross income)
| Here: | 3.32% |
| South Dakota average: | 8.18% |
10 or fewer of this county's residents moved from foreign countries.
3.32% relocated from other counties in South Dakota ($50,097 average AGI)
10 or fewer of this county's residents relocated from other states.
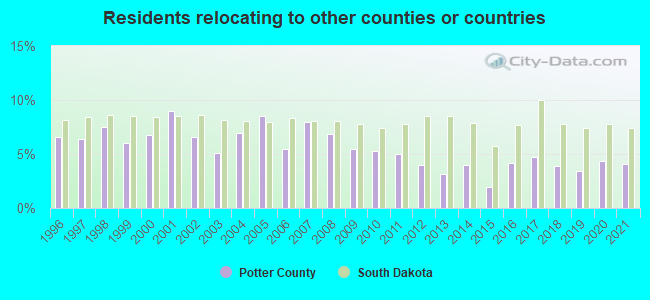
4.03% of this county's 2020 resident taxpayers moved to other counties in 2021 ($50,895 average adjusted gross income)
| Here: | 4.03% |
| South Dakota average: | 7.42% |
10 or fewer of this county's residents moved to foreign countries.
4.03% relocated to other counties in South Dakota ($50,895 average AGI)
10 or fewer of this county's residents relocated to other states.
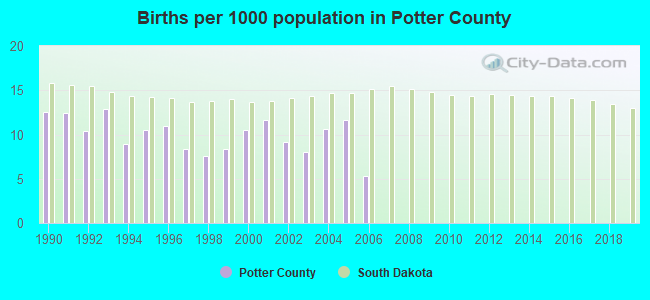
Births per 1000 population from 1990 to 1999: 10.3
Births per 1000 population from 2000 to 2006: 9.5
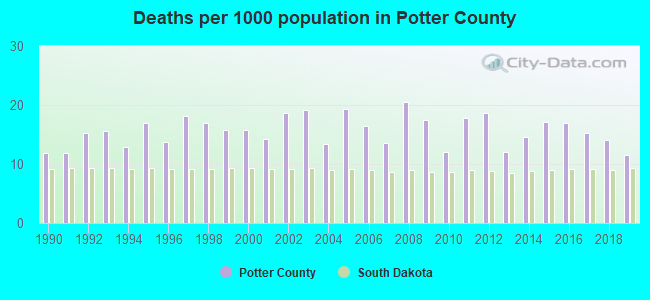
Deaths per 1000 population from 1990 to 1999: 14.9
Deaths per 1000 population from 2000 to 2009: 16.9
Deaths per 1000 population from 2010 to 2020: 15.5
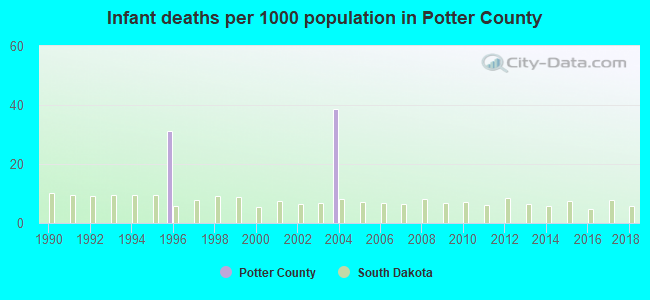
Infant deaths per 1000 live births from 1990 to 1999: 3.1
Infant deaths per 1000 live births from 2000 to 2006: 5.5
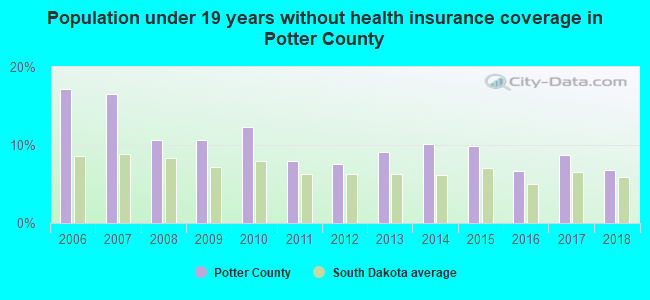
Persons under 19 years old without health insurance coverage in 2018: 6.8%


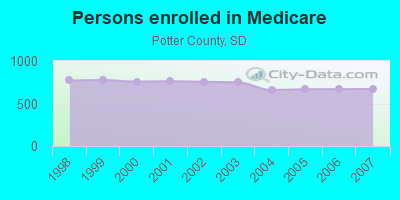
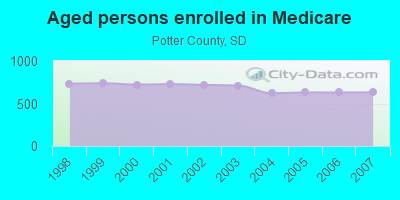
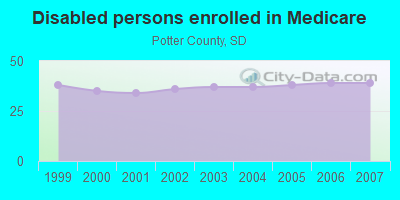
Persons enrolled in hospital insurance and/or supplemental medical insurance (Medicare) in July 1, 2007: 670 (631 aged, 39 disabled)
Children under 18 without health insurance coverage in 2007: 59 (16%)
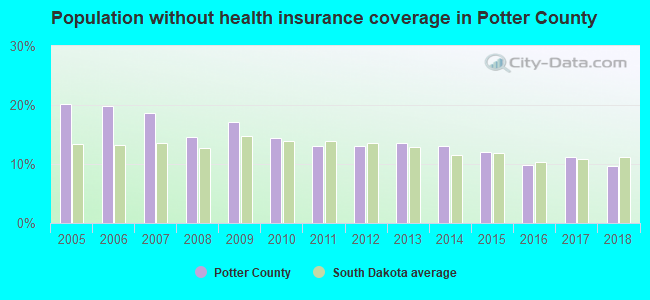
Population without health insurance coverage in 2000: 12%
Children under 18 without health insurance coverage in 2000: 14%
Short term general hospital admissions per 100,000 population in 2004: 13,510
Short term general hospital beds per 100,000 population in 2004: 3,378
Emergency room visits per 100,000 population in 2004: 23,884
General practice office based MDs per 100,000 population in 2005: 936
Medical specialist MDs per 100,000 population in 2005: 1,659
Dentists per 100,000 population in 1998: 85
Total births per 100,000 population, July 2005 - July 2006 : 70
Total deaths per 100,000 population, July 2005 - July 2006: 213
Limited-service eating places per 100,000 population in 2005 : 43
Household type by relationship:
Households: 2,643- Male householders: 657 (186 living alone), Female householders: 430 (164 living alone)
616 spouses (605 opposite-sex spouses), 49 unmarried partners, (49 opposite-sex unmarried partners), 769 children (743 natural, 0 adopted, 21 stepchildren), 10 grandchildren, 3 brothers or sisters, 4 parents, 0 foster children, 14 other relatives, 19 non-relatives
- In group quarters: 77
Size of family households: 407 2-persons, 104 3-persons, 131 4-persons, 41 5-persons, 3 6-persons, 10 7-or-more-persons.
Size of nonfamily households: 350 1-person, 28 2-persons, 3 3-persons.
500 married couples with children.
58 single-parent households (32 men, 26 women).
98.4% of residents of Potter speak English at home.
0.2% of residents speak Spanish at home (100% speak English very well).
0.4% of residents speak other Indo-European language at home (100% speak English very well).
0.7% of residents speak Asian or Pacific Island language at home (33% speak English very well, 67% speak English well).
In fiscal year 2004:
Federal Government expenditure: $36,967,000 ($14,864 per capita)
Department of Defense expenditure: $157,000
Federal direct payments to individuals for retirement and disability: $8,457,000
Federal other direct payments to individuals: $4,975,000
Federal direct payments not to individuals: $10,263,000
Federal grants: $11,755,000
Federal procurement contracts: $541,000 ($0,000 Department of Defense)
Federal salaries and wages: $977,000 ($0,000 Department of Defense)
Federal Government direct loans: $594,000
Federal guaranteed/insured loans: $2,730,000
Federal Government insurance: $31,538,000
Population change from April 1, 2000 to July 1, 2005:
Births: 123| Here: | 52 per 1000 residents |
| State: | 72 per 1000 residents |
Deaths: 235
| Here: | 100 per 1000 residents |
| State: | 48 per 1000 residents |
Net international migration: 0
| Here: | 0 per 1000 residents |
| State: | +5 per 1000 residents |
Net internal migration: -223
| Here: | |
| State: |
Total withdrawal of fresh water for public supply: 0.19 millions of gallons per day (all from ground)
| Here: | 7.5 |
| State: | 7.0 |
| Here: | 4.6 |
| State: | 4.1 |
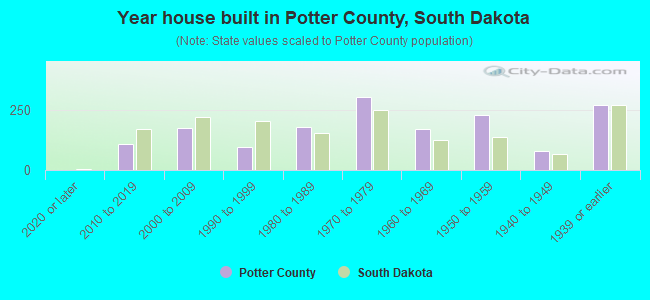
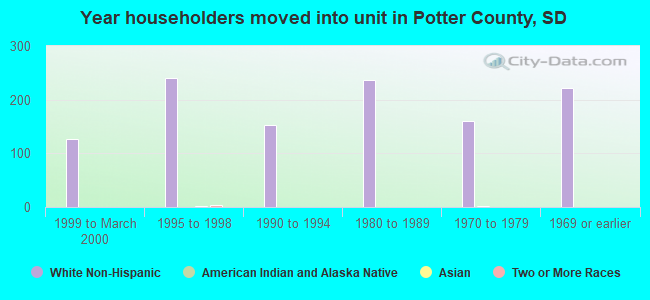
- Year house built in Potter County, South Dakota
- 02020 or later
- 732010 to 2019
- 2332000 to 2009
- 1011990 to 1999
- 1671980 to 1989
- 3021970 to 1979
- 1891960 to 1969
- 2031950 to 1959
- 721940 to 1949
- 2421939 or earlier
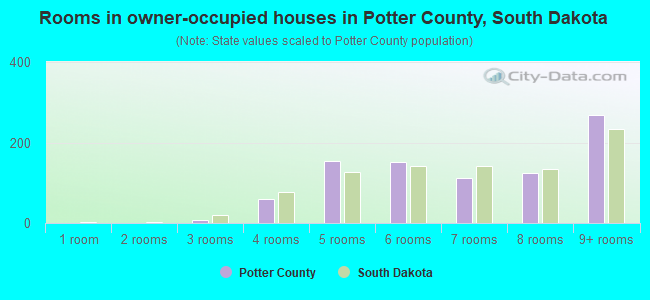
- Rooms in owner-occupied houses in Potter County, South Dakota
- 01 room
- 02 rooms
- 33 rooms
- 494 rooms
- 1175 rooms
- 1256 rooms
- 1337 rooms
- 1158 rooms
- 3109+ rooms
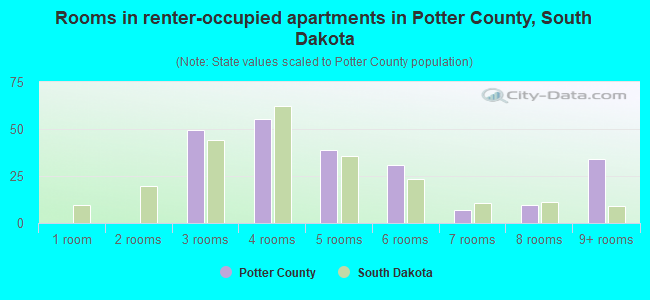
- Rooms in renter-occupied apartments in Potter County, South Dakota
- 01 room
- 02 rooms
- 543 rooms
- 574 rooms
- 405 rooms
- 326 rooms
- 57 rooms
- 88 rooms
- 439+ rooms
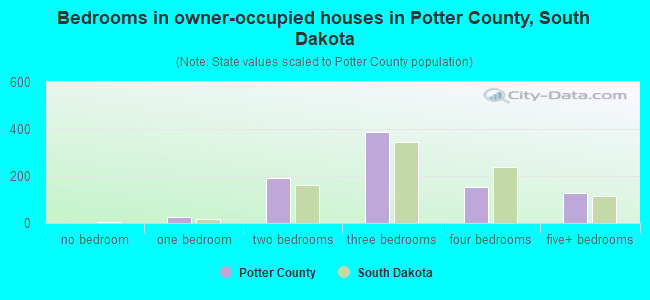
- Bedrooms in owner-occupied houses in Potter County, South Dakota
- 0no bedroom
- 141 bedroom
- 1892 bedrooms
- 3343 bedrooms
- 1774 bedrooms
- 1415+ bedrooms
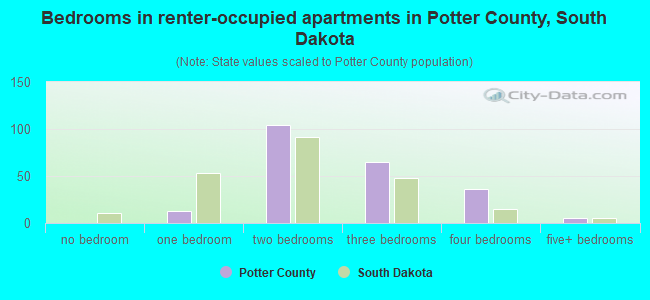
- Bedrooms in renter-occupied apartments in Potter County, South Dakota
- 0no bedroom
- 281 bedroom
- 982 bedrooms
- 583 bedrooms
- 364 bedrooms
- 55+ bedrooms
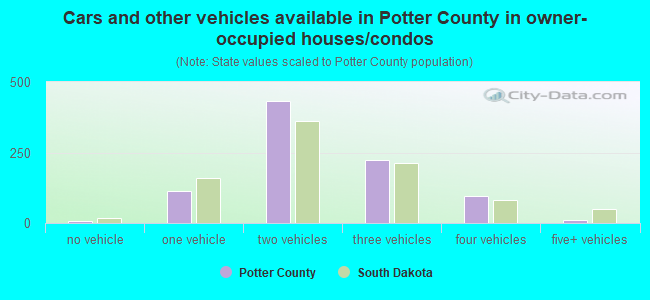
- Cars and other vehicles available in Potter County in owner-occupied houses/condos
- 5no vehicle
- 1081 vehicle
- 3992 vehicles
- 2373 vehicles
- 964 vehicles
- 175+ vehicles
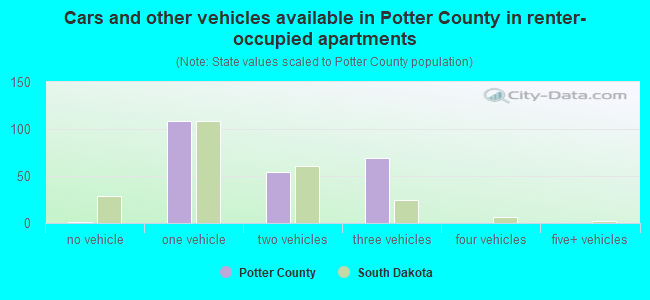
- Cars and other vehicles available in Potter County in renter-occupied apartments
- 11no vehicle
- 971 vehicle
- 722 vehicles
- 483 vehicles
- 04 vehicles
- 05+ vehicles
93.1% of Potter County residents lived in the same house 1 years ago.
Out of people who lived in different houses, 32% lived in this county.
Out of people who lived in different counties, 35% lived in South Dakota.
| Potter County: | 93.1% |
| State average: | 86.6% |
Place of birth for U.S.-born residents:
- This state: 2,105
- Other state: 499
- Northeast: 23
- Midwest: 290
- South: 78
- West: 108
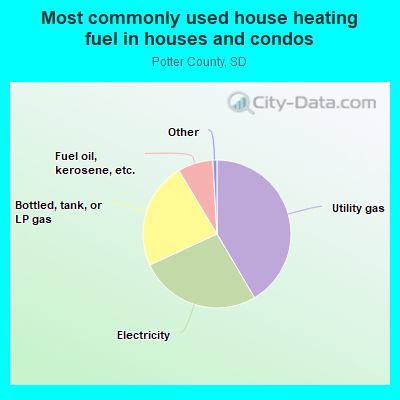
- 37.6%Utility gas
- 27.6%Electricity
- 27.0%Bottled, tank, or LP gas
- 6.8%Fuel oil, kerosene, etc.
- 0.5%Other fuel
- 0.5%No fuel used
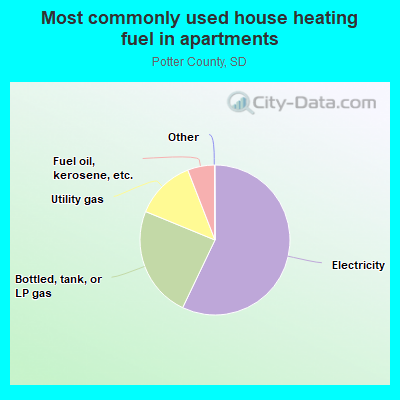
- 55.0%Electricity
- 24.0%Bottled, tank, or LP gas
- 13.1%Utility gas
- 7.9%Fuel oil, kerosene, etc.
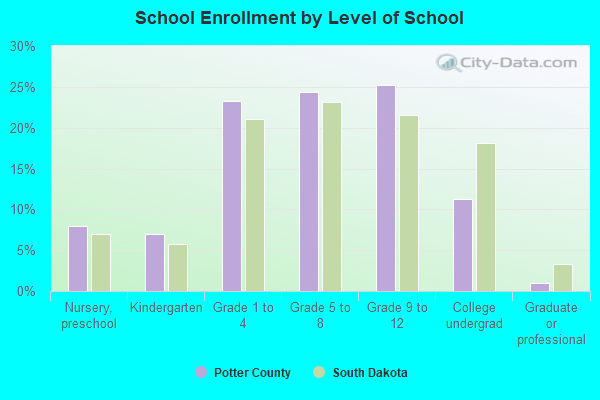
Private vs. public school enrollment:
| Here: | 18.2% |
| South Dakota: | 11.9% |
| Here: | 21.5% |
| South Dakota: | 7.2% |
| Here: | 9.0% |
| South Dakota: | 10.2% |
Supplemental Security Income (SSI) in 2006:
- Total number of recipients: 13
- Number of aged recipients: 0
- Number of blind and disabled recipients: 0
- Number of recipients under 18: 0
- Number of recipients between 18 and 64: 0
- Number of recipients older than 64: 0
- Number of recipients also receiving OASDI: 0
- Amount of payments (thousands of dollars): 6
| Most common first names in Potter County, SD among deceased individuals | ||
| Name | Count | Lived (average) |
|---|---|---|
| John | 36 | 81.3 years |
| William | 30 | 81.9 years |
| Mary | 24 | 85.0 years |
| Anna | 20 | 87.2 years |
| Frank | 19 | 79.2 years |
| Rose | 16 | 85.8 years |
| George | 16 | 81.5 years |
| Robert | 13 | 77.1 years |
| Dorothy | 13 | 82.1 years |
| Margaret | 13 | 84.1 years |
| Most common last names in Potter County, SD among deceased individuals | ||
| Last name | Count | Lived (average) |
|---|---|---|
| Simon | 19 | 81.0 years |
| Smith | 16 | 76.8 years |
| Schmidt | 15 | 80.6 years |
| Frost | 15 | 79.8 years |
| Arbach | 14 | 82.1 years |
| Rausch | 13 | 84.3 years |
| Westphal | 12 | 83.3 years |
| Hansen | 12 | 77.0 years |
| Kilian | 10 | 80.1 years |
| Schaefer | 10 | 80.1 years |
Businesses in Potter County, SD
- Ace Hardware: 1
- True Value: 1
- U-Haul: 1
Potter County on our top lists:
- #17 on the list of "Top 101 counties with the largest number of people without health insurance coverage in 2000"
- #30 on the list of "Top 101 counties with the highest number of deaths per 1000 residents 2007-2013"