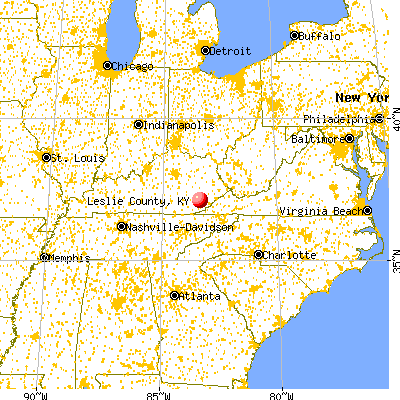
Leslie County, Kentucky (KY)
County owner-occupied free and clear houses and condos in 2010: 2,562
County owner-occupied houses and condos in 2000: 4,012
Renter-occupied apartments: 811 (it was 873 in 2000)
| % of renters here: | 18% |
| State: | 31% |
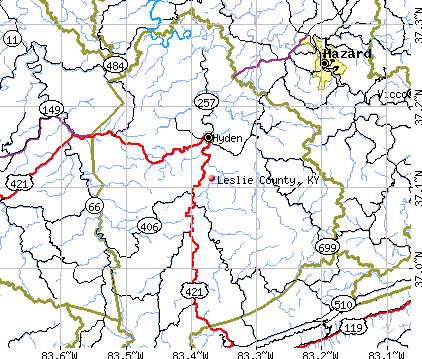
Land area: 404 sq. mi.
Water area: 0.3 sq. mi.
Population density: 26 people per square mile (low).
Industries providing employment: Educational, health and social services (26.6%), Manufacturing (15.4%), Retail trade (14.2%), Transportation and warehousing,and utilities (10.1%).
Type of workers:
- Private wage or salary: 73%
- Government: 22%
- Self-employed, not incorporated: 5%
- Unpaid family work: 0%
- OSM Map
- General Map
- Google Map
- MSN Map

- 10,04796.3%White Non-Hispanic Alone
- 2492.4%Two or more races
- 750.7%Hispanic or Latino
- 420.4%Black Non-Hispanic Alone
- 230.2%Asian alone

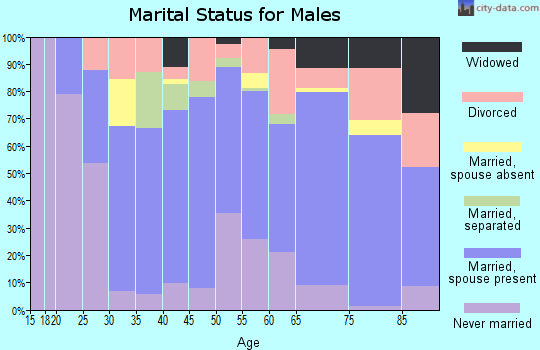
| Median resident age: | 43.5 years |
| Kentucky median age: | 39.4 years |
| Males: 5,246 | |
| Females: 5,243 |

 | Dangerous flash flooding in Breathitt, Perry, Owsley, Knott, Clay and Letcher counties (20 replies) |
| SE Kentucky area (45 replies) |
| Suggestions- Location where we would find what we are looking for in Kentucky? (28 replies) |
| Eastern Kentucky (260 replies) |
| Goofy Kentucky Town Names ... (98 replies) |
| Life Expectancy in Some Kentucky Counties No Better Than Third World (14 replies) |
| Leslie County: | 2.0 people |
| Kentucky: | 2 people |
Estimated median household income in 2022: $36,501 ($18,546 in 1999)
| This county: | $36,501 |
| Kentucky: | $59,341 |
Median contract rent in 2022 for apartments: $386 (lower quartile is $305, upper quartile is $450)
| This county: | $386 |
| State: | $702 |
Estimated median house or condo value in 2022: $86,394 (it was $29,900 in 2000)
| Leslie: | $86,394 |
| Kentucky: | $196,300 |
Mean price in 2022:
Median monthly housing costs for homes and condos with a mortgage: $965Detached houses: $104,915
Here: $104,915 State: $256,452 Mobile homes: $58,533
Here: $58,533 State: $84,635
Median monthly housing costs for units without a mortgage: $347
Institutionalized population: 227
Crime in 2021 (reported by the sheriff's office or county police, not the county total):
- Murders: 0
- Rapes: 0
- Robberies: 0
- Assaults: 2
- Burglaries: 5
- Thefts: 8
- Auto thefts: 6
Crime in 2020 (reported by the sheriff's office or county police, not the county total):
- Murders: 0
- Rapes: 0
- Robberies: 0
- Assaults: 4
- Burglaries: 3
- Thefts: 15
- Auto thefts: 9
Median real estate property taxes paid for housing units with mortgages in 2022: $831 (0.8%)
Median real estate property taxes paid for housing units with no mortgage in 2022: $516 (0.6%)


| Leslie County: | 34.4% |
| Kentucky: | 16.5% |
Median age of residents in 2022: 43.5 years old
(Males: 43.3 years old, Females: 44.0 years old)
(Median age for: White residents: 43.6 years old, Black residents: 25.5 years old, Asian residents: 44.6 years old, Hispanic or Latino residents: 19.6 years old)
Fair market rent in 2006 for a 1-bedroom apartment in Leslie County is $374 a month.
Fair market rent for a 2-bedroom apartment is $429 a month.
Fair market rent for a 3-bedroom apartment is $537 a month.
Neighboring counties: Baca County, Colorado  , Hardin County, Illinois , Montgomery County, Virginia
  , Sussex County, Virginia , Pike County
  , Texas County, Missouri , Suffolk city, Virginia .
| Here: | 6.4% |
| Kentucky: | 3.8% |


Current college students: 342
People 25 years of age or older with a high school degree or higher: 82.0%
People 25 years of age or older with a bachelor's degree or higher: 11.6%
Number of foreign born residents: 33 (74.2% naturalized citizens)
| Leslie County: | 0.3% |
| Whole state: | 4.0% |

- Year of entry for the foreign-born population
- 22010 or later
- 142000 to 2009
- 71990 to 1999
- 01980 to 1989
- 111970 to 1979
- 6Before 1970
Mean travel time to work (commute): % minutes
Percentage of county residents living and working in this county: 98.8%

Housing units in structures:
- One, detached: 3,330
- One, attached: 32
- Two: 1
- 5 to 9: 2
- 20 to 49: 39
- 50 or more: 2
- Mobile homes: 1,528
Housing units in Leslie County with a mortgage: 1,194 (58 second mortgage, 0 home equity loan, 59 both second mortgage and home equity loan)
Houses without a mortgage: 220
| Here: | 0.5% with mortgage |
| State: | 96.8% with mortgage |
Religion statistics for Leslie County
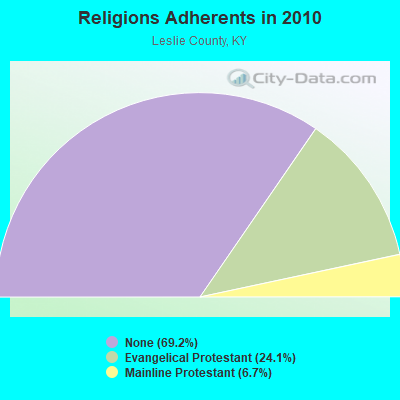
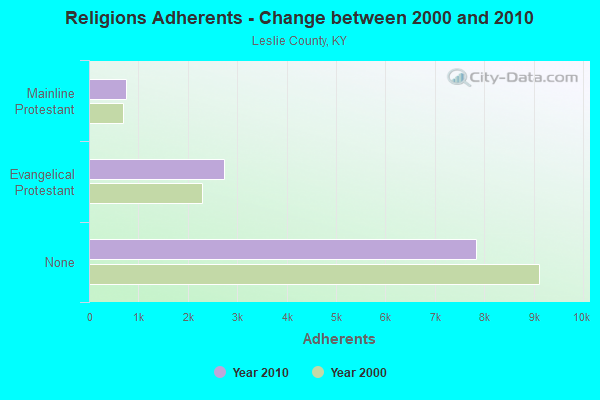
| Religion | Adherents | Congregations |
|---|---|---|
| Evangelical Protestant | 2,724 | 18 |
| Mainline Protestant | 757 | 9 |
| None | 7,829 | - |
Source: Clifford Grammich, Kirk Hadaway, Richard Houseal, Dale E.Jones, Alexei Krindatch, Richie Stanley and Richard H.Taylor. 2012. 2010 U.S.Religion Census: Religious Congregations & Membership Study. Association of Statisticians of American Religious Bodies. Jones, Dale E., et al. 2002. Congregations and Membership in the United States 2000. Nashville, TN: Glenmary Research Center.
Food Environment Statistics:
| Leslie County: | 5.11 / 10,000 pop. |
| State: | 2.19 / 10,000 pop. |
| This county: | 1.70 / 10,000 pop. |
| Kentucky: | 0.74 / 10,000 pop. |
| Leslie County: | 3.41 / 10,000 pop. |
| Kentucky: | 4.36 / 10,000 pop. |
| Leslie County: | 13.6% |
| Kentucky: | 11.0% |
| Leslie County: | 34.3% |
| State: | 30.0% |
| Here: | 12.9% |
| State: | 15.9% |
Agriculture in Leslie County:
Average size of farms: 174 acresAverage value of agricultural products sold per farm: $1,687
Average value of crops sold per acre for harvested cropland: $318.74
The value of nursery, greenhouse, floriculture, and sod as a percentage of the total market value of agricultural products sold: 0.00%
The value of livestock, poultry, and their products as a percentage of the total market value of agricultural products sold: 17.79%
Average total farm production expenses per farm: $7,804
Harvested cropland as a percentage of land in farms: 2.50%
Average market value of all machinery and equipment per farm: $19,558
The percentage of farms operated by a family or individual: 90.00%
Average age of principal farm operators: 55 years
Earthquake activity:
Leslie County-area historical earthquake activity is significantly above Kentucky state average. It is 50% greater than the overall U.S. average.On 7/27/1980 at 18:52:21, a magnitude 5.2 (5.1 MB, 4.7 MS, 5.0 UK, 5.2 UK, Class: Moderate, Intensity: VI - VII) earthquake occurred 82.0 miles away from Leslie County center
On 8/9/2020 at 12:07:37, a magnitude 5.1 (5.1 MW, Depth: 4.7 mi) earthquake occurred 133.5 miles away from the county center
On 8/23/2011 at 17:51:04, a magnitude 5.8 (5.8 MW, Depth: 3.7 mi) earthquake occurred 303.2 miles away from the county center
On 11/30/1973 at 07:48:41, a magnitude 4.7 (4.7 MB, 4.6 ML, Class: Light, Intensity: IV - V) earthquake occurred 96.5 miles away from the county center
On 9/7/1988 at 02:28:09, a magnitude 4.6 (4.5 MB, 4.6 LG) earthquake occurred 76.7 miles away from Leslie County center
On 11/10/2012 at 17:08:14, a magnitude 4.2 (4.2 MW, Depth: 10.6 mi) earthquake occurred 17.5 miles away from the county center
Magnitude types: regional Lg-wave magnitude (LG), body-wave magnitude (MB), local magnitude (ML), surface-wave magnitude (MS), moment magnitude (MW)
Most recent natural disasters:
- Kentucky Severe Storms, Flooding, Landslides, And Mudslides, Incident Period: February 3, 2020 - February 29, 2020, Major Disaster (Presidential) Declared DR-4540-KY: April 24, 2020, FEMA Id: 4540, Natural disaster type: Storm, Mudslide, Landslide, Flood
- Kentucky Covid-19 Pandemic, Incident Period: January 20, 2020, FEMA Id: 4497, Natural disaster type: Other
- Kentucky Severe Storms, Straight-line Winds, Flooding, Landslides, And Mudslides, Incident Period: February 6, 2019 - March 10, 2019, FEMA Id: 4428, Natural disaster type: Storm, Mudslide, Landslide, Flood, Wind
- Kentucky Severe Storms, Flooding, Landslides, And Mudslides, Incident Period: February 9, 2018 - February 14, 2018, FEMA Id: 4358, Natural disaster type: Storm, Mudslide, Landslide, Flood
- Kentucky Severe Storms, Tornadoes, Straight-line Winds, Flooding, Landslides, and Mudslides, Incident Period: July 11, 2015 to July 20, 2015, Major Disaster (Presidential) Declared DR-4239: August 12, 2015, FEMA Id: 4239, Natural disaster type: Storm, Tornado, Mudslide, Landslide, Flood, Wind
- Kentucky Severe Winter Storm, Snowstorm, Flooding, Landslides, and Mudslides, Incident Period: March 03, 2015 to March 09, 2015, Major Disaster (Presidential) Declared DR-4218: May 12, 2015, FEMA Id: 4218, Natural disaster type: Snowstorm, Winter Storm, Mudslide, Landslide, Flood
- Kentucky Severe Storms, Flooding, Mudslides, and Tornadoes, Incident Period: May 01, 2010 to June 01, 2010, Major Disaster (Presidential) Declared DR-1912: May 11, 2010, FEMA Id: 1912, Natural disaster type: Storm, Tornado, Mudslide, Flood
- Kentucky Severe Storms, Tornadoes, Flooding, and Mudslides, Incident Period: May 03, 2009 to May 20, 2009, Major Disaster (Presidential) Declared DR-1841: May 29, 2009, FEMA Id: 1841, Natural disaster type: Storm, Tornado, Mudslide, Flood
- Kentucky Severe Storms, Flooding, Mudslides, and Rockslides, Incident Period: April 14, 2007 to April 15, 2007, Major Disaster (Presidential) Declared DR-1703: May 25, 2007, FEMA Id: 1703, Natural disaster type: Storm, Mudslide, Flood
- Kentucky Hurricane Katrina Evacuation, Incident Period: August 29, 2005 to October 01, 2005, Emergency Declared EM-3231: September 10, 2005, FEMA Id: 3231, Natural disaster type: Hurricane
- 18 other natural disasters have been reported since 1953.
The number of natural disasters in Leslie County (28) is a lot greater than the US average (15).
Major Disasters (Presidential) Declared: 21
Emergencies Declared: 2
Causes of natural disasters: Floods: 21, Storms: 18, Mudslides: 10, Tornadoes: 7, Landslides: 5, Winds: 3, Winter Storms: 3, Fires: 2, Blizzard: 1, Hurricane: 1, Snow: 1, Snowfall: 1, Snowstorm: 1, Other: 1 (Note: some incidents may be assigned to more than one category).

Means of transportation to work:
- Drove a car alone: 1,507 (76.9%)
- Carpooled: 281 (14.3%)
- Walked: 8 (0.4%)
- Worked at home: 162 (8.3%)


- Health care and social assistance (32%)
- Retail trade (21%)
- Educational services (10%)
- Other services, except public administration (7%)
- Accommodation and food services (7%)
- Administrative and support and waste management services (5%)
- Public administration (5%)

- Health care and social assistance (32%)
- Retail trade (21%)
- Educational services (10%)
- Other services, except public administration (7%)
- Accommodation and food services (7%)
- Administrative and support and waste management services (5%)
- Public administration (5%)

- Installation, maintenance, and repair occupations (18%)
- Material moving occupations (16%)
- Construction and extraction occupations (15%)
- Production occupations (9%)
- Management occupations (8%)
- Law enforcement workers including supervisors (8%)
- Educational instruction, and library occupations (5%)

- Sales and related occupations (20%)
- Office and administrative support occupations (13%)
- Health technologists and technicians (11%)
- Healthcare support occupations (8%)
- Food preparation and serving related occupations (7%)
- Health diagnosing and treating practitioners and other technical occupations (6%)
- Educational instruction, and library occupations (5%)

- Philippines (68%)
- Mexico (21%)
- Sri Lanka (3%)
- Ireland (0%)
- Norway (0%)
- Sweden (0%)
- United Kingdom, excluding England and Scotland (0%)

- American (31%)
- English (19%)
- Irish (15%)
- Scotch-Irish (5%)
- German (4%)
- Scottish (2%)
- French (except Basque) (1%)


94 people in nursing facilities/skilled-nursing facilities
People in group quarters in Leslie County, Kentucky in 2000:
- 100 people in nursing homes
- 7 people in local jails and other confinement facilities (including police lockups)
- 3 people in college dormitories (includes college quarters off campus)
3.12% of this county's 2021 resident taxpayers lived in other counties in 2020 ($27,830 average adjusted gross income)
| Here: | 3.12% |
| Kentucky average: | 7.04% |
10 or fewer of this county's residents moved from foreign countries.
3.12% relocated from other counties in Kentucky ($27,830 average AGI)
10 or fewer of this county's residents relocated from other states.

Top counties from which taxpayers relocated into this county between 2020 and 2021:
| from Perry County, KY |
4.35% of this county's 2020 resident taxpayers moved to other counties in 2021 ($39,056 average adjusted gross income)
| Here: | 4.35% |
| Kentucky average: | 6.89% |
10 or fewer of this county's residents moved to foreign countries.
4.35% relocated to other counties in Kentucky ($39,056 average AGI)
10 or fewer of this county's residents relocated to other states.

Top counties to which taxpayers relocated from this county between 2020 and 2021:
| to Perry County, KY | |
| to Laurel County, KY |
Births per 1000 population from 1990 to 1999: 13.2
Births per 1000 population from 2000 to 2006: 11.8

Deaths per 1000 population from 1990 to 1999: 8.8
Deaths per 1000 population from 2000 to 2009: 11.3
Deaths per 1000 population from 2010 to 2020: 15.4

Infant deaths per 1000 live births from 1990 to 1999: 10.4
Infant deaths per 1000 live births from 2000 to 2006: 7.0

Persons under 19 years old without health insurance coverage in 2018: 4.0%


Persons enrolled in hospital insurance and/or supplemental medical insurance (Medicare) in July 1, 2007: 2,638 (1,508 aged, 1,130 disabled)
Children under 18 without health insurance coverage in 2007: 334 (14%)


Most common underlying causes of death in Leslie County, Kentucky in 1999 - 2019:
- Bronchus or lung, unspecified - Malignant neoplasms (266)
- Atherosclerotic heart disease (120)
- Chronic obstructive pulmonary disease, unspecified (99)
- Acute myocardial infarction, unspecified (78)
- Accidental poisoning by and exposure to other and unspecified drugs, medicaments and biological substances (10)
Population without health insurance coverage in 2000: 18%
Children under 18 without health insurance coverage in 2000: 13%
Short term general hospital admissions per 100,000 population in 2004: 10,844
Short term general hospital beds per 100,000 population in 2004: 208
Emergency room visits per 100,000 population in 2004: 49,639
General practice office based MDs per 100,000 population in 2005: 1,351
Medical specialist MDs per 100,000 population in 2005: 1,084
Total births per 100,000 population, July 2005 - July 2006 : 22
Total deaths per 100,000 population, July 2005 - July 2006: 25
Crimes per 100,000 population in 1996: 1
Household type by relationship:
Households: 10,489- Male householders: 1,636 (441 living alone), Female householders: 2,196 (792 living alone)
1,841 spouses (1,841 opposite-sex spouses), 223 unmarried partners, (223 opposite-sex unmarried partners), 2,919 children (2,493 natural, 71 adopted, 351 stepchildren), 533 grandchildren, 159 brothers or sisters, 120 parents, 62 foster children, 234 other relatives, 155 non-relatives
- In group quarters: 336
Size of family households: 1,133 2-persons, 564 3-persons, 265 4-persons, 200 5-persons, 136 6-persons, 83 7-or-more-persons.
Size of nonfamily households: 1,234 1-person, 204 2-persons, 6 3-persons.
1,233 married couples with children.
434 single-parent households (34 men, 400 women).
98.6% of residents of Leslie speak English at home.
0.5% of residents speak Spanish at home (80% speak English very well, 20% speak English well).
0.7% of residents speak other Indo-European language at home (100% speak English very well).
0.3% of residents speak Asian or Pacific Island language at home (100% speak English very well).
In fiscal year 2004:
Federal Government expenditure: $96,951,000 ($8,050 per capita)
Department of Defense expenditure: $221,000
Federal direct payments to individuals for retirement and disability: $40,151,000
Federal other direct payments to individuals: $21,561,000
Federal direct payments not to individuals: $38,000
Federal grants: $32,766,000
Federal procurement contracts: $602,000 ($0,000 Department of Defense)
Federal salaries and wages: $1,834,000 ($0,000 Department of Defense)
Federal Government direct loans: $114,000
Federal guaranteed/insured loans: $73,000
Federal Government insurance: $2,430,000
Population change from April 1, 2000 to July 1, 2005:
Births: 697| Here: | 58 per 1000 residents |
| State: | 69 per 1000 residents |
Deaths: 728
| Here: | 61 per 1000 residents |
| State: | 50 per 1000 residents |
Net international migration: -2
| Here: | |
| State: |
Net internal migration: -363
| Here: | |
| State: |

Total withdrawal of fresh water for public supply: 0.70 millions of gallons per day (all from surface)
| Here: | 5.7 |
| State: | 6.4 |
| Here: | 5.5 |
| State: | 4.4 |

- Year house built in Leslie County, Kentucky
- 02020 or later
- 2902010 to 2019
- 6802000 to 2009
- 8221990 to 1999
- 1,2881980 to 1989
- 5681970 to 1979
- 3341960 to 1969
- 3871950 to 1959
- 2521940 to 1949
- 2731939 or earlier

- Rooms in owner-occupied houses in Leslie County, Kentucky
- 01 room
- 02 rooms
- 373 rooms
- 5684 rooms
- 8625 rooms
- 8446 rooms
- 4547 rooms
- 2528 rooms
- 3329+ rooms

- Rooms in renter-occupied apartments in Leslie County, Kentucky
- 21 room
- 502 rooms
- 203 rooms
- 844 rooms
- 1065 rooms
- 1116 rooms
- 1147 rooms
- 88 rooms
- 09+ rooms

- Bedrooms in owner-occupied houses in Leslie County, Kentucky
- 0no bedroom
- 21 bedroom
- 7132 bedrooms
- 2,0683 bedrooms
- 5224 bedrooms
- 505+ bedrooms

- Bedrooms in renter-occupied apartments in Leslie County, Kentucky
- 2no bedroom
- 691 bedroom
- 1192 bedrooms
- 2413 bedrooms
- 504 bedrooms
- 05+ bedrooms

- Cars and other vehicles available in Leslie County in owner-occupied houses/condos
- 229no vehicle
- 8821 vehicle
- 1,3522 vehicles
- 6433 vehicles
- 1384 vehicles
- 1005+ vehicles

- Cars and other vehicles available in Leslie County in renter-occupied apartments
- 80no vehicle
- 2771 vehicle
- 602 vehicles
- 603 vehicles
- 224 vehicles
- 05+ vehicles
94.3% of Leslie County residents lived in the same house 1 years ago.
Out of people who lived in different houses, 34% lived in this county.
Out of people who lived in different counties, 93% lived in Kentucky.
| Leslie County: | 94.3% |
| State average: | 87.2% |
Place of birth for U.S.-born residents:
- This state: 9,460
- Other state: 870
- Northeast: 3
- Midwest: 447
- South: 402
- West: 6


- 73.2%Electricity
- 9.6%Wood
- 9.5%Bottled, tank, or LP gas
- 3.4%Utility gas
- 2.7%Coal or coke
- 1.7%Other fuel

- 80.6%Electricity
- 14.9%Bottled, tank, or LP gas
- 4.5%Wood
Private vs. public school enrollment:
| Here: | 7.7% |
| Kentucky: | 17.2% |
| Here: | 0.0% |
| Kentucky: | 15.2% |
| Here: | 44.5% |
| Kentucky: | 19.6% |


Leslie County government finances - Expenditure in 2018:
- Bond Funds - Cash and Securities: $581,000
- Charges - Other: $46,000
Solid Waste Management: $13,000
- Construction - Natural Resources - Other: $440,000
Regular Highways: $287,000
- Current Operations - General - Other: $2,554,000
Correctional Institutions: $2,429,000
Regular Highways: $1,704,000
Natural Resources - Other: $297,000
Central Staff Services: $264,000
Solid Waste Management: $194,000
General Public Buildings: $177,000
Financial Administration: $133,000
Health - Other: $84,000
Police Protection: $65,000
Parks and Recreation: $57,000
Judicial and Legal Services: $46,000
Local Fire Protection: $4,000
- Federal Intergovernmental - Other: $801,000
Health and Hospitals: $5,000
- General - Interest on Debt: $173,000
- Local Intergovernmental - Other: $1,349,000
Highways: $9,000
- Miscellaneous - General Revenue - Other: $213,000
Donations From Private Sources: $16,000
Interest Earnings: $3,000
Rents: $1,000
- Other Capital Outlay - Correctional Institutions: $241,000
General - Other: $41,000
Central Staff Services: $7,000
- Other Funds - Cash and Securities: $4,279,000
- State Intergovernmental - Other: $3,490,000
Highways: $1,687,000
General Local Government Support: $10,000
- Tax - Individual Income: $612,000
Property: $594,000
Public Utilities Sales: $424,000
Corporation License: $21,000
Documentary and Stock Transfer: $3,000
- Total Salaries and Wages: $2,760,000
Leslie County government finances - Revenue in 2018:
- Bond Funds - Cash and Securities: $581,000
- Charges - Other: $46,000
Solid Waste Management: $13,000
- Construction - Natural Resources - Other: $440,000
Regular Highways: $287,000
- Current Operations - General - Other: $2,554,000
Correctional Institutions: $2,429,000
Regular Highways: $1,704,000
Natural Resources - Other: $297,000
Central Staff Services: $264,000
Solid Waste Management: $194,000
General Public Buildings: $177,000
Financial Administration: $133,000
Health - Other: $84,000
Police Protection: $65,000
Parks and Recreation: $57,000
Judicial and Legal Services: $46,000
Local Fire Protection: $4,000
- Federal Intergovernmental - Other: $801,000
Health and Hospitals: $5,000
- General - Interest on Debt: $173,000
- Local Intergovernmental - Other: $1,349,000
Highways: $9,000
- Miscellaneous - General Revenue - Other: $213,000
Donations From Private Sources: $16,000
Interest Earnings: $3,000
Rents: $1,000
- Other Capital Outlay - Correctional Institutions: $241,000
General - Other: $41,000
Central Staff Services: $7,000
- Other Funds - Cash and Securities: $4,279,000
- State Intergovernmental - Other: $3,490,000
Highways: $1,687,000
General Local Government Support: $10,000
- Tax - Individual Income: $612,000
Property: $594,000
Public Utilities Sales: $424,000
Corporation License: $21,000
Documentary and Stock Transfer: $3,000
- Total Salaries and Wages: $2,760,000
Leslie County government finances - Debt in 2018:
- Bond Funds - Cash and Securities: $581,000
- Charges - Other: $46,000
Solid Waste Management: $13,000
- Construction - Natural Resources - Other: $440,000
Regular Highways: $287,000
- Current Operations - General - Other: $2,554,000
Correctional Institutions: $2,429,000
Regular Highways: $1,704,000
Natural Resources - Other: $297,000
Central Staff Services: $264,000
Solid Waste Management: $194,000
General Public Buildings: $177,000
Financial Administration: $133,000
Health - Other: $84,000
Police Protection: $65,000
Parks and Recreation: $57,000
Judicial and Legal Services: $46,000
Local Fire Protection: $4,000
- Federal Intergovernmental - Other: $801,000
Health and Hospitals: $5,000
- General - Interest on Debt: $173,000
- Local Intergovernmental - Other: $1,349,000
Highways: $9,000
- Miscellaneous - General Revenue - Other: $213,000
Donations From Private Sources: $16,000
Interest Earnings: $3,000
Rents: $1,000
- Other Capital Outlay - Correctional Institutions: $241,000
General - Other: $41,000
Central Staff Services: $7,000
- Other Funds - Cash and Securities: $4,279,000
- State Intergovernmental - Other: $3,490,000
Highways: $1,687,000
General Local Government Support: $10,000
- Tax - Individual Income: $612,000
Property: $594,000
Public Utilities Sales: $424,000
Corporation License: $21,000
Documentary and Stock Transfer: $3,000
- Total Salaries and Wages: $2,760,000
Leslie County government finances - Cash and Securities in 2018:
- Bond Funds - Cash and Securities: $581,000
- Charges - Other: $46,000
Solid Waste Management: $13,000
- Construction - Natural Resources - Other: $440,000
Regular Highways: $287,000
- Current Operations - General - Other: $2,554,000
Correctional Institutions: $2,429,000
Regular Highways: $1,704,000
Natural Resources - Other: $297,000
Central Staff Services: $264,000
Solid Waste Management: $194,000
General Public Buildings: $177,000
Financial Administration: $133,000
Health - Other: $84,000
Police Protection: $65,000
Parks and Recreation: $57,000
Judicial and Legal Services: $46,000
Local Fire Protection: $4,000
- Federal Intergovernmental - Other: $801,000
Health and Hospitals: $5,000
- General - Interest on Debt: $173,000
- Local Intergovernmental - Other: $1,349,000
Highways: $9,000
- Miscellaneous - General Revenue - Other: $213,000
Donations From Private Sources: $16,000
Interest Earnings: $3,000
Rents: $1,000
- Other Capital Outlay - Correctional Institutions: $241,000
General - Other: $41,000
Central Staff Services: $7,000
- Other Funds - Cash and Securities: $4,279,000
- State Intergovernmental - Other: $3,490,000
Highways: $1,687,000
General Local Government Support: $10,000
- Tax - Individual Income: $612,000
Property: $594,000
Public Utilities Sales: $424,000
Corporation License: $21,000
Documentary and Stock Transfer: $3,000
- Total Salaries and Wages: $2,760,000
Supplemental Security Income (SSI) in 2006:
- Total number of recipients: 1,340
- Number of aged recipients: 65
- Number of blind and disabled recipients: 1,275
- Number of recipients under 18: 99
- Number of recipients between 18 and 64: 938
- Number of recipients older than 64: 303
- Number of recipients also receiving OASDI: 428
- Amount of payments (thousands of dollars): 607
| Most common first names in Leslie County, KY among deceased individuals | ||
| Name | Count | Lived (average) |
|---|---|---|
| John | 30 | 76.1 years |
| James | 24 | 68.6 years |
| Mary | 20 | 76.4 years |
| Robert | 17 | 68.5 years |
| William | 15 | 66.3 years |
| Charles | 13 | 58.5 years |
| George | 11 | 72.5 years |
| Mollie | 10 | 85.6 years |
| Martha | 10 | 85.8 years |
| David | 9 | 51.2 years |
| Most common last names in Leslie County, KY among deceased individuals | ||
| Last name | Count | Lived (average) |
|---|---|---|
| Lewis | 65 | 69.2 years |
| Morgan | 64 | 75.5 years |
| Sizemore | 58 | 75.2 years |
| Bowling | 41 | 72.3 years |
| Begley | 34 | 71.9 years |
| Couch | 32 | 67.4 years |
| Napier | 29 | 72.8 years |
| Asher | 26 | 77.7 years |
| Roberts | 25 | 75.1 years |
| Woods | 25 | 77.4 years |
| Businesses in Leslie County, KY | ||||
| Name | Count | Name | Count | |
|---|---|---|---|---|
| Advance Auto Parts | 1 | H&R Block | 1 | |
| Dairy Queen | 1 | Hardee's | 1 | |
| FedEx | 1 | Rite Aid | 1 | |
| GNC | 1 | Subway | 1 | |
Leslie County on our top lists:
- #13 on the list of "Top 101 counties with the smallest number of children under 18 without health insurance coverage in 2000"
- #15 on the list of "Top 101 counties with highest percentage of residents voting for Romney (Republican) in the 2012 Presidential Election"
- #31 on the list of "Top 101 counties with the smallest number of people without health insurance coverage in 2000"
- #50 on the list of "Top 101 counties with the lowest percentage of residents relocating to other counties in 2011"