Casey County, Kentucky (KY)
County owner-occupied free and clear houses and condos in 2010: 2,496
County owner-occupied houses and condos in 2000: 5,075
Renter-occupied apartments: 1,415 (it was 1,185 in 2000)
| % of renters here: | 19% |
| State: | 31% |
Land area: 446 sq. mi.
Water area: 0.1 sq. mi.
Population density: 36 people per square mile (low).
Industries providing employment: Educational, health and social services (24.3%), Manufacturing (22.0%).
Type of workers:
- Private wage or salary: 73%
- Government: 14%
- Self-employed, not incorporated: 11%
- Unpaid family work: 1%
- OSM Map
- General Map
- Google Map
- MSN Map

- 14,86093.4%White Non-Hispanic Alone
- 5063.2%Hispanic or Latino
- 3492.2%Two or more races
- 1400.9%Black Non-Hispanic Alone
- 330.2%American Indian and Alaska Native alone
- 140.09%Asian alone
- 60.04%Some other race alone

| Median resident age: | 42.2 years |
| Kentucky median age: | 39.4 years |
| Males: 7,709 | |
| Females: 8,266 |

 | KY geographic cultural differences? (9 replies) |
| Looking at Danville, KY as a retirement spot (43 replies) |
| Is Louisville Southern or Midwestern? (148 replies) |
| Looking to retire in Columbia (8 replies) |
| ***Would like to hear a transplants view of living in Lexington (64 replies) |
| Kentucky Food (25 replies) |
| Casey County: | 2.0 people |
| Kentucky: | 2 people |
Estimated median household income in 2022: $41,599 ($21,580 in 1999)
| This county: | $41,599 |
| Kentucky: | $59,341 |
Median contract rent in 2022 for apartments: $420 (lower quartile is $318, upper quartile is $542)
| This county: | $420 |
| State: | $702 |
Estimated median house or condo value in 2022: $137,854 (it was $45,900 in 2000)
| Casey: | $137,854 |
| Kentucky: | $196,300 |
Mean price in 2022:
Median monthly housing costs for homes and condos with a mortgage: $1,055Detached houses: $175,931
Here: $175,931 State: $256,452 Townhouses or other attached units: $75,954
Here: $75,954 State: $264,090 Mobile homes: $51,373
Here: $51,373 State: $84,635
Median monthly housing costs for units without a mortgage: $286
Institutionalized population: 440
Crime in 2021 (reported by the sheriff's office or county police, not the county total):
- Murders: 0
- Rapes: 1
- Robberies: 1
- Assaults: 2
- Burglaries: 17
- Thefts: 5
- Auto thefts: 4
Crime in 2020 (reported by the sheriff's office or county police, not the county total):
- Murders: 0
- Rapes: 0
- Robberies: 0
- Assaults: 4
- Burglaries: 18
- Thefts: 13
- Auto thefts: 9
Single-family new house construction building permits:
- 2022: 0 buildings
- 2021: 0 buildings
- 2020: 0 buildings
- 2019: 0 buildings
- 2018: 0 buildings
- 2017: 0 buildings
- 2016: 0 buildings
- 2015: 0 buildings
- 2014: 0 buildings
- 2013: 1 building, cost: $74,000
- 2012: 1 building, cost: $74,000
- 2011: 1 building, cost: $112,500
- 2010: 1 building, cost: $112,500
- 2009: 1 building, cost: $112,500
- 2008: 2 buildings, average cost: $112,500
- 2007: 0 buildings
- 2006: 2 buildings, average cost: $109,300
- 2005: 2 buildings, average cost: $109,300
- 2004: 2 buildings, average cost: $109,300
- 2003: 2 buildings, average cost: $109,300
- 2002: 2 buildings, average cost: $109,300
- 2001: 2 buildings, average cost: $109,300
- 2000: 2 buildings, average cost: $109,300
- 1999: 5 buildings, average cost: $80,000
- 1998: 3 buildings, average cost: $76,700
- 1997: 3 buildings, average cost: $76,700


Median real estate property taxes paid for housing units with mortgages in 2022: $963 (0.5%)
Median real estate property taxes paid for housing units with no mortgage in 2022: $543 (0.5%)


| Casey County: | 26.7% |
| Kentucky: | 16.5% |
Median age of residents in 2022: 42.2 years old
(Males: 40.8 years old, Females: 43.9 years old)
(Median age for: White residents: 42.8 years old, Black residents: 47.6 years old, American Indian residents: 12.4 years old, Asian residents: 52.1 years old, Hispanic or Latino residents: 19.3 years old, Other race residents: 4.8 years old)
Fair market rent in 2006 for a 1-bedroom apartment in Casey County is $361 a month.
Fair market rent for a 2-bedroom apartment is $429 a month.
Fair market rent for a 3-bedroom apartment is $523 a month.
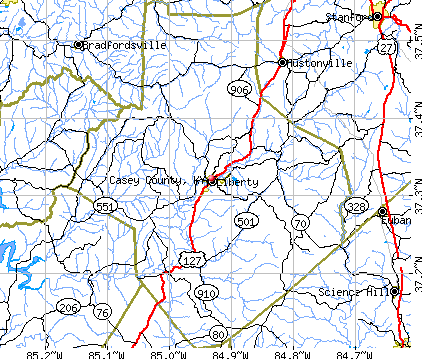
Cities in this county include: Middleburg, Dunnville, Clementsville, Liberty, South Fork.
Neighboring counties: Bollinger County, Missouri  , Cherokee County, Kansas , Mineral County, Colorado , Rockcastle County
  , Lexington city, Virginia .
| Here: | 3.8% |
| Kentucky: | 3.8% |


Current college students: 259
People 25 years of age or older with a high school degree or higher: 77.3%
People 25 years of age or older with a bachelor's degree or higher: 12.2%
Number of foreign born residents: 142 (21.7% naturalized citizens)
| Casey County: | 0.9% |
| Whole state: | 4.0% |

- Year of entry for the foreign-born population
- 312010 or later
- 812000 to 2009
- 101990 to 1999
- 61980 to 1989
- 181970 to 1979
- 19Before 1970
Mean travel time to work (commute): minutes
Percentage of county residents living and working in this county: 99.4%
Housing units in structures:
- One, detached: 5,377
- One, attached: 15
- Two: 50
- 3 or 4: 69
- 5 to 9: 123
- 10 to 19: 62
- 20 or more: 6
- Mobile homes: 1,723
Housing units in Casey County with a mortgage: 1,763 (63 second mortgage, 0 home equity loan, 58 both second mortgage and home equity loan)
Houses without a mortgage: 41
| Here: | 2.4% with mortgage |
| State: | 96.8% with mortgage |
Religion statistics for Casey County
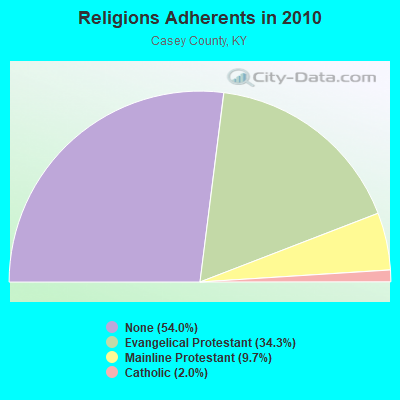
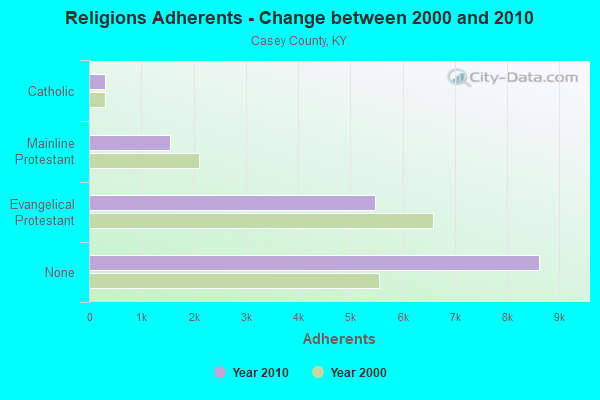
| Religion | Adherents | Congregations |
|---|---|---|
| Evangelical Protestant | 5,470 | 46 |
| Mainline Protestant | 1,554 | 13 |
| Catholic | 312 | 2 |
| Other | 2 | - |
| None | 8,617 | - |
Source: Clifford Grammich, Kirk Hadaway, Richard Houseal, Dale E.Jones, Alexei Krindatch, Richie Stanley and Richard H.Taylor. 2012. 2010 U.S.Religion Census: Religious Congregations & Membership Study. Association of Statisticians of American Religious Bodies. Jones, Dale E., et al. 2002. Congregations and Membership in the United States 2000. Nashville, TN: Glenmary Research Center.
Food Environment Statistics:
| Casey County: | 4.34 / 10,000 pop. |
| State: | 2.19 / 10,000 pop. |
| This county: | 2.48 / 10,000 pop. |
| Kentucky: | 0.74 / 10,000 pop. |
| Casey County: | 6.82 / 10,000 pop. |
| Kentucky: | 4.36 / 10,000 pop. |
| This county: | 3.72 / 10,000 pop. |
| State: | 5.74 / 10,000 pop. |
| Casey County: | 12.7% |
| Kentucky: | 11.0% |
| Casey County: | 31.2% |
| State: | 30.0% |
| Here: | 15.1% |
| State: | 15.9% |
Agriculture in Casey County:
Average size of farms: 141 acresAverage value of agricultural products sold per farm: $16,052
Average value of crops sold per acre for harvested cropland: $188.89
The value of nursery, greenhouse, floriculture, and sod as a percentage of the total market value of agricultural products sold: 0.38%
The value of livestock, poultry, and their products as a percentage of the total market value of agricultural products sold: 61.99%
Average total farm production expenses per farm: $12,667
Harvested cropland as a percentage of land in farms: 22.93%
Irrigated harvested cropland as a percentage of land in farms: 0.30%
Average market value of all machinery and equipment per farm: $30,545
The percentage of farms operated by a family or individual: 92.98%
Average age of principal farm operators: 55 years
Average number of cattle and calves per 100 acres of all land in farms: 21.36
Milk cows as a percentage of all cattle and calves: 6.20%
Corn for grain: 2388 harvested acres
All wheat for grain: 739 harvested acres
Soybeans for beans: 1447 harvested acres
Vegetables: 180 harvested acres
Land in orchards: 41 acres
Earthquake activity:
Casey County-area historical earthquake activity is significantly above Kentucky state average. It is 100% greater than the overall U.S. average.On 7/27/1980 at 18:52:21, a magnitude 5.2 (5.1 MB, 4.7 MS, 5.0 UK, 5.2 UK, Class: Moderate, Intensity: VI - VII) earthquake occurred 81.6 miles away from Casey County center
On 4/18/2008 at 09:36:59, a magnitude 5.4 (5.1 MB, 4.8 MS, 5.4 MW, 5.2 MW) earthquake occurred 179.2 miles away from the county center
On 4/18/2008 at 09:36:59, a magnitude 5.2 (5.2 MW, Depth: 8.9 mi) earthquake occurred 179.2 miles away from the county center
On 6/18/2002 at 17:37:15, a magnitude 5.0 (4.3 MB, 4.6 MW, 5.0 LG) earthquake occurred 162.6 miles away from the county center
On 9/7/1988 at 02:28:09, a magnitude 4.6 (4.5 MB, 4.6 LG, Class: Light, Intensity: IV - V) earthquake occurred 81.0 miles away from Casey County center
On 6/10/1987 at 23:48:54, a magnitude 5.1 (4.9 MB, 4.4 MS, 4.6 MS, 5.1 LG) earthquake occurred 191.3 miles away from the county center
Magnitude types: regional Lg-wave magnitude (LG), body-wave magnitude (MB), surface-wave magnitude (MS), moment magnitude (MW)
Most recent natural disasters:
- Kentucky Covid-19 Pandemic, Incident Period: January 20, 2020, FEMA Id: 4497, Natural disaster type: Other
- Kentucky Severe Storms, Straight-line Winds, Flooding, Landslides, And Mudslides, Incident Period: February 6, 2019 - March 10, 2019, FEMA Id: 4428, Natural disaster type: Storm, Mudslide, Landslide, Flood, Wind
- Kentucky Severe Winter Storm, Snowstorm, Flooding, Landslides, and Mudslides, Incident Period: March 03, 2015 to March 09, 2015, Major Disaster (Presidential) Declared DR-4218: May 12, 2015, FEMA Id: 4218, Natural disaster type: Snowstorm, Winter Storm, Mudslide, Landslide, Flood
- Kentucky Severe Storms, Flooding, Mudslides, and Tornadoes, Incident Period: May 01, 2010 to June 01, 2010, Major Disaster (Presidential) Declared DR-1912: May 11, 2010, FEMA Id: 1912, Natural disaster type: Storm, Tornado, Mudslide, Flood
- Kentucky Severe Winter Storm, Incident Period: January 27, 2009 to February 05, 2009, Emergency Declared EM-3302: January 28, 2009, FEMA Id: 3302, Natural disaster type: Winter Storm
- Kentucky Severe Winter Storm and Flooding, Incident Period: January 26, 2009 to February 13, 2009, Major Disaster (Presidential) Declared DR-1818: February 05, 2009, FEMA Id: 1818, Natural disaster type: Winter Storm, Flood
- Kentucky Severe Storms, Tornadoes, Straight-line Winds, and Flooding, Incident Period: February 05, 2008 to February 06, 2008, Major Disaster (Presidential) Declared DR-1746: February 21, 2008, FEMA Id: 1746, Natural disaster type: Storm, Tornado, Flood, Wind
- Kentucky Hurricane Katrina Evacuation, Incident Period: August 29, 2005 to October 01, 2005, Emergency Declared EM-3231: September 10, 2005, FEMA Id: 3231, Natural disaster type: Hurricane
- Kentucky Severe Storms, Tornadoes, Flooding, and Mudslides, Incident Period: May 26, 2004 to June 18, 2004, Major Disaster (Presidential) Declared DR-1523: June 10, 2004, FEMA Id: 1523, Natural disaster type: Storm, Tornado, Mudslide, Flood
- Kentucky Severe Winter Storms, Incident Period: February 15, 2003 to February 26, 2003, Major Disaster (Presidential) Declared DR-1454: March 14, 2003, FEMA Id: 1454, Natural disaster type: Winter Storm
- 13 other natural disasters have been reported since 1953.
The number of natural disasters in Casey County (23) is greater than the US average (15).
Major Disasters (Presidential) Declared: 18
Emergencies Declared: 3
Causes of natural disasters: Floods: 14, Storms: 13, Tornadoes: 7, Winter Storms: 6, Mudslides: 4, Winds: 3, Landslides: 2, Blizzard: 1, Freeze: 1, Hurricane: 1, Snow: 1, Snowfall: 1, Snowstorm: 1, Other: 1 (Note: some incidents may be assigned to more than one category).

Means of transportation to work:
- Drove a car alone: 2,905 (71.6%)
- Carpooled: 544 (13.4%)
- Bus: 16 (0.4%)
- Taxicab, motorcycle, or other means: 18 (0.4%)
- Bicycle: 23 (0.6%)
- Walked: 112 (2.8%)
- Worked at home: 451 (11.1%)


- Health care and social assistance (24%)
- Manufacturing (14%)
- Educational services (11%)
- Retail trade (6%)
- Finance and insurance (5%)
- Other services, except public administration (4%)
- Accommodation and food services (4%)

- Health care and social assistance (30%)
- Manufacturing (17%)
- Educational services (13%)
- Retail trade (7%)
- Finance and insurance (6%)
- Other services, except public administration (5%)
- Accommodation and food services (5%)

- Production occupations (18%)
- Management occupations (15%)
- Construction and extraction occupations (14%)
- Material moving occupations (10%)
- Transportation occupations (7%)
- Installation, maintenance, and repair occupations (7%)
- Sales and related occupations (5%)

- Office and administrative support occupations (20%)
- Educational instruction, and library occupations (12%)
- Health diagnosing and treating practitioners and other technical occupations (11%)
- Healthcare support occupations (9%)
- Sales and related occupations (8%)
- Food preparation and serving related occupations (7%)
- Production occupations (7%)

- Mexico (62%)
- Uganda (11%)
- Philippines (10%)
- Congo (8%)
- Guatemala (5%)
- Russia (3%)
- Thailand (1%)

- American (54%)
- English (16%)
- Irish (4%)
- German (4%)
- Scottish (2%)
- European (1%)
- Pennsylvania German (1%)


People in group quarters in Casey County, Kentucky in 2010:
- 311 people in local jails and other municipal confinement facilities
- 94 people in nursing facilities/skilled-nursing facilities
- 35 people in group homes for juveniles (non-correctional)
- 20 people in residential treatment centers for adults
- 20 people in workers' group living quarters and job corps centers
People in group quarters in Casey County, Kentucky in 2000:
- 118 people in nursing homes
- 69 people in homes for abused, dependent, and neglected children
- 5 people in agriculture workers' dormitories on farms
- 2 people in other nonhousehold living situations
- 2 people in other noninstitutional group quarters
6.69% of this county's 2021 resident taxpayers lived in other counties in 2020 ($36,888 average adjusted gross income)
| Here: | 6.69% |
| Kentucky average: | 7.04% |
10 or fewer of this county's residents moved from foreign countries.
4.41% relocated from other counties in Kentucky ($20,315 average AGI)
2.28% relocated from other states ($16,574 average AGI)
Casey County: 2.28% Kentucky average: 2.87%

Top counties from which taxpayers relocated into this county between 2020 and 2021:
| from Lincoln County, KY | |
| from Pulaski County, KY | |
| from Boyle County, KY |
5.88% of this county's 2020 resident taxpayers moved to other counties in 2021 ($31,470 average adjusted gross income)
| Here: | 5.88% |
| Kentucky average: | 6.89% |
10 or fewer of this county's residents moved to foreign countries.
4.73% relocated to other counties in Kentucky ($25,635 average AGI)
1.15% relocated to other states ($5,834 average AGI)
Casey County: 1.15% Kentucky average: 2.73%

Top counties to which taxpayers relocated from this county between 2020 and 2021:
| to Lincoln County, KY | |
| to Boyle County, KY | |
| to Pulaski County, KY | |
| to Russell County, KY |
Births per 1000 population from 1990 to 1999: 13.4
Births per 1000 population from 2000 to 2006: 12.1

Deaths per 1000 population from 1990 to 1999: 11.3
Deaths per 1000 population from 2000 to 2009: 11.6
Deaths per 1000 population from 2010 to 2020: 12.5

Infant deaths per 1000 live births from 1990 to 1999: 8.4
Infant deaths per 1000 live births from 2000 to 2006: 7.4

Persons under 19 years old without health insurance coverage in 2018: 6.1%


Persons enrolled in hospital insurance and/or supplemental medical insurance (Medicare) in July 1, 2007: 3,077 (2,235 aged, 842 disabled)
Children under 18 without health insurance coverage in 2007: 549 (15%)


Most common underlying causes of death in Casey County, Kentucky in 1999 - 2019:
- Acute myocardial infarction, unspecified (339)
- Bronchus or lung, unspecified - Malignant neoplasms (330)
- Chronic obstructive pulmonary disease, unspecified (205)
- Atherosclerotic heart disease (47)
- Unspecified dementia (47)
- Congestive heart failure (38)
- Stroke, not specified as haemorrhage or infarction (35)
- Pneumonia, unspecified (18)
- Cardiac arrest, unspecified (11)
- Atherosclerotic cardiovascular disease, so described (10)
Population without health insurance coverage in 2000: 20%
Children under 18 without health insurance coverage in 2000: 16%
Short term general hospital admissions per 100,000 population in 2004: 3,157
Short term general hospital beds per 100,000 population in 2004: 149
Emergency room visits per 100,000 population in 2004: 34,193
General practice office based MDs per 100,000 population in 2005: 1,320
Medical specialist MDs per 100,000 population in 2005: 1,105
Total births per 100,000 population, July 2005 - July 2006 : 14
Total deaths per 100,000 population, July 2005 - July 2006: 55
Limited-service eating places per 100,000 population in 2005 : 12
Crimes per 100,000 population in 1996: 1
Household type by relationship:
Households: 15,975- Male householders: 2,841 (1,034 living alone), Female householders: 3,397 (816 living alone)
3,009 spouses (2,980 opposite-sex spouses), 340 unmarried partners, (305 opposite-sex unmarried partners), 3,853 children (3,499 natural, 59 adopted, 294 stepchildren), 717 grandchildren, 304 brothers or sisters, 237 parents, 20 foster children, 428 other relatives, 321 non-relatives
- In group quarters: 435
Size of family households: 1,920 2-persons, 936 3-persons, 524 4-persons, 361 5-persons, 129 6-persons, 182 7-or-more-persons.
Size of nonfamily households: 1,850 1-person, 278 2-persons, 44 3-persons.
2,133 married couples with children.
587 single-parent households (83 men, 504 women).
95.3% of residents of Casey speak English at home.
1.3% of residents speak Spanish at home (44% speak English very well, 18% speak English well, 11% speak English not well, 27% don't speak English at all).
3.3% of residents speak other Indo-European language at home (66% speak English very well, 27% speak English well, 7% speak English not well).
0.1% of residents speak Asian or Pacific Island language at home (94% speak English very well, 6% speak English well).
0.2% of residents speak other language at home (65% speak English well, 35% speak English not well).
In fiscal year 2004:
Federal Government expenditure: $88,415,000 ($5,506 per capita)
Department of Defense expenditure: $1,131,000
Federal direct payments to individuals for retirement and disability: $37,341,000
Federal other direct payments to individuals: $18,567,000
Federal direct payments not to individuals: $577,000
Federal grants: $29,551,000
Federal procurement contracts: $508,000 ($0,000 Department of Defense)
Federal salaries and wages: $1,870,000 ($0,000 Department of Defense)
Federal Government direct loans: $663,000
Federal guaranteed/insured loans: $1,247,000
Federal Government insurance: $3,046,000
Population change from April 1, 2000 to July 1, 2005:
Births: 1,015| Here: | 62 per 1000 residents |
| State: | 69 per 1000 residents |
Deaths: 965
| Here: | 59 per 1000 residents |
| State: | 50 per 1000 residents |
Net international migration: +114
| Here: | +7 per 1000 residents |
| State: | +7 per 1000 residents |
Net internal migration: +705
| Here: | +43 per 1000 residents |
| State: | +8 per 1000 residents |

Total withdrawal of fresh water for public supply: 0.66 millions of gallons per day (all from surface)
| Here: | 5.8 |
| State: | 6.4 |
| Here: | 4.8 |
| State: | 4.4 |

- Year house built in Casey County, Kentucky
- 312020 or later
- 6392010 to 2019
- 1,0462000 to 2009
- 1,3221990 to 1999
- 1,4721980 to 1989
- 1,2181970 to 1979
- 5161960 to 1969
- 3781950 to 1959
- 2231940 to 1949
- 5561939 or earlier

- Rooms in owner-occupied houses in Casey County, Kentucky
- 01 room
- 92 rooms
- 743 rooms
- 4744 rooms
- 1,4155 rooms
- 1,2336 rooms
- 6267 rooms
- 4158 rooms
- 5019+ rooms

- Rooms in renter-occupied apartments in Casey County, Kentucky
- 61 room
- 842 rooms
- 1363 rooms
- 4254 rooms
- 3515 rooms
- 2576 rooms
- 1527 rooms
- 568 rooms
- 89+ rooms

- Bedrooms in owner-occupied houses in Casey County, Kentucky
- 0no bedroom
- 601 bedroom
- 9952 bedrooms
- 2,7303 bedrooms
- 7934 bedrooms
- 1895+ bedrooms

- Bedrooms in renter-occupied apartments in Casey County, Kentucky
- 7no bedroom
- 1641 bedroom
- 5502 bedrooms
- 5233 bedrooms
- 1544 bedrooms
- 515+ bedrooms

- Cars and other vehicles available in Casey County in owner-occupied houses/condos
- 208no vehicle
- 8231 vehicle
- 1,9802 vehicles
- 1,2553 vehicles
- 3454 vehicles
- 1365+ vehicles

- Cars and other vehicles available in Casey County in renter-occupied apartments
- 269no vehicle
- 7201 vehicle
- 4332 vehicles
- 413 vehicles
- 124 vehicles
- 05+ vehicles
87.8% of Casey County residents lived in the same house 1 years ago.
Out of people who lived in different houses, 35% lived in this county.
Out of people who lived in different counties, 54% lived in Kentucky.
| Casey County: | 87.8% |
| State average: | 87.2% |
Place of birth for U.S.-born residents:
- This state: 12,262
- Other state: 3,445
- Northeast: 467
- Midwest: 1,546
- South: 966
- West: 486


- 69.2%Electricity
- 16.0%Wood
- 6.9%Bottled, tank, or LP gas
- 5.8%Utility gas
- 1.2%Other fuel
- 0.8%Fuel oil, kerosene, etc.

- 72.7%Electricity
- 15.7%Utility gas
- 10.4%Wood
- 1.2%Bottled, tank, or LP gas
Private vs. public school enrollment:
| Here: | 39.9% |
| Kentucky: | 17.2% |
| Here: | 25.6% |
| Kentucky: | 15.2% |
| Here: | 13.2% |
| Kentucky: | 19.6% |


Casey County government finances - Expenditure in 2018:
- Bond Funds - Cash and Securities: $1,671,000
- Charges - Other: $200,000
Solid Waste Management: $20,000
Parks and Recreation: $4,000
- Construction - Regular Highways: $1,141,000
- Current Operations - Correctional Institutions: $2,375,000
General - Other: $1,854,000
Regular Highways: $948,000
Central Staff Services: $393,000
Judicial and Legal Services: $318,000
Parks and Recreation: $273,000
Police Protection: $142,000
Solid Waste Management: $61,000
Financial Administration: $39,000
Health - Other: $36,000
General Public Buildings: $32,000
Public Welfare - Other: $4,000
Natural Resources - Other: $3,000
- Federal Intergovernmental - Other: $100,000
Health and Hospitals: $40,000
- General - Interest on Debt: $43,000
- Intergovernmental to Local - Other - Health - Other: $3,000
- Local Intergovernmental - Other: $141,000
- Miscellaneous - Sale of Property: $460,000
General Revenue - Other: $350,000
Rents: $129,000
Interest Earnings: $19,000
Donations From Private Sources: $13,000
- Other Capital Outlay - Police Protection: $93,000
General - Other: $46,000
Solid Waste Management: $45,000
Correctional Institutions: $2,000
- Other Funds - Cash and Securities: $1,175,000
- State Intergovernmental - Other: $3,516,000
Highways: $1,504,000
- Tax - Insurance Premiums Sales: $919,000
Property: $436,000
Public Utilities Sales: $305,000
Corporation License: $46,000
Documentary and Stock Transfer: $29,000
- Total Salaries and Wages: $2,162,000
Casey County government finances - Revenue in 2018:
- Bond Funds - Cash and Securities: $1,671,000
- Charges - Other: $200,000
Solid Waste Management: $20,000
Parks and Recreation: $4,000
- Construction - Regular Highways: $1,141,000
- Current Operations - Correctional Institutions: $2,375,000
General - Other: $1,854,000
Regular Highways: $948,000
Central Staff Services: $393,000
Judicial and Legal Services: $318,000
Parks and Recreation: $273,000
Police Protection: $142,000
Solid Waste Management: $61,000
Financial Administration: $39,000
Health - Other: $36,000
General Public Buildings: $32,000
Public Welfare - Other: $4,000
Natural Resources - Other: $3,000
- Federal Intergovernmental - Other: $100,000
Health and Hospitals: $40,000
- General - Interest on Debt: $43,000
- Intergovernmental to Local - Other - Health - Other: $3,000
- Local Intergovernmental - Other: $141,000
- Miscellaneous - Sale of Property: $460,000
General Revenue - Other: $350,000
Rents: $129,000
Interest Earnings: $19,000
Donations From Private Sources: $13,000
- Other Capital Outlay - Police Protection: $93,000
General - Other: $46,000
Solid Waste Management: $45,000
Correctional Institutions: $2,000
- Other Funds - Cash and Securities: $1,175,000
- State Intergovernmental - Other: $3,516,000
Highways: $1,504,000
- Tax - Insurance Premiums Sales: $919,000
Property: $436,000
Public Utilities Sales: $305,000
Corporation License: $46,000
Documentary and Stock Transfer: $29,000
- Total Salaries and Wages: $2,162,000
Casey County government finances - Debt in 2018:
- Bond Funds - Cash and Securities: $1,671,000
- Charges - Other: $200,000
Solid Waste Management: $20,000
Parks and Recreation: $4,000
- Construction - Regular Highways: $1,141,000
- Current Operations - Correctional Institutions: $2,375,000
General - Other: $1,854,000
Regular Highways: $948,000
Central Staff Services: $393,000
Judicial and Legal Services: $318,000
Parks and Recreation: $273,000
Police Protection: $142,000
Solid Waste Management: $61,000
Financial Administration: $39,000
Health - Other: $36,000
General Public Buildings: $32,000
Public Welfare - Other: $4,000
Natural Resources - Other: $3,000
- Federal Intergovernmental - Other: $100,000
Health and Hospitals: $40,000
- General - Interest on Debt: $43,000
- Intergovernmental to Local - Other - Health - Other: $3,000
- Local Intergovernmental - Other: $141,000
- Miscellaneous - Sale of Property: $460,000
General Revenue - Other: $350,000
Rents: $129,000
Interest Earnings: $19,000
Donations From Private Sources: $13,000
- Other Capital Outlay - Police Protection: $93,000
General - Other: $46,000
Solid Waste Management: $45,000
Correctional Institutions: $2,000
- Other Funds - Cash and Securities: $1,175,000
- State Intergovernmental - Other: $3,516,000
Highways: $1,504,000
- Tax - Insurance Premiums Sales: $919,000
Property: $436,000
Public Utilities Sales: $305,000
Corporation License: $46,000
Documentary and Stock Transfer: $29,000
- Total Salaries and Wages: $2,162,000
Casey County government finances - Cash and Securities in 2018:
- Bond Funds - Cash and Securities: $1,671,000
- Charges - Other: $200,000
Solid Waste Management: $20,000
Parks and Recreation: $4,000
- Construction - Regular Highways: $1,141,000
- Current Operations - Correctional Institutions: $2,375,000
General - Other: $1,854,000
Regular Highways: $948,000
Central Staff Services: $393,000
Judicial and Legal Services: $318,000
Parks and Recreation: $273,000
Police Protection: $142,000
Solid Waste Management: $61,000
Financial Administration: $39,000
Health - Other: $36,000
General Public Buildings: $32,000
Public Welfare - Other: $4,000
Natural Resources - Other: $3,000
- Federal Intergovernmental - Other: $100,000
Health and Hospitals: $40,000
- General - Interest on Debt: $43,000
- Intergovernmental to Local - Other - Health - Other: $3,000
- Local Intergovernmental - Other: $141,000
- Miscellaneous - Sale of Property: $460,000
General Revenue - Other: $350,000
Rents: $129,000
Interest Earnings: $19,000
Donations From Private Sources: $13,000
- Other Capital Outlay - Police Protection: $93,000
General - Other: $46,000
Solid Waste Management: $45,000
Correctional Institutions: $2,000
- Other Funds - Cash and Securities: $1,175,000
- State Intergovernmental - Other: $3,516,000
Highways: $1,504,000
- Tax - Insurance Premiums Sales: $919,000
Property: $436,000
Public Utilities Sales: $305,000
Corporation License: $46,000
Documentary and Stock Transfer: $29,000
- Total Salaries and Wages: $2,162,000
Supplemental Security Income (SSI) in 2006:
- Total number of recipients: 1,252
- Number of aged recipients: 195
- Number of blind and disabled recipients: 1,057
- Number of recipients under 18: 108
- Number of recipients between 18 and 64: 733
- Number of recipients older than 64: 411
- Number of recipients also receiving OASDI: 581
- Amount of payments (thousands of dollars): 498
| Most common first names in Casey County, KY among deceased individuals | ||
| Name | Count | Lived (average) |
|---|---|---|
| James | 96 | 72.2 years |
| William | 89 | 72.7 years |
| Mary | 69 | 78.5 years |
| John | 63 | 77.6 years |
| George | 44 | 76.0 years |
| Charles | 29 | 70.8 years |
| Robert | 26 | 70.6 years |
| Thomas | 24 | 72.7 years |
| Elmer | 20 | 77.5 years |
| Ruby | 20 | 78.1 years |
| Most common last names in Casey County, KY among deceased individuals | ||
| Last name | Count | Lived (average) |
|---|---|---|
| Wethington | 74 | 69.6 years |
| Brown | 72 | 77.7 years |
| Allen | 61 | 73.9 years |
| Wilson | 50 | 69.7 years |
| Murphy | 50 | 74.1 years |
| Clements | 47 | 71.1 years |
| Atwood | 46 | 79.1 years |
| Cochran | 42 | 76.5 years |
| Wesley | 40 | 78.1 years |
| Rodgers | 32 | 74.9 years |
| Businesses in Casey County, KY | ||||
| Name | Count | Name | Count | |
|---|---|---|---|---|
| AT&T | 1 | Lane Furniture | 1 | |
| Chevrolet | 1 | McDonald's | 1 | |
| FedEx | 1 | Pizza Hut | 1 | |
| GNC | 1 | Rite Aid | 1 | |
| H&R Block | 1 | True Value | 1 | |
| La-Z-Boy | 1 | |||