Ashtabula County, Ohio (OH)
County owner-occupied free and clear houses and condos in 2010: 10,081
County owner-occupied houses and condos in 2000: 29,187
Renter-occupied apartments: 11,094 (it was 10,210 in 2000)
| % of renters here: | 26% |
| State: | 32% |
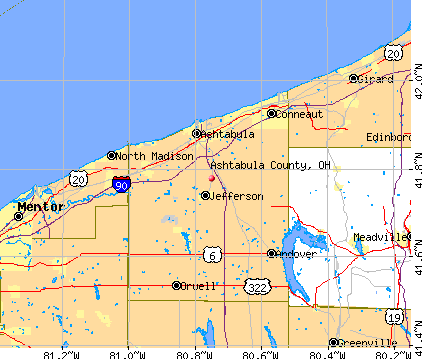
Land area: 702 sq. mi.
Water area: 666.0 sq. mi.
Population density: 138 people per square mile (average).
Industries providing employment: Manufacturing (24.6%), Educational, health and social services (20.8%), Retail trade (11.1%).
Type of workers:
- Private wage or salary: 83%
- Government: 11%
- Self-employed, not incorporated: 6%
- Unpaid family work: 0%
- OSM Map
- General Map
- Google Map
- MSN Map

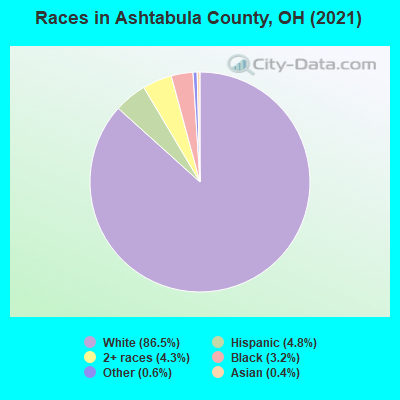
- 83,92386.5%White Non-Hispanic Alone
- 5,4535.6%Two or more races
- 4,8795.0%Hispanic or Latino
- 2,3072.4%Black Non-Hispanic Alone
- 1650.2%Native Hawaiian and Other
Pacific Islander alone - 1220.1%American Indian and Alaska Native alone
- 1190.1%Asian alone
- 460.05%Some other race alone
| Median resident age: | 42.2 years |
| Ohio median age: | 39.9 years |
| Males: 49,422 | |
| Females: 47,592 |

 | Will Columbus become largest Ohio metro? (887 replies) |
| Cleveland's weather (180 replies) |
| Living in Ohio do you love it, regret it, or want to move??? (119 replies) |
| Vacation for Clevelanders? (5 replies) |
| Dewine set the standard on how to handle this pandemic (53 replies) |
| Police presence on roads: Are our roads over-policed? (31 replies) |
| Ashtabula County: | 2.0 people |
| Ohio: | 2 people |
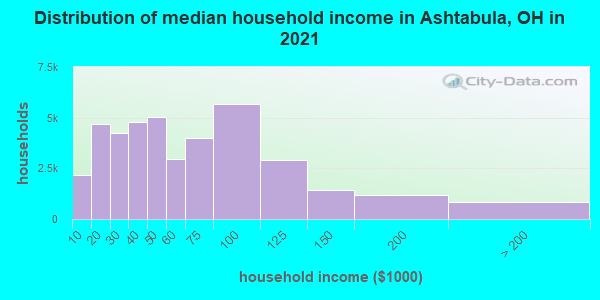
Estimated median household income in 2022: $51,737 ($35,607 in 1999)
| This county: | $51,737 |
| Ohio: | $65,720 |
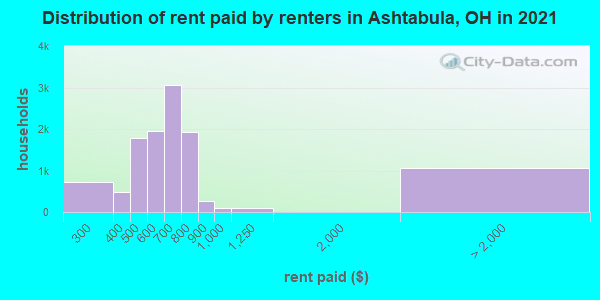
Median contract rent in 2022 for apartments: $630 (lower quartile is $495, upper quartile is $713)
| This county: | $630 |
| State: | $765 |
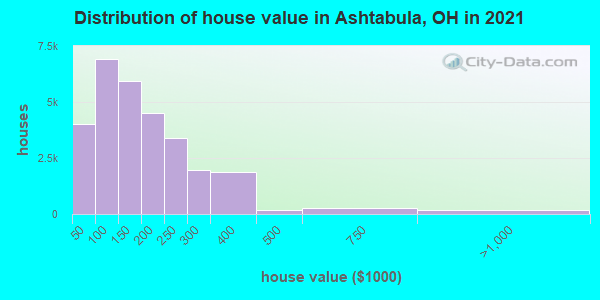
Estimated median house or condo value in 2022: $147,100 (it was $85,100 in 2000)
| Ashtabula: | $147,100 |
| Ohio: | $204,100 |
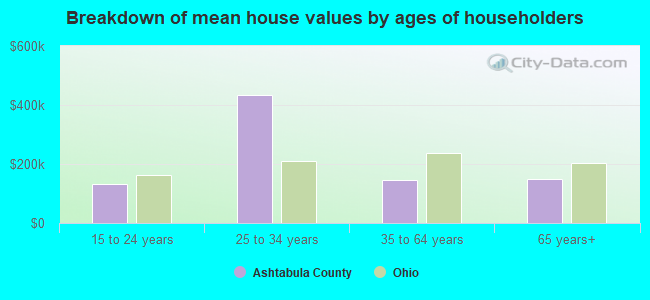
Mean price in 2022:
Median monthly housing costs for homes and condos with a mortgage: $1,117Detached houses: $176,650
Here: $176,650 State: $254,366 Townhouses or other attached units: $154,749
Here: $154,749 State: $225,733 In 2-unit structures: $145,332
Here: $145,332 State: $144,384 In 3-to-4-unit structures: $246,555
Here: $246,555 State: $203,002 In 5-or-more-unit structures: $228,112
Here: $228,112 State: $211,593 Mobile homes: $68,154
Here: $68,154 State: $62,719
Median monthly housing costs for units without a mortgage: $445
Institutionalized population: 2,950
Crime in 2021 (reported by the sheriff's office or county police, not the county total):
- Murders: 0
- Rapes: 8
- Robberies: 3
- Assaults: 39
- Burglaries: 89
- Thefts: 349
- Auto thefts: 19
Crime in 2020 (reported by the sheriff's office or county police, not the county total):
- Murders: 1
- Rapes: 8
- Robberies: 4
- Assaults: 30
- Burglaries: 66
- Thefts: 320
- Auto thefts: 31
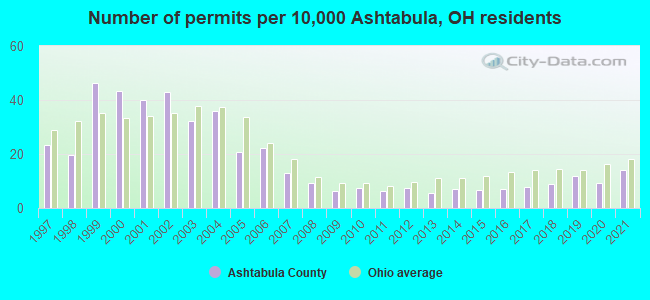
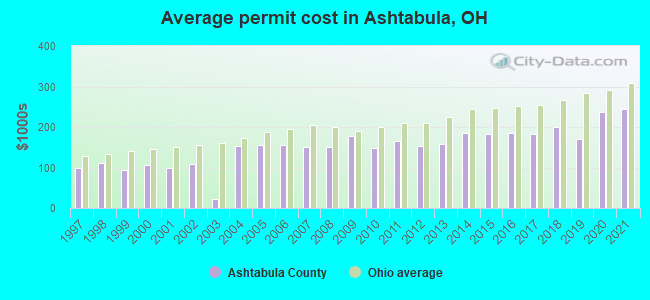
Single-family new house construction building permits:
- 2022: 135 buildings, average cost: $243,500
- 2021: 144 buildings, average cost: $244,700
- 2020: 96 buildings, average cost: $235,900
- 2019: 122 buildings, average cost: $169,600
- 2018: 92 buildings, average cost: $200,800
- 2017: 80 buildings, average cost: $183,400
- 2016: 74 buildings, average cost: $183,500
- 2015: 68 buildings, average cost: $183,100
- 2014: 71 buildings, average cost: $185,800
- 2013: 57 buildings, average cost: $159,200
- 2012: 76 buildings, average cost: $153,600
- 2011: 64 buildings, average cost: $164,500
- 2010: 77 buildings, average cost: $148,600
- 2009: 66 buildings, average cost: $176,500
- 2008: 96 buildings, average cost: $150,200
- 2007: 135 buildings, average cost: $150,900
- 2006: 227 buildings, average cost: $155,100
- 2005: 214 buildings, average cost: $154,900
- 2004: 371 buildings, average cost: $153,100
- 2003: 331 buildings, average cost: $20,700
- 2002: 441 buildings, average cost: $108,600
- 2001: 412 buildings, average cost: $99,000
- 2000: 445 buildings, average cost: $106,500
- 1999: 474 buildings, average cost: $93,900
- 1998: 200 buildings, average cost: $109,600
- 1997: 239 buildings, average cost: $98,900
Median real estate property taxes paid for housing units with mortgages in 2022: $2,133 (1.4%)
Median real estate property taxes paid for housing units with no mortgage in 2022: $1,414 (1.2%)
| Ashtabula County: | 17.8% |
| Ohio: | 13.4% |
Median age of residents in 2022: 42.2 years old
(Males: 41.1 years old, Females: 43.5 years old)
(Median age for: White residents: 45.2 years old, Black residents: 42.4 years old, American Indian residents: 61.9 years old, Hispanic or Latino residents: 25.8 years old, Other race residents: 42.6 years old)
Fair market rent in 2006 for a 1-bedroom apartment in Ashtabula County is $463 a month.
Fair market rent for a 2-bedroom apartment is $590 a month.
Fair market rent for a 3-bedroom apartment is $750 a month.
Cities in this county include: Ashtabula, Conneaut, Geneva, Edgewood, Jefferson, North Kingsville, Geneva-on-the-Lake, Orwell, Andover, Roaming Shores.
| Zip Code | City | Tests | Max concentration | Min concentration | Arithmetic mean | Geometric mean | Standard deviation | Coefficient of variation | Mean concentration | First quartile | Third quartile |
|---|---|---|---|---|---|---|---|---|---|---|---|
| 44003 | Andover | 28 | 2.7 | 0.2 | 1.13 | 0.92 | 0.7 | 61.8 | 1.00 | 0.60 | 1.50 |
| 44004 | Ashtabula | 183 | 51.7 | 0 | 2.58 | 1.23 | 5.23 | 202.84 | 1.00 | 0.60 | 2.20 |
| 44005 | Ashtabula | 1 | 1.5 | 1.5 | 1.5 | 1.5 | 1.50 | 0.83 | 1.68 | ||
| 44010 | Austinburg | 21 | 5.3 | 0.4 | 1.79 | 1.34 | 1.39 | 78.04 | 1.40 | 0.70 | 2.30 |
| 44030 | Conneaut | 106 | 56.5 | 0.1 | 4.88 | 2.16 | 8.34 | 170.94 | 2.30 | 0.90 | 4.90 |
| 44032 | Dorset | 10 | 3.9 | 0.3 | 1.13 | 0.85 | 1.05 | 92.63 | 0.90 | 0.35 | 1.15 |
| 44041 | Geneva | 74 | 11.9 | 0 | 1.65 | 0.95 | 2.04 | 123.99 | 0.90 | 0.40 | 1.80 |
| 44047 | Jefferson | 65 | 7.5 | 0.1 | 1.24 | 0.93 | 1.14 | 91.99 | 0.90 | 0.60 | 1.40 |
| 44048 | Kingsville | 22 | 37.4 | 0.4 | 6.85 | 3.35 | 9.06 | 132.28 | 3.05 | 1.35 | 8.95 |
| 44068 | North Kingsville | 20 | 51 | 0.1 | 13.43 | 4.14 | 15.87 | 118.14 | 4.10 | 1.50 | 21.50 |
| 44076 | Orwell | 34 | 9.3 | 0.1 | 1.34 | 0.93 | 1.6 | 119.57 | 1.00 | 0.55 | 1.35 |
| 44082 | Pierpont | 19 | 8.4 | 0.3 | 1.84 | 1.24 | 1.93 | 105.33 | 1.40 | 0.50 | 2.40 |
| 44084 | Rock Creek | 21 | 5.6 | 0.2 | 1.57 | 1.18 | 1.3 | 82.41 | 1.20 | 0.83 | 1.50 |
| 44085 | Rome | 32 | 6.7 | 0.2 | 1.41 | 1.07 | 1.21 | 85.53 | 1.15 | 0.70 | 1.50 |
| 44088 | Unionville | 3 | 28.3 | 12.7 | 22.1 | 20.87 | 8.28 | 37.46 | 25.30 | 9.88 | 26.05 |
| 44093 | Williamsfield | 10 | 8.5 | 0.3 | 2.23 | 1.47 | 2.42 | 108.47 | 1.15 | 0.80 | 2.70 |
| 44099 | Windsor | 15 | 3 | 0.3 | 1.04 | 0.79 | 0.86 | 82.3 | 0.90 | 0.40 | 1.15 |
All concentrations are in units of pico-Curies of radiation per liter of air ( pCi/l ).
2023 air pollution in Ashtabula County:
Ozone (1-hour): 0.038 ppm (standard limit: 0.12 ppm). Near U.S. average.
Neighboring counties: Benton County, Iowa  , Tolland County, Connecticut
  , Pike County, Pennsylvania , Poweshiek County, Iowa , Rock Island County, Illinois , Tama County, Iowa .
| Here: | 3.8% |
| Ohio: | 3.1% |
Current college students: 2,903
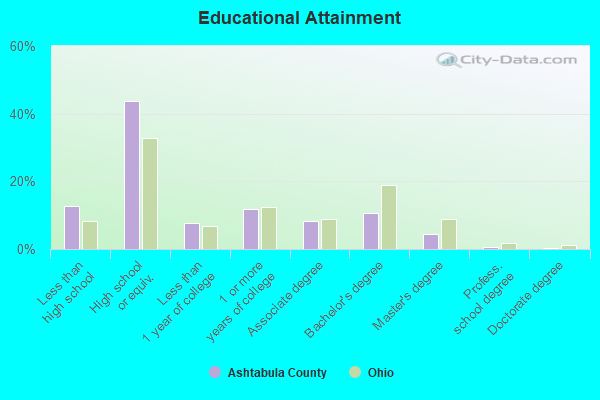
People 25 years of age or older with a high school degree or higher: 87.1%
People 25 years of age or older with a bachelor's degree or higher: 15.8%
Number of foreign born residents: 975 (54.8% naturalized citizens)
| Ashtabula County: | 1.0% |
| Whole state: | 5.0% |
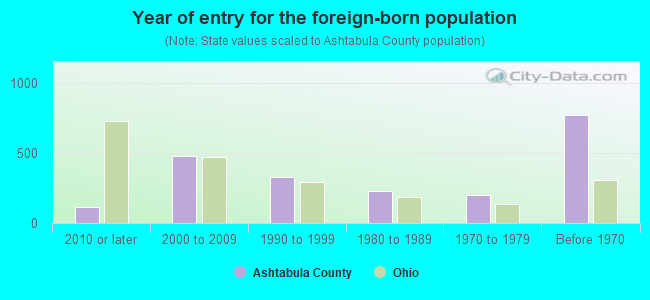
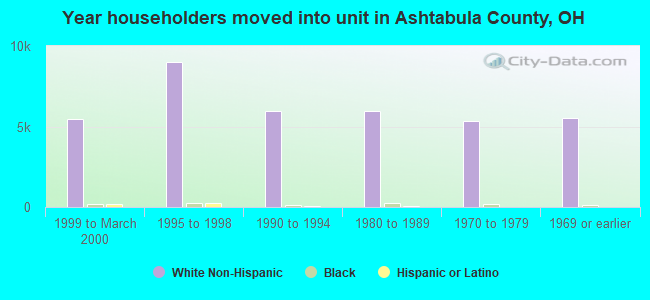
- Year of entry for the foreign-born population
- 1332010 or later
- 3452000 to 2009
- 3521990 to 1999
- 2281980 to 1989
- 2031970 to 1979
- 774Before 1970
Mean travel time to work (commute): minutes
Percentage of county residents living and working in this county: 95.0%
Housing units in structures:
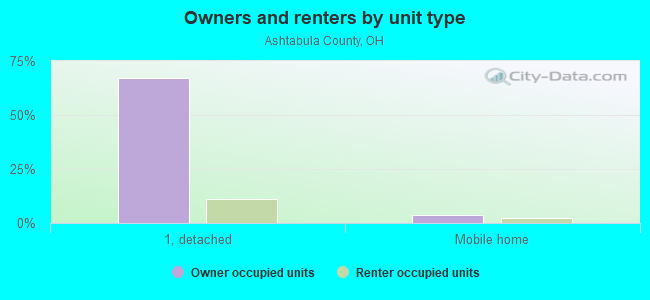
- One, detached: 35,270
- One, attached: 600
- Two: 1,676
- 3 or 4: 1,315
- 5 to 9: 726
- 10 to 19: 921
- 20 to 49: 236
- 50 or more: 1,216
- Mobile homes: 4,529
Housing units in Ashtabula County with a mortgage: 15,639 (2,091 second mortgage, 261 home equity loan, 1,740 both second mortgage and home equity loan)
Houses without a mortgage: 875
| Here: | 1.7% with mortgage |
| State: | 95.2% with mortgage |
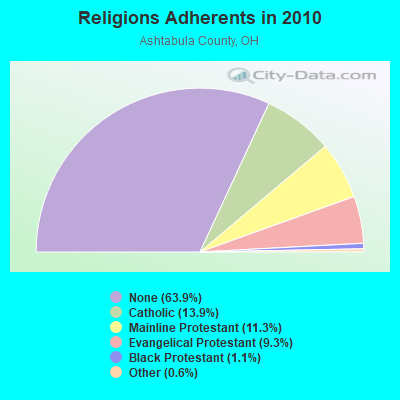
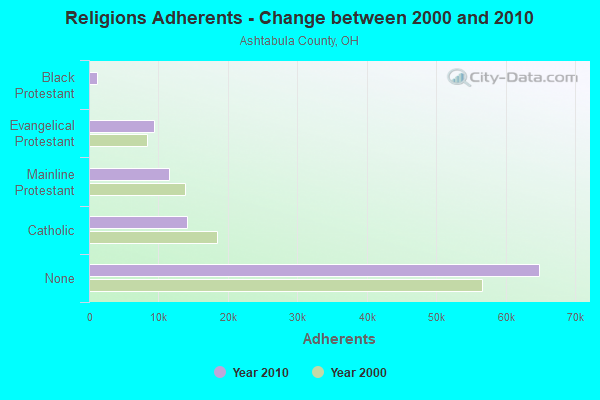
Religion statistics for Ashtabula County
| Religion | Adherents | Congregations |
|---|---|---|
| Catholic | 14,134 | 11 |
| Mainline Protestant | 11,475 | 56 |
| Evangelical Protestant | 9,418 | 82 |
| Black Protestant | 1,097 | 4 |
| Other | 559 | 7 |
| None | 64,814 | - |
Source: Clifford Grammich, Kirk Hadaway, Richard Houseal, Dale E.Jones, Alexei Krindatch, Richie Stanley and Richard H.Taylor. 2012. 2010 U.S.Religion Census: Religious Congregations & Membership Study. Association of Statisticians of American Religious Bodies. Jones, Dale E., et al. 2002. Congregations and Membership in the United States 2000. Nashville, TN: Glenmary Research Center.
Food Environment Statistics:
| Ashtabula County: | 2.08 / 10,000 pop. |
| State: | 1.89 / 10,000 pop. |
| Here: | 0.10 / 10,000 pop. |
| Ohio: | 0.13 / 10,000 pop. |
| This county: | 1.68 / 10,000 pop. |
| Ohio: | 1.25 / 10,000 pop. |
| Ashtabula County: | 3.16 / 10,000 pop. |
| Ohio: | 2.93 / 10,000 pop. |
| This county: | 7.71 / 10,000 pop. |
| State: | 6.25 / 10,000 pop. |
| Ashtabula County: | 9.8% |
| Ohio: | 10.3% |
| Ashtabula County: | 29.5% |
| State: | 29.1% |
| Here: | 12.8% |
| State: | 11.9% |
Agriculture in Ashtabula County:
Average size of farms: 133 acresAverage value of agricultural products sold per farm: $31,126
Average value of crops sold per acre for harvested cropland: $229.73
The value of nursery, greenhouse, floriculture, and sod as a percentage of the total market value of agricultural products sold: 14.77%
The value of livestock, poultry, and their products as a percentage of the total market value of agricultural products sold: 50.23%
Average total farm production expenses per farm: $24,985
Harvested cropland as a percentage of land in farms: 50.76%
Irrigated harvested cropland as a percentage of land in farms: 0.45%
Average market value of all machinery and equipment per farm: $47,257
The percentage of farms operated by a family or individual: 92.13%
Average age of principal farm operators: 55 years
Average number of cattle and calves per 100 acres of all land in farms: 11.88
Milk cows as a percentage of all cattle and calves: 36.14%
Corn for grain: 16591 harvested acres
All wheat for grain: 5472 harvested acres
Soybeans for beans: 23885 harvested acres
Vegetables: 220 harvested acres
Land in orchards: 1,343 acres
Earthquake activity:
Ashtabula County-area historical earthquake activity is significantly above Ohio state average. It is 58% smaller than the overall U.S. average.On 9/25/1998 at 19:52:52, a magnitude 5.2 (4.8 MB, 4.3 MS, 5.2 LG, 4.5 MW, Depth: 3.1 mi, Class: Moderate, Intensity: VI - VII) earthquake occurred 27.0 miles away from Ashtabula County center
On 1/31/1986 at 16:46:43, a magnitude 5.0 (5.0 MB) earthquake occurred 24.2 miles away from the county center
On 8/23/2011 at 17:51:04, a magnitude 5.8 (5.8 MW, Depth: 3.7 mi) earthquake occurred 306.3 miles away from the county center
On 1/26/2001 at 03:03:20, a magnitude 3.9 (3.9 MB, Depth: 3.1 mi, Class: Light, Intensity: II - III) earthquake occurred 11.8 miles away from the county center
On 6/10/2019 at 14:50:45, a magnitude 4.0 (4.0 MB, Depth: 1.2 mi, Class: Light, Intensity: IV - V) earthquake occurred 36.9 miles away from Ashtabula County center
On 12/31/2011 at 20:05:01, a magnitude 4.0 (4.0 ML, Depth: 3.1 mi) earthquake occurred 45.4 miles away from the county center
Magnitude types: regional Lg-wave magnitude (LG), body-wave magnitude (MB), local magnitude (ML), surface-wave magnitude (MS), moment magnitude (MW)
Most recent natural disasters:
- Ohio Covid-19 Pandemic, Incident Period: January 20, 2020, FEMA Id: 4507, Natural disaster type: Other
- Ohio Hurricane Sandy, Incident Period: October 29, 2012 to October 30, 2012, Major Disaster (Presidential) Declared DR-4098: January 03, 2013, FEMA Id: 4098, Natural disaster type: Hurricane
- Ohio Snow, Incident Period: March 07, 2008 to March 09, 2008, Emergency Declared EM-3286: April 24, 2008, FEMA Id: 3286, Natural disaster type: Snow
- Ohio Severe Storms, Straight Line Winds, and Flooding, Incident Period: July 27, 2006 to August 04, 2006, Major Disaster (Presidential) Declared DR-1656: August 01, 2006, FEMA Id: 1656, Natural disaster type: Storm, Flood, Wind
- Ohio Hurricane Katrina Evacuation, Incident Period: August 29, 2005 to October 01, 2005, Emergency Declared EM-3250: September 13, 2005, FEMA Id: 3250, Natural disaster type: Hurricane
- Ohio Power Outage, Incident Period: August 14, 2003 to August 17, 2003, Emergency Declared EM-3187: September 23, 2003, FEMA Id: 3187, Natural disaster type: Power Outage
- Ohio SEVERE STORMS, TORNADOES, Incident Period: May 31, 1985, Major Disaster (Presidential) Declared DR-738: June 03, 1985, FEMA Id: 738, Natural disaster type: Storm, Tornado
- Ohio Blizzards and Snowstorms, Incident Period: January 26, 1978, Emergency Declared EM-3055: January 26, 1978, FEMA Id: 3055, Natural disaster type: Snowstorm, Blizzard
- Ohio Snowstorms, Incident Period: February 02, 1977, Emergency Declared EM-3029: February 02, 1977, FEMA Id: 3029, Natural disaster type: Snowstorm
- Ohio SEVERE STORMS, FLOODING, Incident Period: April 27, 1973, Major Disaster (Presidential) Declared DR-377: April 27, 1973, FEMA Id: 377, Natural disaster type: Storm, Flood
- 2 other natural disasters have been reported since 1953.
The number of natural disasters in Ashtabula County (12) is smaller than the US average (15).
Major Disasters (Presidential) Declared: 6
Emergencies Declared: 5
Causes of natural disasters: Storms: 4, Floods: 3, Hurricanes: 2, Snowstorms: 2, Tornadoes: 2, Blizzard: 1, Power Outage: 1, Snow: 1, Tropical Storm: 1, Wind: 1, Other: 1 (Note: some incidents may be assigned to more than one category).
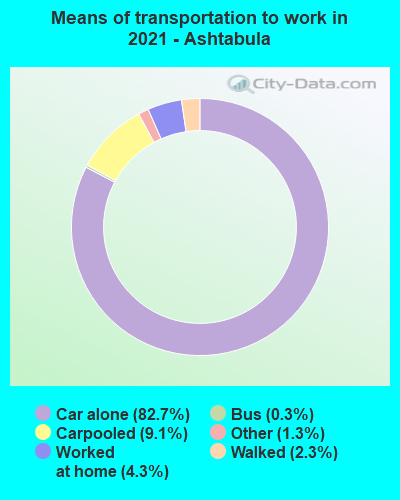
Means of transportation to work:
- Drove a car alone: 25,001 (77.3%)
- Carpooled: 3,328 (10.3%)
- Bus: 90 (0.3%)
- Taxicab, motorcycle, or other means: 787 (2.4%)
- Bicycle: 48 (0.1%)
- Walked: 605 (1.9%)
- Worked at home: 2,049 (6.3%)

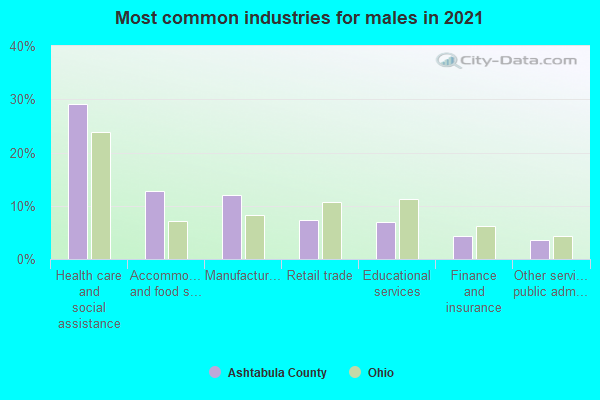
- Health care and social assistance (28%)
- Retail trade (13%)
- Manufacturing (11%)
- Educational services (10%)
- Accommodation and food services (7%)
- Finance and insurance (5%)
- Public administration (3%)
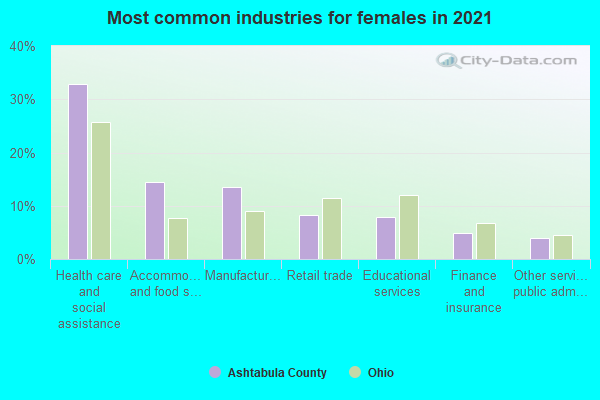
- Health care and social assistance (32%)
- Retail trade (14%)
- Manufacturing (12%)
- Educational services (11%)
- Accommodation and food services (8%)
- Finance and insurance (5%)
- Public administration (4%)
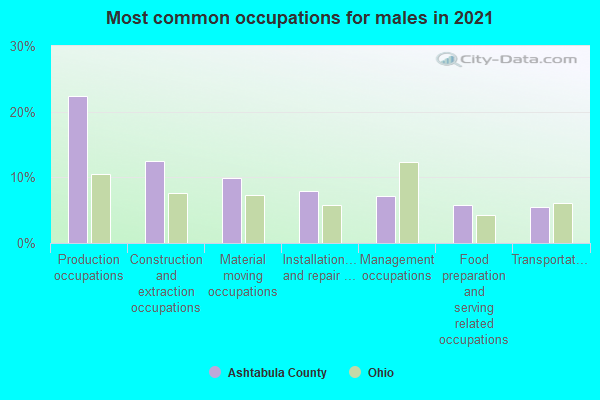
- Production occupations (19%)
- Construction and extraction occupations (9%)
- Management occupations (9%)
- Transportation occupations (9%)
- Material moving occupations (8%)
- Installation, maintenance, and repair occupations (7%)
- Office and administrative support occupations (6%)
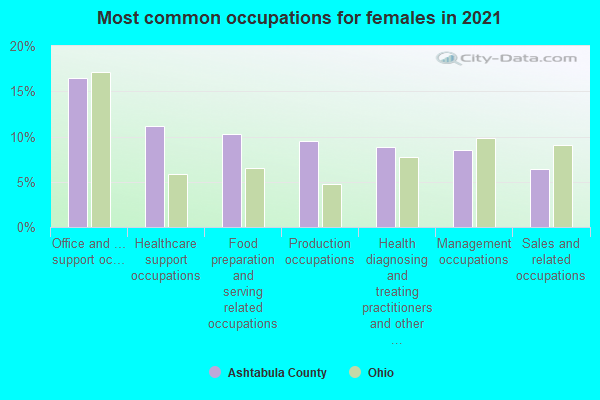
- Office and administrative support occupations (18%)
- Educational instruction, and library occupations (11%)
- Sales and related occupations (10%)
- Management occupations (9%)
- Healthcare support occupations (9%)
- Health technologists and technicians (7%)
- Food preparation and serving related occupations (6%)
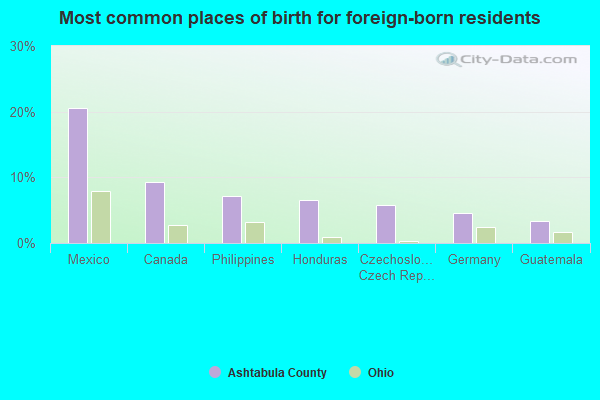
- Mexico (24%)
- Canada (12%)
- Korea (5%)
- Honduras (5%)
- Philippines (5%)
- Venezuela (5%)
- Russia (4%)
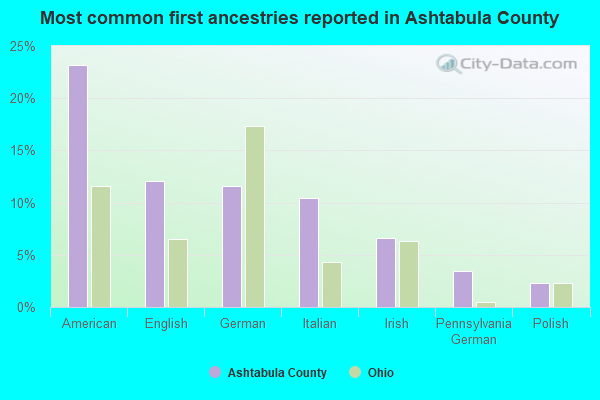
- American (19%)
- German (13%)
- English (12%)
- Italian (10%)
- Irish (7%)
- Pennsylvania German (4%)
- Polish (2%)
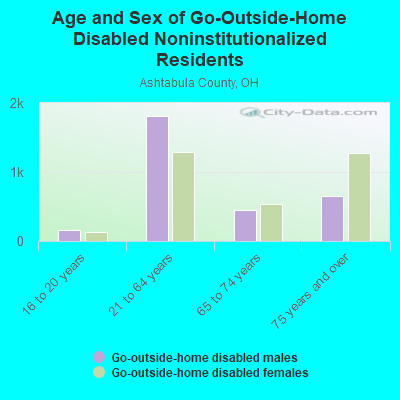
People in group quarters in Ashtabula County, Ohio in 2010:
- 1,500 people in state prisons
- 1,255 people in nursing facilities/skilled-nursing facilities
- 139 people in hospitals with patients who have no usual home elsewhere
- 112 people in group homes intended for adults
- 85 people in other noninstitutional facilities
- 36 people in local jails and other municipal confinement facilities
- 21 people in residential treatment centers for adults
- 18 people in workers' group living quarters and job corps centers
- 13 people in correctional facilities intended for juveniles
- 6 people in mental (psychiatric) hospitals and psychiatric units in other hospitals
- 4 people in emergency and transitional shelters (with sleeping facilities) for people experiencing homelessness
People in group quarters in Ashtabula County, Ohio in 2000:
- 1,218 people in nursing homes
- 134 people in other nonhousehold living situations
- 98 people in local jails and other confinement facilities (including police lockups)
- 96 people in homes for the mentally retarded
- 76 people in other group homes
- 57 people in other noninstitutional group quarters
- 35 people in hospitals or wards for drug/alcohol abuse
- 29 people in homes or halfway houses for drug/alcohol abuse
- 12 people in homes for the mentally ill
- 9 people in agriculture workers' dormitories on farms
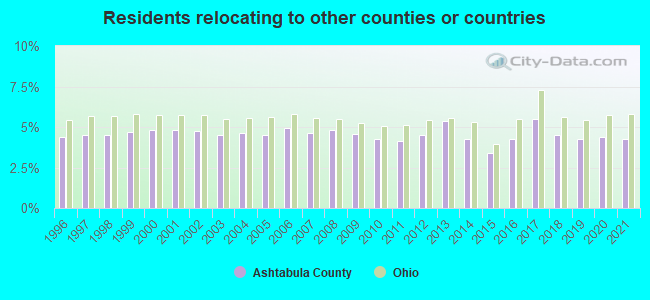
4.72% of this county's 2021 resident taxpayers lived in other counties in 2020 ($44,210 average adjusted gross income)
| Here: | 4.72% |
| Ohio average: | 5.68% |
10 or fewer of this county's residents moved from foreign countries.
2.93% relocated from other counties in Ohio ($27,109 average AGI)
1.80% relocated from other states ($17,101 average AGI)
Ashtabula County: 1.80% Ohio average: 1.92%

Top counties from which taxpayers relocated into this county between 2020 and 2021:
| from Lake County, OH | |
| from Cuyahoga County, OH | |
| from Trumbull County, OH | |
| from Geauga County, OH | |
| from Erie County, PA | |
| from Mahoning County, OH | |
| from Franklin County, OH |
4.27% of this county's 2020 resident taxpayers moved to other counties in 2021 ($40,857 average adjusted gross income)
| Here: | 4.27% |
| Ohio average: | 5.79% |
10 or fewer of this county's residents moved to foreign countries.
2.76% relocated to other counties in Ohio ($26,386 average AGI)
1.52% relocated to other states ($14,471 average AGI)
Ashtabula County: 1.52% Ohio average: 2.05%
Top counties to which taxpayers relocated from this county between 2020 and 2021:
| to Lake County, OH | |
| to Trumbull County, OH | |
| to Cuyahoga County, OH | |
| to Geauga County, OH | |
| to Erie County, PA | |
| to Mahoning County, OH | |
| to Summit County, OH |
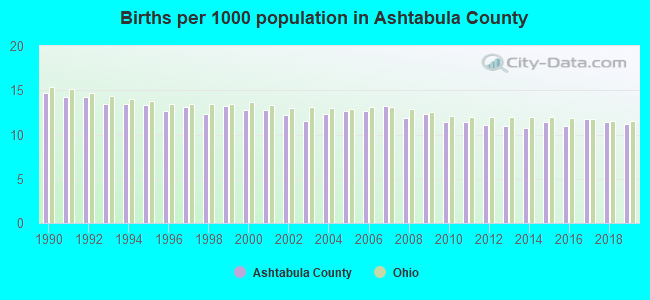
Births per 1000 population from 1990 to 1999: 13.5
Births per 1000 population from 2000 to 2009: 12.4
Births per 1000 population from 2010 to 2022: 9.4
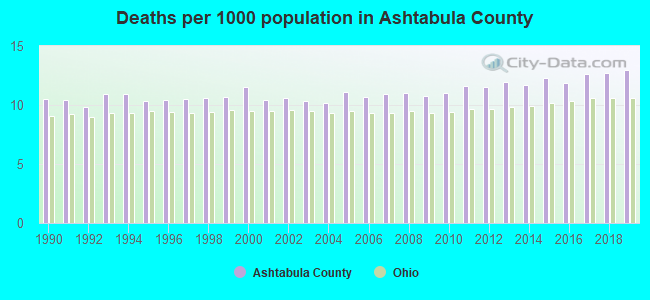
Deaths per 1000 population from 1990 to 1999: 10.5
Deaths per 1000 population from 2000 to 2009: 10.7
Deaths per 1000 population from 2010 to 2020: 12.2
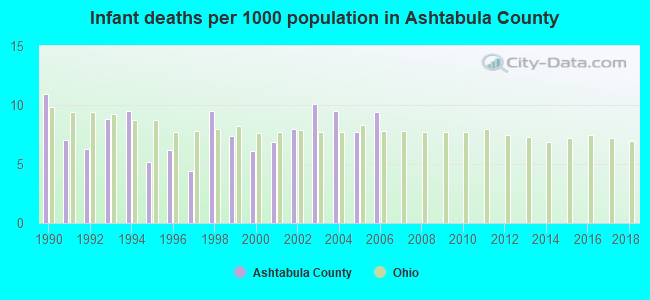
Infant deaths per 1000 live births from 1990 to 1999: 7.5
Infant deaths per 1000 live births from 2000 to 2006: 8.2
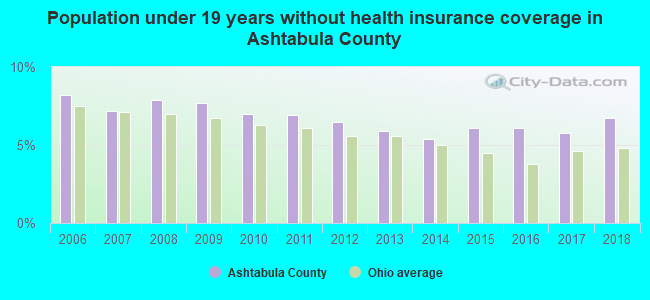
Persons under 19 years old without health insurance coverage in 2018: 6.7%

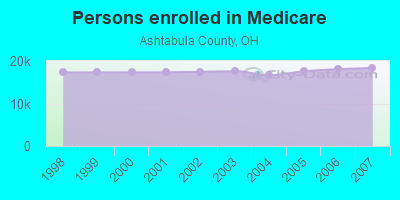
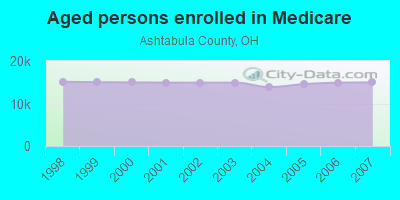
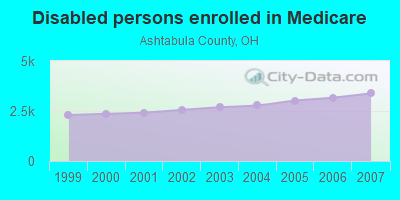
Persons enrolled in hospital insurance and/or supplemental medical insurance (Medicare) in July 1, 2007: 18,368 (14,980 aged, 3,388 disabled)
Children under 18 without health insurance coverage in 2007: 1,616 (6%)
Most common underlying causes of death in Ashtabula County, Ohio in 1999 - 2019:
- Atherosclerotic heart disease (2,645)
- Bronchus or lung, unspecified - Malignant neoplasms (1,621)
- Acute myocardial infarction, unspecified (1,377)
- Chronic obstructive pulmonary disease, unspecified (1,207)
- Unspecified dementia (824)
- Alzheimer disease, unspecified (565)
- Congestive heart failure (486)
- Stroke, not specified as haemorrhage or infarction (478)
- Pneumonia, unspecified (459)
- Septicaemia, unspecified (424)
Population without health insurance coverage in 2000: 13%
Children under 18 without health insurance coverage in 2000: 9%
Short term general hospital admissions per 100,000 population in 2004: 8,192
Short term general hospital beds per 100,000 population in 2004: 235
Emergency room visits per 100,000 population in 2004: 48,459
General practice office based MDs per 100,000 population in 2005: 1,211
Medical specialist MDs per 100,000 population in 2005: 1,046
Dentists per 100,000 population in 1998: 5
Total births per 100,000 population, July 2005 - July 2006 : 31
Total deaths per 100,000 population, July 2005 - July 2006: 89
Limited-service eating places per 100,000 population in 2005 : 13
Beer, wine & liquor stores per 100,000 population in 2005: 1
Homicides per 1,000,000 population from 2000 to 2006: 50.2. This is more than state average.
Suicides per 1,000,000 population from 2000 to 2006: 142.4. This is more than state average.
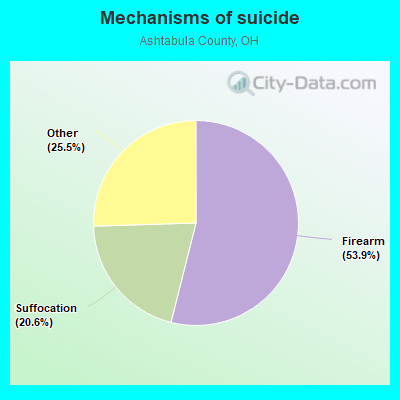
- Firearm - 76.8
- Suffocation - 29.3
- Other - 36.3
Household type by relationship:
Households: 97,014- Male householders: 18,383 (6,456 living alone), Female householders: 20,515 (5,564 living alone)
16,468 spouses (16,213 opposite-sex spouses), 3,723 unmarried partners, (3,256 opposite-sex unmarried partners), 25,830 children (23,108 natural, 763 adopted, 1,959 stepchildren), 2,441 grandchildren, 243 brothers or sisters, 746 parents, 165 foster children, 1,567 other relatives, 3,500 non-relatives
- In group quarters: 3,433
Size of family households: 11,303 2-persons, 6,037 3-persons, 3,177 4-persons, 1,897 5-persons, 779 6-persons, 386 7-or-more-persons.
Size of nonfamily households: 12,020 1-person, 2,967 2-persons, 60 3-persons, 236 4-persons, 36 6-persons.
10,740 married couples with children.
7,105 single-parent households (1,341 men, 5,764 women).
93.2% of residents of Ashtabula speak English at home.
2.3% of residents speak Spanish at home (58% speak English very well, 26% speak English well, 14% speak English not well, 1% don't speak English at all).
4.2% of residents speak other Indo-European language at home (68% speak English very well, 28% speak English well, 2% speak English not well, 2% don't speak English at all).
0.3% of residents speak Asian or Pacific Island language at home (67% speak English very well, 30% speak English well, 3% don't speak English at all).
0.2% of residents speak other language at home (83% speak English very well, 17% speak English not well).
In fiscal year 2004:
Federal Government expenditure: $541,102,000 ($5,246 per capita)
Department of Defense expenditure: $9,671,000
Federal direct payments to individuals for retirement and disability: $261,832,000
Federal other direct payments to individuals: $151,744,000
Federal direct payments not to individuals: $5,748,000
Federal grants: $95,197,000
Federal procurement contracts: $10,787,000 ($3,675,000 Department of Defense)
Federal salaries and wages: $15,795,000 ($590,000 Department of Defense)
Federal Government direct loans: $2,137,000
Federal guaranteed/insured loans: $50,386,000
Federal Government insurance: $17,143,000
Population change from April 1, 2000 to July 1, 2005:
Births: 6,455| Here: | 63 per 1000 residents |
| State: | 69 per 1000 residents |
Deaths: 5,833
| Here: | 57 per 1000 residents |
| State: | 50 per 1000 residents |
Net international migration: +227
| Here: | +2 per 1000 residents |
| State: | +7 per 1000 residents |
Net internal migration: -242
| Here: | |
| State: |
Total withdrawal of fresh water for public supply: 9.12 millions of gallons per day (7% from ground, 93% from surface)
| Here: | 6.3 |
| State: | 6.7 |
| Here: | 4.6 |
| State: | 4.4 |
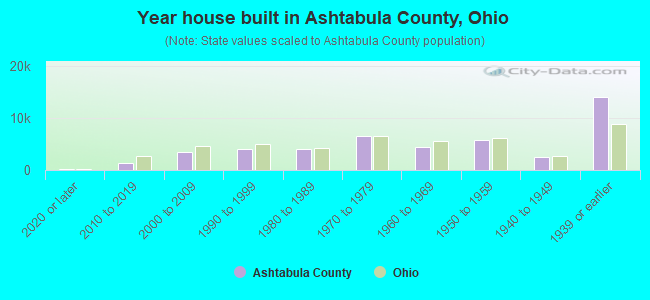
- Year house built in Ashtabula County, Ohio
- 3682020 or later
- 1,4692010 to 2019
- 3,6672000 to 2009
- 4,7001990 to 1999
- 3,1611980 to 1989
- 6,1181970 to 1979
- 5,3841960 to 1969
- 5,0921950 to 1959
- 2,6201940 to 1949
- 13,9101939 or earlier

- Rooms in owner-occupied houses in Ashtabula County, Ohio
- 831 room
- 472 rooms
- 8193 rooms
- 2,9144 rooms
- 5,6965 rooms
- 5,9986 rooms
- 4,4567 rooms
- 4,3228 rooms
- 4,5099+ rooms
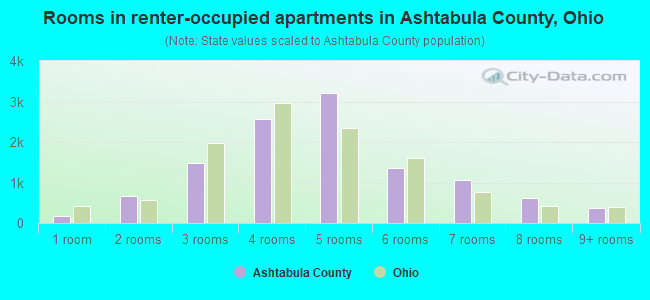
- Rooms in renter-occupied apartments in Ashtabula County, Ohio
- 3661 room
- 2482 rooms
- 1,2513 rooms
- 2,8844 rooms
- 2,1765 rooms
- 1,4896 rooms
- 9837 rooms
- 3208 rooms
- 3379+ rooms
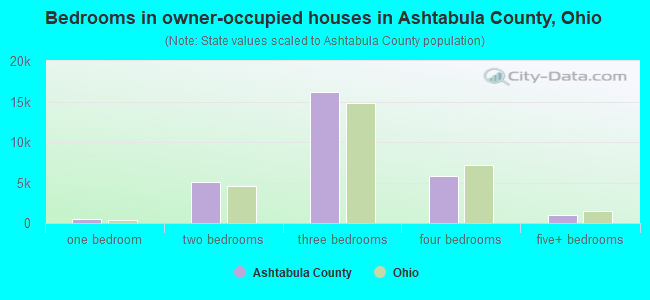
- Bedrooms in owner-occupied houses in Ashtabula County, Ohio
- 83no bedroom
- 5981 bedroom
- 6,4792 bedrooms
- 14,2583 bedrooms
- 6,0274 bedrooms
- 1,3995+ bedrooms
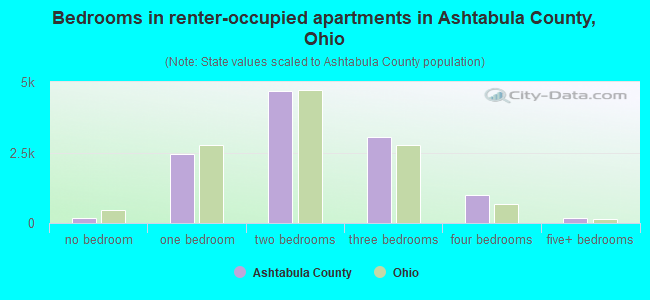
- Bedrooms in renter-occupied apartments in Ashtabula County, Ohio
- 497no bedroom
- 1,7911 bedroom
- 4,4912 bedrooms
- 2,6333 bedrooms
- 4624 bedrooms
- 1805+ bedrooms
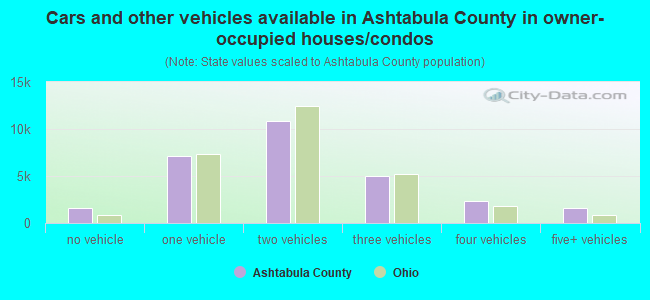
- Cars and other vehicles available in Ashtabula County in owner-occupied houses/condos
- 1,202no vehicle
- 8,2071 vehicle
- 11,5692 vehicles
- 5,1533 vehicles
- 2,1834 vehicles
- 5305+ vehicles
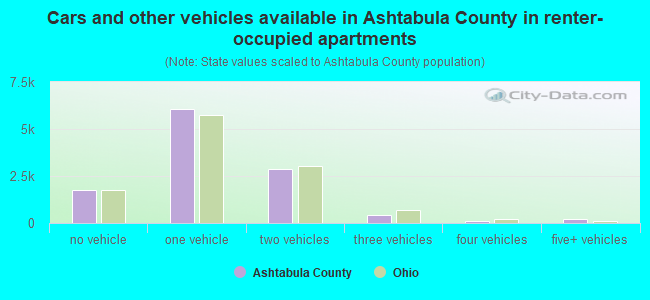
- Cars and other vehicles available in Ashtabula County in renter-occupied apartments
- 1,334no vehicle
- 5,6791 vehicle
- 2,1352 vehicles
- 6973 vehicles
- 1664 vehicles
- 435+ vehicles
88.2% of Ashtabula County residents lived in the same house 1 years ago.
Out of people who lived in different houses, 36% lived in this county.
Out of people who lived in different counties, 57% lived in Ohio.
| Ashtabula County: | 88.2% |
| State average: | 87.8% |
Place of birth for U.S.-born residents:
- This state: 76,239
- Other state: 18,964
- Northeast: 9,714
- Midwest: 1,871
- South: 5,729
- West: 1,650
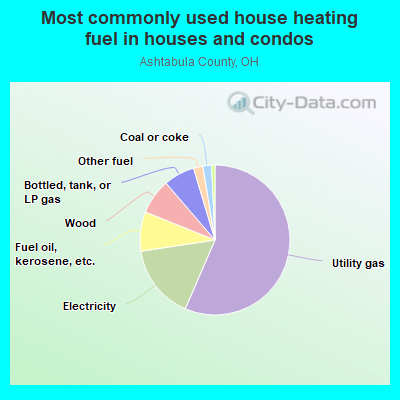
- 59.2%Utility gas
- 14.5%Electricity
- 8.6%Bottled, tank, or LP gas
- 7.2%Fuel oil, kerosene, etc.
- 6.1%Wood
- 3.6%Other fuel
- 0.4%Coal or coke
- 0.4%No fuel used
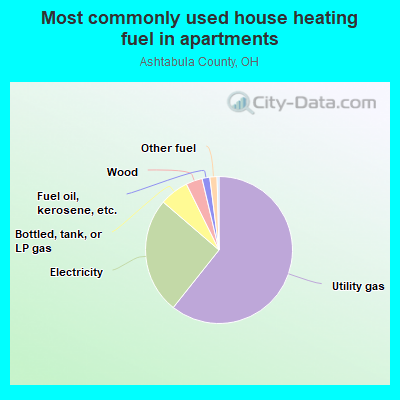
- 55.0%Utility gas
- 32.7%Electricity
- 3.8%Bottled, tank, or LP gas
- 3.1%Other fuel
- 2.0%Wood
- 1.9%Fuel oil, kerosene, etc.
- 1.5%Coal or coke
Private vs. public school enrollment:
| Here: | 12.1% |
| Ohio: | 16.0% |
| Here: | 16.4% |
| Ohio: | 13.1% |
| Here: | 11.2% |
| Ohio: | 22.3% |


Ashtabula County government finances - Expenditure in 2020:
- Bond Funds - Cash and Securities: $2,972,000
Cash and Securities: $2,759,000
- Charges - Other: $11,316,000
Other: $10,791,000
Sewerage: $2,841,000
Sewerage: $2,710,000
Regular Highways: $432,000
Regular Highways: $412,000
Solid Waste Management: $355,000
Solid Waste Management: $339,000
Parks and Recreation: $142,000
Parks and Recreation: $136,000
Air Transportation: $115,000
Air Transportation: $110,000
- Construction - Parks and Recreation: $2,635,000
Parks and Recreation: $1,338,000
Sewerage: $1,266,000
Sewerage: $643,000
Water Utilities: $61,000
Water Utilities: $61,000
- Current Operations - Public Welfare - Other: $22,922,000
Public Welfare - Other: $21,321,000
Judicial and Legal Services: $11,670,000
Judicial and Legal Services: $10,855,000
Public Welfare Institutions: $10,507,000
Public Welfare Institutions: $9,773,000
General - Other: $9,198,000
General - Other: $8,556,000
Police Protection: $7,839,000
Police Protection: $7,291,000
Regular Highways: $6,910,000
Regular Highways: $6,427,000
Health - Other: $4,558,000
Health - Other: $4,240,000
Financial Administration: $3,710,000
Financial Administration: $3,451,000
Sewerage: $2,804,000
Sewerage: $2,608,000
Water Utilities: $2,526,000
Water Utilities: $2,526,000
Central Staff Services: $1,570,000
Housing and Community Development: $1,558,000
Central Staff Services: $1,461,000
Housing and Community Development: $1,449,000
Correctional Institutions: $1,257,000
Air Transportation: $1,239,000
Correctional Institutions: $1,169,000
Air Transportation: $1,153,000
Protective Inspection and Regulation - Other: $544,000
Protective Inspection and Regulation - Other: $506,000
Natural Resources - Other: $302,000
Natural Resources - Other: $281,000
Solid Waste Management: $185,000
Solid Waste Management: $172,000
Corrections - Other: $164,000
Corrections - Other: $152,000
Parks and Recreation: $126,000
Parks and Recreation: $117,000
- Federal Intergovernmental - Air Transportation: $9,208,000
Air Transportation: $9,208,000
Housing and Community Development: $1,260,000
Housing and Community Development: $1,260,000
Other: $268,000
Other: $268,000
- General - Interest on Debt: $791,000
Interest on Debt: $765,000
- Intergovernmental to State - Sewerage: $727,000
Sewerage: $727,000
General - Other: $129,000
General - Other: $129,000
- Long Term Debt - Beginning Outstanding - Unspecified Public Purpose: $26,584,000
Outstanding Unspecified Public Purpose: $26,053,000
Beginning Outstanding - Unspecified Public Purpose: $24,201,000
Outstanding Unspecified Public Purpose: $22,349,000
Retired Unspecified Public Purpose: $1,852,000
Retired Unspecified Public Purpose: $1,852,000
Issue, Unspecified Public Purpose: $1,321,000
- Miscellaneous - General Revenue - Other: $6,662,000
General Revenue - Other: $4,024,000
Special Assessments: $2,993,000
Special Assessments: $1,808,000
Fines and Forfeits: $1,109,000
Interest Earnings: $1,088,000
Fines and Forfeits: $670,000
Interest Earnings: $657,000
Donations From Private Sources: $56,000
Donations From Private Sources: $34,000
Sale of Property: $3,000
Sale of Property: $2,000
- Other Capital Outlay - General - Other: $375,000
General - Other: $338,000
Public Welfare - Other: $54,000
Public Welfare - Other: $48,000
- Other Funds - Cash and Securities: $53,891,000
Cash and Securities: $50,027,000
- Revenue - Water Utilities: $4,237,000
Water Utilities: $4,237,000
- Sinking Funds - Cash and Securities: $461,000
Cash and Securities: $428,000
- State Intergovernmental - Public Welfare: $25,222,000
Public Welfare: $21,894,000
Other: $8,475,000
Other: $7,357,000
Health and Hospitals: $7,261,000
Highways: $6,885,000
Health and Hospitals: $6,303,000
Highways: $5,976,000
General Local Government Support: $4,701,000
General Local Government Support: $4,081,000
Sewerage: $150,000
Sewerage: $130,000
Water Utilities: $24,000
Water Utilities: $21,000
- Tax - Property: $18,722,000
Property: $17,419,000
General Sales and Gross Receipts: $11,451,000
General Sales and Gross Receipts: $10,654,000
Other License: $202,000
Other License: $188,000
Public Utilities Sales: $54,000
Public Utilities Sales: $50,000
- Total Salaries and Wages: $30,630,000
: $27,747,000
- Water Utilities - Interest on Debt: $568,000
Interest on Debt: $568,000
Ashtabula County government finances - Revenue in 2020:
- Bond Funds - Cash and Securities: $2,972,000
Cash and Securities: $2,759,000
- Charges - Other: $11,316,000
Other: $10,791,000
Sewerage: $2,841,000
Sewerage: $2,710,000
Regular Highways: $432,000
Regular Highways: $412,000
Solid Waste Management: $355,000
Solid Waste Management: $339,000
Parks and Recreation: $142,000
Parks and Recreation: $136,000
Air Transportation: $115,000
Air Transportation: $110,000
- Construction - Parks and Recreation: $2,635,000
Parks and Recreation: $1,338,000
Sewerage: $1,266,000
Sewerage: $643,000
Water Utilities: $61,000
Water Utilities: $61,000
- Current Operations - Public Welfare - Other: $22,922,000
Public Welfare - Other: $21,321,000
Judicial and Legal Services: $11,670,000
Judicial and Legal Services: $10,855,000
Public Welfare Institutions: $10,507,000
Public Welfare Institutions: $9,773,000
General - Other: $9,198,000
General - Other: $8,556,000
Police Protection: $7,839,000
Police Protection: $7,291,000
Regular Highways: $6,910,000
Regular Highways: $6,427,000
Health - Other: $4,558,000
Health - Other: $4,240,000
Financial Administration: $3,710,000
Financial Administration: $3,451,000
Sewerage: $2,804,000
Sewerage: $2,608,000
Water Utilities: $2,526,000
Water Utilities: $2,526,000
Central Staff Services: $1,570,000
Housing and Community Development: $1,558,000
Central Staff Services: $1,461,000
Housing and Community Development: $1,449,000
Correctional Institutions: $1,257,000
Air Transportation: $1,239,000
Correctional Institutions: $1,169,000
Air Transportation: $1,153,000
Protective Inspection and Regulation - Other: $544,000
Protective Inspection and Regulation - Other: $506,000
Natural Resources - Other: $302,000
Natural Resources - Other: $281,000
Solid Waste Management: $185,000
Solid Waste Management: $172,000
Corrections - Other: $164,000
Corrections - Other: $152,000
Parks and Recreation: $126,000
Parks and Recreation: $117,000
- Federal Intergovernmental - Air Transportation: $9,208,000
Air Transportation: $9,208,000
Housing and Community Development: $1,260,000
Housing and Community Development: $1,260,000
Other: $268,000
Other: $268,000
- General - Interest on Debt: $791,000
Interest on Debt: $765,000
- Intergovernmental to State - Sewerage: $727,000
Sewerage: $727,000
General - Other: $129,000
General - Other: $129,000
- Long Term Debt - Beginning Outstanding - Unspecified Public Purpose: $26,584,000
Outstanding Unspecified Public Purpose: $26,053,000
Beginning Outstanding - Unspecified Public Purpose: $24,201,000
Outstanding Unspecified Public Purpose: $22,349,000
Retired Unspecified Public Purpose: $1,852,000
Retired Unspecified Public Purpose: $1,852,000
Issue, Unspecified Public Purpose: $1,321,000
- Miscellaneous - General Revenue - Other: $6,662,000
General Revenue - Other: $4,024,000
Special Assessments: $2,993,000
Special Assessments: $1,808,000
Fines and Forfeits: $1,109,000
Interest Earnings: $1,088,000
Fines and Forfeits: $670,000
Interest Earnings: $657,000
Donations From Private Sources: $56,000
Donations From Private Sources: $34,000
Sale of Property: $3,000
Sale of Property: $2,000
- Other Capital Outlay - General - Other: $375,000
General - Other: $338,000
Public Welfare - Other: $54,000
Public Welfare - Other: $48,000
- Other Funds - Cash and Securities: $53,891,000
Cash and Securities: $50,027,000
- Revenue - Water Utilities: $4,237,000
Water Utilities: $4,237,000
- Sinking Funds - Cash and Securities: $461,000
Cash and Securities: $428,000
- State Intergovernmental - Public Welfare: $25,222,000
Public Welfare: $21,894,000
Other: $8,475,000
Other: $7,357,000
Health and Hospitals: $7,261,000
Highways: $6,885,000
Health and Hospitals: $6,303,000
Highways: $5,976,000
General Local Government Support: $4,701,000
General Local Government Support: $4,081,000
Sewerage: $150,000
Sewerage: $130,000
Water Utilities: $24,000
Water Utilities: $21,000
- Tax - Property: $18,722,000
Property: $17,419,000
General Sales and Gross Receipts: $11,451,000
General Sales and Gross Receipts: $10,654,000
Other License: $202,000
Other License: $188,000
Public Utilities Sales: $54,000
Public Utilities Sales: $50,000
- Total Salaries and Wages: $30,630,000
: $27,747,000
- Water Utilities - Interest on Debt: $568,000
Interest on Debt: $568,000
Ashtabula County government finances - Debt in 2020:
- Bond Funds - Cash and Securities: $2,972,000
Cash and Securities: $2,759,000
- Charges - Other: $11,316,000
Other: $10,791,000
Sewerage: $2,841,000
Sewerage: $2,710,000
Regular Highways: $432,000
Regular Highways: $412,000
Solid Waste Management: $355,000
Solid Waste Management: $339,000
Parks and Recreation: $142,000
Parks and Recreation: $136,000
Air Transportation: $115,000
Air Transportation: $110,000
- Construction - Parks and Recreation: $2,635,000
Parks and Recreation: $1,338,000
Sewerage: $1,266,000
Sewerage: $643,000
Water Utilities: $61,000
Water Utilities: $61,000
- Current Operations - Public Welfare - Other: $22,922,000
Public Welfare - Other: $21,321,000
Judicial and Legal Services: $11,670,000
Judicial and Legal Services: $10,855,000
Public Welfare Institutions: $10,507,000
Public Welfare Institutions: $9,773,000
General - Other: $9,198,000
General - Other: $8,556,000
Police Protection: $7,839,000
Police Protection: $7,291,000
Regular Highways: $6,910,000
Regular Highways: $6,427,000
Health - Other: $4,558,000
Health - Other: $4,240,000
Financial Administration: $3,710,000
Financial Administration: $3,451,000
Sewerage: $2,804,000
Sewerage: $2,608,000
Water Utilities: $2,526,000
Water Utilities: $2,526,000
Central Staff Services: $1,570,000
Housing and Community Development: $1,558,000
Central Staff Services: $1,461,000
Housing and Community Development: $1,449,000
Correctional Institutions: $1,257,000
Air Transportation: $1,239,000
Correctional Institutions: $1,169,000
Air Transportation: $1,153,000
Protective Inspection and Regulation - Other: $544,000
Protective Inspection and Regulation - Other: $506,000
Natural Resources - Other: $302,000
Natural Resources - Other: $281,000
Solid Waste Management: $185,000
Solid Waste Management: $172,000
Corrections - Other: $164,000
Corrections - Other: $152,000
Parks and Recreation: $126,000
Parks and Recreation: $117,000
- Federal Intergovernmental - Air Transportation: $9,208,000
Air Transportation: $9,208,000
Housing and Community Development: $1,260,000
Housing and Community Development: $1,260,000
Other: $268,000
Other: $268,000
- General - Interest on Debt: $791,000
Interest on Debt: $765,000
- Intergovernmental to State - Sewerage: $727,000
Sewerage: $727,000
General - Other: $129,000
General - Other: $129,000
- Long Term Debt - Beginning Outstanding - Unspecified Public Purpose: $26,584,000
Outstanding Unspecified Public Purpose: $26,053,000
Beginning Outstanding - Unspecified Public Purpose: $24,201,000
Outstanding Unspecified Public Purpose: $22,349,000
Retired Unspecified Public Purpose: $1,852,000
Retired Unspecified Public Purpose: $1,852,000
Issue, Unspecified Public Purpose: $1,321,000
- Miscellaneous - General Revenue - Other: $6,662,000
General Revenue - Other: $4,024,000
Special Assessments: $2,993,000
Special Assessments: $1,808,000
Fines and Forfeits: $1,109,000
Interest Earnings: $1,088,000
Fines and Forfeits: $670,000
Interest Earnings: $657,000
Donations From Private Sources: $56,000
Donations From Private Sources: $34,000
Sale of Property: $3,000
Sale of Property: $2,000
- Other Capital Outlay - General - Other: $375,000
General - Other: $338,000
Public Welfare - Other: $54,000
Public Welfare - Other: $48,000
- Other Funds - Cash and Securities: $53,891,000
Cash and Securities: $50,027,000
- Revenue - Water Utilities: $4,237,000
Water Utilities: $4,237,000
- Sinking Funds - Cash and Securities: $461,000
Cash and Securities: $428,000
- State Intergovernmental - Public Welfare: $25,222,000
Public Welfare: $21,894,000
Other: $8,475,000
Other: $7,357,000
Health and Hospitals: $7,261,000
Highways: $6,885,000
Health and Hospitals: $6,303,000
Highways: $5,976,000
General Local Government Support: $4,701,000
General Local Government Support: $4,081,000
Sewerage: $150,000
Sewerage: $130,000
Water Utilities: $24,000
Water Utilities: $21,000
- Tax - Property: $18,722,000
Property: $17,419,000
General Sales and Gross Receipts: $11,451,000
General Sales and Gross Receipts: $10,654,000
Other License: $202,000
Other License: $188,000
Public Utilities Sales: $54,000
Public Utilities Sales: $50,000
- Total Salaries and Wages: $30,630,000
: $27,747,000
- Water Utilities - Interest on Debt: $568,000
Interest on Debt: $568,000
Ashtabula County government finances - Cash and Securities in 2020:
- Bond Funds - Cash and Securities: $2,972,000
Cash and Securities: $2,759,000
- Charges - Other: $11,316,000
Other: $10,791,000
Sewerage: $2,841,000
Sewerage: $2,710,000
Regular Highways: $432,000
Regular Highways: $412,000
Solid Waste Management: $355,000
Solid Waste Management: $339,000
Parks and Recreation: $142,000
Parks and Recreation: $136,000
Air Transportation: $115,000
Air Transportation: $110,000
- Construction - Parks and Recreation: $2,635,000
Parks and Recreation: $1,338,000
Sewerage: $1,266,000
Sewerage: $643,000
Water Utilities: $61,000
Water Utilities: $61,000
- Current Operations - Public Welfare - Other: $22,922,000
Public Welfare - Other: $21,321,000
Judicial and Legal Services: $11,670,000
Judicial and Legal Services: $10,855,000
Public Welfare Institutions: $10,507,000
Public Welfare Institutions: $9,773,000
General - Other: $9,198,000
General - Other: $8,556,000
Police Protection: $7,839,000
Police Protection: $7,291,000
Regular Highways: $6,910,000
Regular Highways: $6,427,000
Health - Other: $4,558,000
Health - Other: $4,240,000
Financial Administration: $3,710,000
Financial Administration: $3,451,000
Sewerage: $2,804,000
Sewerage: $2,608,000
Water Utilities: $2,526,000
Water Utilities: $2,526,000
Central Staff Services: $1,570,000
Housing and Community Development: $1,558,000
Central Staff Services: $1,461,000
Housing and Community Development: $1,449,000
Correctional Institutions: $1,257,000
Air Transportation: $1,239,000
Correctional Institutions: $1,169,000
Air Transportation: $1,153,000
Protective Inspection and Regulation - Other: $544,000
Protective Inspection and Regulation - Other: $506,000
Natural Resources - Other: $302,000
Natural Resources - Other: $281,000
Solid Waste Management: $185,000
Solid Waste Management: $172,000
Corrections - Other: $164,000
Corrections - Other: $152,000
Parks and Recreation: $126,000
Parks and Recreation: $117,000
- Federal Intergovernmental - Air Transportation: $9,208,000
Air Transportation: $9,208,000
Housing and Community Development: $1,260,000
Housing and Community Development: $1,260,000
Other: $268,000
Other: $268,000
- General - Interest on Debt: $791,000
Interest on Debt: $765,000
- Intergovernmental to State - Sewerage: $727,000
Sewerage: $727,000
General - Other: $129,000
General - Other: $129,000
- Long Term Debt - Beginning Outstanding - Unspecified Public Purpose: $26,584,000
Outstanding Unspecified Public Purpose: $26,053,000
Beginning Outstanding - Unspecified Public Purpose: $24,201,000
Outstanding Unspecified Public Purpose: $22,349,000
Retired Unspecified Public Purpose: $1,852,000
Retired Unspecified Public Purpose: $1,852,000
Issue, Unspecified Public Purpose: $1,321,000
- Miscellaneous - General Revenue - Other: $6,662,000
General Revenue - Other: $4,024,000
Special Assessments: $2,993,000
Special Assessments: $1,808,000
Fines and Forfeits: $1,109,000
Interest Earnings: $1,088,000
Fines and Forfeits: $670,000
Interest Earnings: $657,000
Donations From Private Sources: $56,000
Donations From Private Sources: $34,000
Sale of Property: $3,000
Sale of Property: $2,000
- Other Capital Outlay - General - Other: $375,000
General - Other: $338,000
Public Welfare - Other: $54,000
Public Welfare - Other: $48,000
- Other Funds - Cash and Securities: $53,891,000
Cash and Securities: $50,027,000
- Revenue - Water Utilities: $4,237,000
Water Utilities: $4,237,000
- Sinking Funds - Cash and Securities: $461,000
Cash and Securities: $428,000
- State Intergovernmental - Public Welfare: $25,222,000
Public Welfare: $21,894,000
Other: $8,475,000
Other: $7,357,000
Health and Hospitals: $7,261,000
Highways: $6,885,000
Health and Hospitals: $6,303,000
Highways: $5,976,000
General Local Government Support: $4,701,000
General Local Government Support: $4,081,000
Sewerage: $150,000
Sewerage: $130,000
Water Utilities: $24,000
Water Utilities: $21,000
- Tax - Property: $18,722,000
Property: $17,419,000
General Sales and Gross Receipts: $11,451,000
General Sales and Gross Receipts: $10,654,000
Other License: $202,000
Other License: $188,000
Public Utilities Sales: $54,000
Public Utilities Sales: $50,000
- Total Salaries and Wages: $30,630,000
: $27,747,000
- Water Utilities - Interest on Debt: $568,000
Interest on Debt: $568,000
Supplemental Security Income (SSI) in 2006:
- Total number of recipients: 2,540
- Number of aged recipients: 78
- Number of blind and disabled recipients: 2,462
- Number of recipients under 18: 423
- Number of recipients between 18 and 64: 1,851
- Number of recipients older than 64: 266
- Number of recipients also receiving OASDI: 677
- Amount of payments (thousands of dollars): 1,203
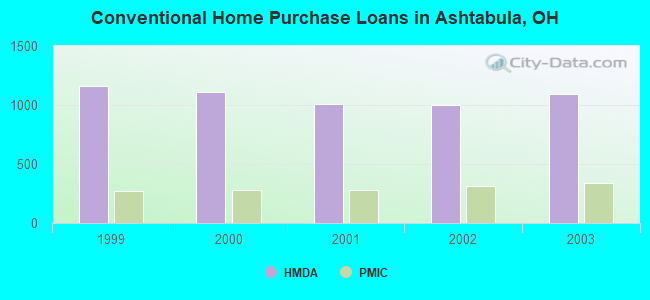
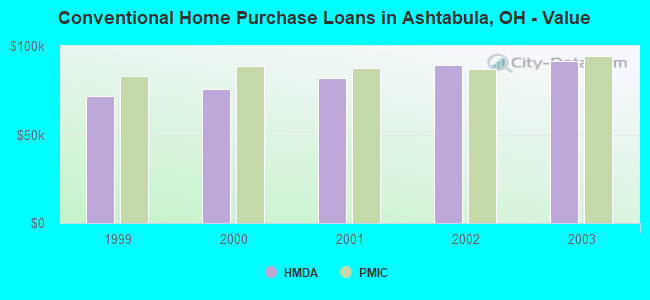
| Home Mortgage Disclosure Act Aggregated Statistics For Year 2003 (Based on 21 full tracts) | ||||||||||||
| A) FHA, FSA/RHS & VA Home Purchase Loans | B) Conventional Home Purchase Loans | C) Refinancings | D) Home Improvement Loans | E) Loans on Dwellings For 5+ Families | F) Non-occupant Loans on < 5 Family Dwellings (A B C & D) | |||||||
|---|---|---|---|---|---|---|---|---|---|---|---|---|
| Number | Average Value | Number | Average Value | Number | Average Value | Number | Average Value | Number | Average Value | Number | Average Value | |
| LOANS ORIGINATED | 212 | $95,854 | 1,094 | $91,729 | 4,182 | $89,009 | 520 | $23,725 | 3 | $112,667 | 444 | $67,613 |
| APPLICATIONS APPROVED, NOT ACCEPTED | 9 | $109,556 | 133 | $81,248 | 722 | $92,511 | 84 | $23,488 | 0 | $0 | 53 | $70,736 |
| APPLICATIONS DENIED | 34 | $105,176 | 282 | $81,050 | 1,959 | $90,107 | 372 | $20,024 | 0 | $0 | 131 | $64,885 |
| APPLICATIONS WITHDRAWN | 21 | $127,810 | 112 | $95,643 | 1,206 | $98,907 | 49 | $30,673 | 0 | $0 | 48 | $76,396 |
| FILES CLOSED FOR INCOMPLETENESS | 7 | $83,571 | 54 | $87,000 | 266 | $102,139 | 11 | $27,364 | 4 | $210,750 | 17 | $65,588 |
| Private Mortgage Insurance Companies Aggregated Statistics For Year 2003 (Based on 21 full tracts) | ||||||
| A) Conventional Home Purchase Loans | B) Refinancings | C) Non-occupant Loans on < 5 Family Dwellings (A & B) | ||||
|---|---|---|---|---|---|---|
| Number | Average Value | Number | Average Value | Number | Average Value | |
| LOANS ORIGINATED | 338 | $94,151 | 361 | $107,784 | 52 | $59,404 |
| APPLICATIONS APPROVED, NOT ACCEPTED | 57 | $94,070 | 148 | $111,027 | 17 | $85,176 |
| APPLICATIONS DENIED | 5 | $77,400 | 11 | $92,636 | 4 | $69,500 |
| APPLICATIONS WITHDRAWN | 16 | $75,938 | 42 | $110,857 | 5 | $95,600 |
| FILES CLOSED FOR INCOMPLETENESS | 3 | $72,000 | 1 | $117,000 | 1 | $49,000 |
| Most common first names in Ashtabula County, OH among deceased individuals | ||
| Name | Count | Lived (average) |
|---|---|---|
| John | 811 | 75.0 years |
| Mary | 799 | 79.4 years |
| William | 613 | 73.0 years |
| Robert | 551 | 69.7 years |
| Charles | 428 | 73.3 years |
| James | 427 | 71.3 years |
| Helen | 385 | 78.0 years |
| George | 372 | 74.2 years |
| Joseph | 339 | 75.3 years |
| Margaret | 326 | 78.0 years |
| Most common last names in Ashtabula County, OH among deceased individuals | ||
| Last name | Count | Lived (average) |
|---|---|---|
| Smith | 253 | 77.2 years |
| Johnson | 211 | 76.4 years |
| Miller | 171 | 73.5 years |
| Brown | 151 | 75.1 years |
| Williams | 144 | 75.4 years |
| Hall | 116 | 71.4 years |
| Anderson | 110 | 76.9 years |
| Davis | 93 | 75.3 years |
| Jones | 86 | 73.3 years |
| Taylor | 70 | 74.7 years |
| Businesses in Ashtabula County, OH | ||||
| Name | Count | Name | Count | |
|---|---|---|---|---|
| AT&T | 1 | Kmart | 1 | |
| Ace Hardware | 1 | Lane Furniture | 3 | |
| Advance Auto Parts | 1 | Little Caesars Pizza | 1 | |
| Applebee's | 1 | Long John Silver's | 1 | |
| Arby's | 1 | Lowe's | 1 | |
| AutoZone | 4 | MasterBrand Cabinets | 5 | |
| Baskin-Robbins | 1 | McDonald's | 7 | |
| Bath & Body Works | 1 | Motel 6 | 1 | |
| Buffalo Wild Wings | 1 | Nike | 3 | |
| Burger King | 4 | OfficeMax | 1 | |
| CVS | 3 | Payless | 1 | |
| Chevrolet | 4 | Penske | 1 | |
| Circle K | 12 | Pizza Hut | 2 | |
| Comfort Inn | 1 | Quiznos | 1 | |
| Curves | 2 | RadioShack | 2 | |
| Dairy Queen | 6 | Red Lobster | 1 | |
| Days Inn | 1 | Rite Aid | 5 | |
| Deb | 1 | Sears | 3 | |
| Decora Cabinetry | 2 | Sleep Inn | 1 | |
| Dennys | 1 | Steak 'n Shake | 1 | |
| Domino's Pizza | 1 | Subway | 12 | |
| Dunkin Donuts | 1 | T-Mobile | 2 | |
| Fashion Bug | 1 | Taco Bell | 1 | |
| FedEx | 8 | Toyota | 1 | |
| GNC | 6 | True Value | 3 | |
| GameStop | 1 | U-Haul | 7 | |
| H&R Block | 5 | UPS | 7 | |
| Hardee's | 1 | Verizon Wireless | 2 | |
| Holiday Inn | 1 | Waffle House | 1 | |
| Home Depot | 1 | Walgreens | 1 | |
| Honda | 1 | Walmart | 1 | |
| Hyundai | 1 | Wendy's | 3 | |
| JCPenney | 1 | YMCA | 1 | |
| KFC | 2 | |||
Ashtabula County on our top lists:
- #50 on the list of "Top 101 counties with the lowest percentage of residents relocating from other counties between 2010 and 2011 (pop. 50,000+)"
- #65 on the list of "Top 101 counties with the lowest percentage of residents relocating to other counties in 2011 (pop. 50,000+)"
- #82 on the list of "Top 101 counties with the lowest percentage of residents relocating from other counties between 2010 and 2011"
- #101 on the list of "Top 101 counties with the lowest Sulfur Oxides Annual air pollution readings in 2012 (µg/m3)"