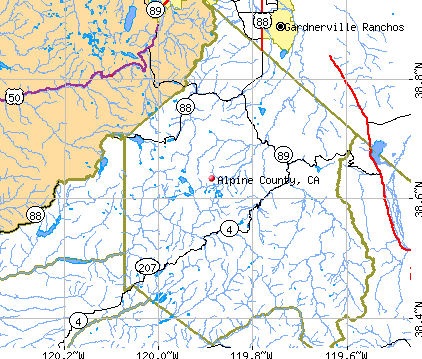
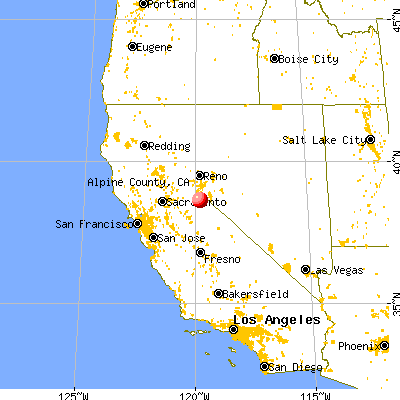
Alpine County, California (CA)
County owner-occupied free and clear houses and condos in 2010: 147
County owner-occupied houses and condos in 2000: 328
Renter-occupied apartments: 140 (it was 155 in 2000)
| % of renters here: | 32% |
| State: | 44% |
Land area: 739 sq. mi.
Water area: 4.6 sq. mi.
Population density: 2 people per square mile (very low).
Industries providing employment: Arts, entertainment, recreation, accommodation and food services (21.7%), Retail trade (20.3%), Educational, health and social services (20.0%).
Type of workers:
- Private wage or salary: 72%
- Government: 22%
- Self-employed, not incorporated: 5%
- Unpaid family work: 0%
- OSM Map
- General Map
- Google Map
- MSN Map

- 83657.9%White Non-Hispanic Alone
- 32722.7%American Indian and Alaska Native alone
- 21414.8%Hispanic or Latino
- 553.8%Two or more races
- 80.6%Some other race alone
- 30.2%Asian alone

| Median resident age: | 43.7 years |
| California median age: | 37.9 years |
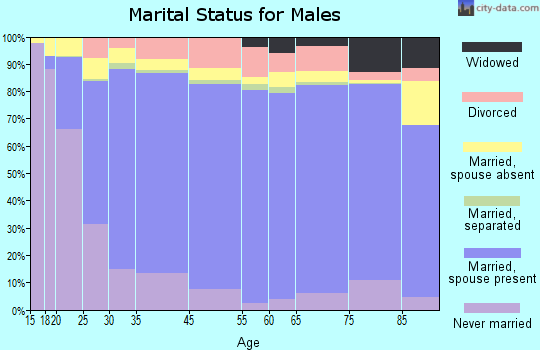
| Males: 874 | |
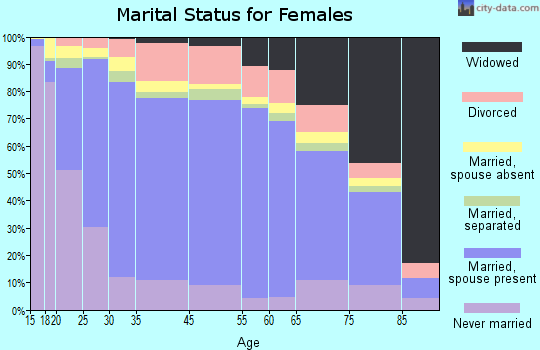
| Females: 628 |


| Alpine County: | 2.0 people |
| California: | 3 people |
Estimated median household income in 2022: $100,735 ($41,875 in 1999)
| This county: | $100,735 |
| California: | $91,551 |
Median contract rent in 2022 for apartments: $672
| This county: | $672 |
| State: | $1719 |
Estimated median house or condo value in 2022: $503,725 (it was $181,000 in 2000)
| Alpine: | $503,725 |
| California: | $715,900 |
Median monthly housing costs for homes and condos with a mortgage: $2,326
Median monthly housing costs for units without a mortgage: $648
Institutionalized population: 0
Crime in 2020 (reported by the sheriff's office or county police, not the county total):
- Murders: 0
- Rapes: 0
- Robberies: 0
- Assaults: 19
- Burglaries: 4
- Thefts: 9
- Auto thefts: 0
Crime in 2019 (reported by the sheriff's office or county police, not the county total):
- Murders: 0
- Rapes: 2
- Robberies: 0
- Assaults: 11
- Burglaries: 12
- Thefts: 14
- Auto thefts: 3
Single-family new house construction building permits:
- 2022: 4 buildings, average cost: $618,700
- 2021: 12 buildings, average cost: $512,700
- 2020: 8 buildings, average cost: $287,300
- 2019: 5 buildings, average cost: $462,700
- 2018: 4 buildings, average cost: $314,200
- 2017: 9 buildings, average cost: $374,300
- 2016: 2 buildings, average cost: $214,800
- 2015: 4 buildings, average cost: $488,300
- 2014: 3 buildings, average cost: $495,200
- 2013: 0 buildings
- 2012: 1 building, cost: $295,800
- 2011: 3 buildings, average cost: $541,700
- 2010: 4 buildings, average cost: $309,200
- 2009: 7 buildings, average cost: $332,100
- 2008: 8 buildings, average cost: $522,000
- 2007: 15 buildings, average cost: $715,200
- 2006: 31 buildings, average cost: $506,000
- 2005: 16 buildings, average cost: $395,300
- 2004: 22 buildings, average cost: $482,200
- 2003: 21 buildings, average cost: $411,100
- 2002: 26 buildings, average cost: $332,800
- 2001: 28 buildings, average cost: $428,400
- 2000: 25 buildings, average cost: $407,700
- 1999: 29 buildings, average cost: $338,600
- 1998: 26 buildings, average cost: $317,100
- 1997: 9 buildings, average cost: $364,600


Median real estate property taxes paid for housing units with mortgages in 2022: $3,704 (0.7%)
Median real estate property taxes paid for housing units with no mortgage in 2022: $3,465 (0.8%)


| Alpine County: | 13.8% |
| California: | 12.2% |
Median age of residents in 2022: 43.7 years old
(Males: 40.2 years old, Females: 53.9 years old)
(Median age for: White residents: 57.1 years old, American Indian residents: 34.2 years old, Hispanic or Latino residents: 26.6 years old, Other race residents: 29.3 years old)
Fair market rent in 2006 for a 1-bedroom apartment in Alpine County is $559 a month.
Fair market rent for a 2-bedroom apartment is $713 a month.
Fair market rent for a 3-bedroom apartment is $1017 a month.
Cities in this county include: Markleeville, Mesa Vista, Alpine Village, Bear Valley, Kirkwood.
| Zip code | City | Number of tests | Number of tests >= 4 pCi/L |
|---|---|---|---|
| 95646 | Kirkwood | 7 | 3 |
| 96120 | Markleeville | 47 | 15 |
Neighboring counties: Clay County, Illinois  , Gallia County, Ohio , Hamilton County, Ohio , Montgomery County, Missouri , Rappahannock County, Virginia , Mason County, Kentucky .
| Here: | 6.6% |
| California: | 5.1% |


Current college students: 67
People 25 years of age or older with a high school degree or higher: 93.3%
People 25 years of age or older with a bachelor's degree or higher: 39.6%
Number of foreign born residents: 50 (61.3% naturalized citizens)
| Alpine County: | 3.4% |
| Whole state: | 26.7% |

- Year of entry for the foreign-born population
- 212010 or later
- 182000 to 2009
- 01990 to 1999
- 31980 to 1989
- 01970 to 1979
- 18Before 1970
Mean travel time to work (commute): minutes
Percentage of county residents living and working in this county: 73.4%
Housing units in structures:
- One, detached: 1,071
- One, attached: 54
- Two: 9
- 3 or 4: 37
- 5 to 9: 81
- 10 to 19: 176
- 20 to 49: 124
- 50 or more: 47
- Mobile homes: 28
Housing units in Alpine County with a mortgage: 163 (16 second mortgage, 0 home equity loan, 2 both second mortgage and home equity loan)
Houses without a mortgage: 12
| Here: | 93.1% with mortgage |
| State: | 98.6% with mortgage |
Religion statistics for Alpine County
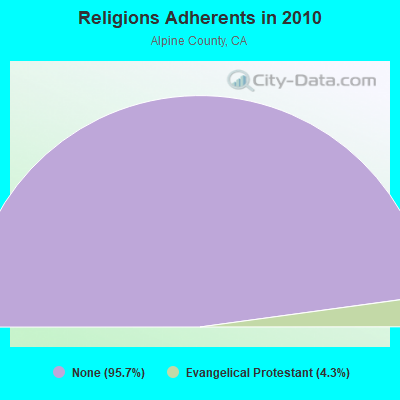
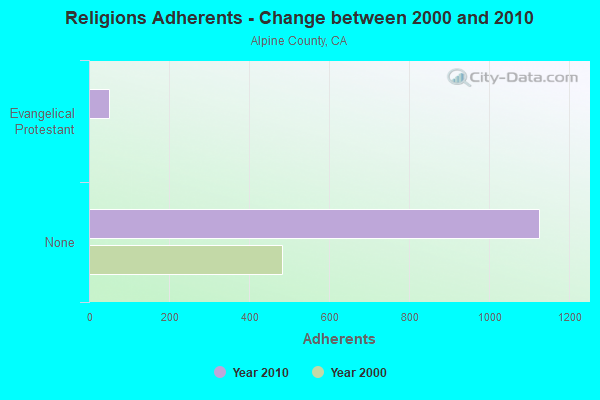
| Religion | Adherents | Congregations |
|---|---|---|
| Evangelical Protestant | 50 | 1 |
| Other | - | - |
| None | 1,125 | - |
Source: Clifford Grammich, Kirk Hadaway, Richard Houseal, Dale E.Jones, Alexei Krindatch, Richie Stanley and Richard H.Taylor. 2012. 2010 U.S.Religion Census: Religious Congregations & Membership Study. Association of Statisticians of American Religious Bodies. Jones, Dale E., et al. 2002. Congregations and Membership in the United States 2000. Nashville, TN: Glenmary Research Center.
Food Environment Statistics:
| Alpine County: | 7.8% |
| California: | 7.3% |
| Alpine County: | 23.9% |
| State: | 21.3% |
| Here: | 18.8% |
| State: | 17.9% |
Agriculture in Alpine County:
Average value of agricultural products sold per farm: $43,926The value of nursery, greenhouse, floriculture, and sod as a percentage of the total market value of agricultural products sold: 0.00%
Average total farm production expenses per farm: $63,492
Average market value of all machinery and equipment per farm: $71,000
The percentage of farms operated by a family or individual: 71.43%
Average age of principal farm operators: 50 years
Earthquake activity:
Alpine County-area historical earthquake activity is significantly above California state average. It is 7753% greater than the overall U.S. average.On 4/18/1906 at 13:12:21, a magnitude 7.9 (7.9 UK, Class: Major, Intensity: VIII - XII) earthquake occurred 174.4 miles away from Alpine County center, causing $524,000,000 total damage
On 10/3/1915 at 06:52:48, a magnitude 7.6 (7.6 UK) earthquake occurred 181.4 miles away from the county center
On 12/21/1932 at 06:10:09, a magnitude 7.2 (7.2 UK) earthquake occurred 98.0 miles away from the county center
On 7/21/1952 at 11:52:14, a magnitude 7.7 (7.7 UK) earthquake occurred 256.0 miles away from the county center, causing $50,000,000 total damage
On 12/16/1954 at 11:07:12, a magnitude 7.0 (7.0 UK) earthquake occurred 109.0 miles away from Alpine County center
On 10/18/1989 at 00:04:15, a magnitude 7.1 (6.5 MB, 7.1 MS, 6.9 MW, 7.0 ML) earthquake occurred 147.1 miles away from the county center, causing 62 deaths (62 shaking deaths) and 3757 injuries, causing $1,305,032,704 total damage
Magnitude types: body-wave magnitude (MB), local magnitude (ML), surface-wave magnitude (MS), moment magnitude (MW)
Most recent natural disasters:
- California Covid-19 Pandemic, Incident Period: January 20, 2020, FEMA Id: 4482, Natural disaster type: Other
- California Severe Winter Storms, Flooding, Mudslides, Incident Period: February 1, 2017 - February 23, 2017, FEMA Id: 4308, Natural disaster type: Winter Storm, Mudslide, Flood
- California Severe Storms, Flooding, Mudslides, and Landslides, Incident Period: December 17, 2005 to January 03, 2006, Major Disaster (Presidential) Declared DR-1628: February 03, 2006, FEMA Id: 1628, Natural disaster type: Storm, Mudslide, Landslide, Flood
- California Hurricane Katrina Evacuation, Incident Period: August 29, 2005 to October 01, 2005, Emergency Declared EM-3248: September 13, 2005, FEMA Id: 3248, Natural disaster type: Hurricane
- California Severe Storms/Flooding, Incident Period: December 28, 1996 to April 01, 1997, Major Disaster (Presidential) Declared DR-1155: January 04, 1997, FEMA Id: 1155, Natural disaster type: Storm, Flood
- California Severe Winter Storms, Flooding, Landslides, Mud Flows, Incident Period: February 13, 1995 to April 19, 1995, Major Disaster (Presidential) Declared DR-1046: March 12, 1995, FEMA Id: 1046, Natural disaster type: Winter Storm, Landslide, Flood
- California Severe Storm, Winter Storm, Mud & Landslides, Flooding, Incident Period: January 05, 1993 to March 20, 1993, Major Disaster (Presidential) Declared DR-979: February 03, 1993, FEMA Id: 979, Natural disaster type: Winter Storm, Storm, Landslide, Flood
- California SEVERE STORMS, FLOODING, Incident Period: February 12, 1986 to March 10, 1986, Major Disaster (Presidential) Declared DR-758: February 21, 1986, FEMA Id: 758, Natural disaster type: Storm, Flood
- California Drought, Incident Period: January 20, 1977, Emergency Declared EM-3023: January 20, 1977, FEMA Id: 3023, Natural disaster type: Drought
- California Heavy Rains & Flooding, Incident Period: December 24, 1964, Major Disaster (Presidential) Declared DR-183: December 24, 1964, FEMA Id: 183, Natural disaster type: Flood, Heavy Rain
The number of natural disasters in Alpine County (10) is smaller than the US average (15).
Major Disasters (Presidential) Declared: 6
Emergencies Declared: 2

Means of transportation to work:
- Drove a car alone: 390 (57.8%)
- Carpooled: 60 (8.9%)
- Bus: 1 (0.1%)
- Taxicab, motorcycle, or other means: 21 (3.1%)
- Bicycle: 15 (2.2%)
- Walked: 14 (2.1%)
- Worked at home: 197 (29.2%)


- Arts, entertainment, and recreation (12%)
- Agriculture, forestry, fishing and hunting (11%)
- Health care and social assistance (9%)
- Retail trade (8%)
- Educational services (6%)
- Accommodation and food services (6%)
- Professional, scientific, and technical services (4%)

- Arts, entertainment, and recreation (18%)
- Agriculture, forestry, fishing and hunting (16%)
- Health care and social assistance (13%)
- Retail trade (11%)
- Educational services (9%)
- Accommodation and food services (9%)
- Professional, scientific, and technical services (6%)

- Sales and related occupations (17%)
- Management occupations (16%)
- Business and financial operations occupations (7%)
- Educational instruction, and library occupations (7%)
- Transportation occupations (7%)
- Health diagnosing and treating practitioners and other technical occupations (5%)
- Computer and mathematical occupations (5%)

- Management occupations (18%)
- Material moving occupations (16%)
- Business and financial operations occupations (14%)
- Office and administrative support occupations (10%)
- Sales and related occupations (7%)
- Educational instruction, and library occupations (7%)
- Healthcare support occupations (7%)

- Mexico (38%)
- Colombia (22%)
- England (20%)
- India (12%)
- Canada (6%)
- Korea (2%)
- Sweden (0%)

- English (13%)
- Irish (9%)
- German (5%)
- Romanian (4%)
- Italian (3%)
- American (3%)
- British (2%)


13.22% of this county's 2021 resident taxpayers lived in other counties in 2020 ($127,418 average adjusted gross income)
| Here: | 13.22% |
| California average: | 5.19% |
10 or fewer of this county's residents moved from foreign countries.
8.17% relocated from other counties in California ($100,818 average AGI)
5.05% relocated from other states ($26,600 average AGI)
Alpine County: 5.05% California average: 1.56%

13.43% of this county's 2020 resident taxpayers moved to other counties in 2021 ($50,500 average adjusted gross income)
| Here: | 13.43% |
| California average: | 6.14% |
10 or fewer of this county's residents moved to foreign countries.
5.52% relocated to other counties in California ($25,964 average AGI)
7.91% relocated to other states ($24,536 average AGI)
Alpine County: 7.91% California average: 2.55%

Births per 1000 population from 1990 to 1999: 12.5
Births per 1000 population from 2000 to 2006: 11.4

Deaths per 1000 population from 1990 to 1999: 5.8
Deaths per 1000 population from 2000 to 2009: 4.7
Deaths per 1000 population from 2010 to 2020: 8.1

Infant deaths per 1000 live births from 1990 to 1999: 10.4

Persons under 19 years old without health insurance coverage in 2018: 4.3%


Persons enrolled in hospital insurance and/or supplemental medical insurance (Medicare) in July 1, 2007: 149 (126 aged, 23 disabled)
Children under 18 without health insurance coverage in 2007: 40 (19%)


Population without health insurance coverage in 2000: 21%
Children under 18 without health insurance coverage in 2000: 18%
Household type by relationship:
Households: 1,502- Male householders: 266 (101 living alone), Female householders: 175 (43 living alone)
234 spouses (234 opposite-sex spouses), 12 unmarried partners, (12 opposite-sex unmarried partners), 485 children (428 natural, 23 adopted, 33 stepchildren), 80 grandchildren, 12 brothers or sisters, 40 parents, 0 foster children, 72 other relatives, 44 non-relatives
- In group quarters: 69
Size of family households: 186 2-persons, 35 3-persons, 42 4-persons, 5 5-persons, 11 6-persons, 1 7-or-more-persons.
Size of nonfamily households: 144 1-person, 17 2-persons.
188 married couples with children.
56 single-parent households (22 men, 34 women).
81.7% of residents of Alpine speak English at home.
8.7% of residents speak Spanish at home (64% speak English very well, 19% speak English well, 8% speak English not well, 9% don't speak English at all).
4.0% of residents speak other Indo-European language at home (100% speak English very well).
5.2% of residents speak other language at home (47% speak English very well, 46% speak English well, 7% speak English not well).
In fiscal year 2004:
Federal Government expenditure: $9,275,000 ($7,794 per capita)
Department of Defense expenditure: $374,000
Federal direct payments to individuals for retirement and disability: $5,054,000
Federal other direct payments to individuals: $1,323,000
Federal direct payments not to individuals: $0,000
Federal grants: $1,684,000
Federal procurement contracts: $810,000 ($315,000 Department of Defense)
Federal salaries and wages: $403,000 ($0,000 Department of Defense)
Federal Government direct loans: $33,000
Federal guaranteed/insured loans: $0,000
Federal Government insurance: $900,000
Population change from April 1, 2000 to July 1, 2005:
Births: 64| Here: | 55 per 1000 residents |
| State: | 77 per 1000 residents |
Deaths: 48
| Here: | 41 per 1000 residents |
| State: | 34 per 1000 residents |
Net international migration: -1
| Here: | |
| State: |
Net internal migration: -61
| Here: | |
| State: |

Total withdrawal of fresh water for public supply: 0.12 millions of gallons per day (50% from ground, 50% from surface)
| Here: | 5.6 |
| State: | 6.0 |
| Here: | 3.8 |
| State: | 3.9 |

- Year house built in Alpine County, California
- 02020 or later
- 492010 to 2019
- 2462000 to 2009
- 2731990 to 1999
- 2831980 to 1989
- 3801970 to 1979
- 1721960 to 1969
- 591950 to 1959
- 581940 to 1949
- 901939 or earlier

- Rooms in owner-occupied houses in Alpine County, California
- 01 room
- 02 rooms
- 503 rooms
- 824 rooms
- 495 rooms
- 866 rooms
- 367 rooms
- 328 rooms
- 369+ rooms

- Rooms in renter-occupied apartments in Alpine County, California
- 171 room
- 72 rooms
- 103 rooms
- 164 rooms
- 95 rooms
- 36 rooms
- 97 rooms
- 58 rooms
- 19+ rooms

- Bedrooms in owner-occupied houses in Alpine County, California
- 0no bedroom
- 401 bedroom
- 832 bedrooms
- 1453 bedrooms
- 854 bedrooms
- 145+ bedrooms

- Bedrooms in renter-occupied apartments in Alpine County, California
- 17no bedroom
- 151 bedroom
- 162 bedrooms
- 213 bedrooms
- 54 bedrooms
- 25+ bedrooms

- Cars and other vehicles available in Alpine County in owner-occupied houses/condos
- 11no vehicle
- 1171 vehicle
- 822 vehicles
- 733 vehicles
- 724 vehicles
- 125+ vehicles

- Cars and other vehicles available in Alpine County in renter-occupied apartments
- 5no vehicle
- 261 vehicle
- 392 vehicles
- 43 vehicles
- 14 vehicles
- 05+ vehicles
85.8% of Alpine County residents lived in the same house 1 years ago.
Out of people who lived in different houses, 15% lived in this county.
Out of people who lived in different counties, 48% lived in California.
| Alpine County: | 85.8% |
| State average: | 88.9% |
Place of birth for U.S.-born residents:
- This state: 880
- Other state: 550
- Northeast: 108
- Midwest: 103
- South: 36
- West: 301


- 38.3%Bottled, tank, or LP gas
- 32.2%Wood
- 10.0%Electricity
- 8.9%Other fuel
- 6.7%Solar energy
- 3.1%Utility gas
- 0.8%Fuel oil, kerosene, etc.

- 57.3%Bottled, tank, or LP gas
- 14.7%Fuel oil, kerosene, etc.
- 14.7%Wood
- 10.7%Utility gas
- 2.7%Electricity
Private vs. public school enrollment:
| Here: | 6.2% |
| California: | 10.5% |
| Here: | 0.0% |
| California: | 8.5% |
| Here: | 16.2% |
| California: | 15.9% |


Alpine County government finances - Expenditure in 2018:
- Assistance and Subsidies - Public Welfare, Cash Assistance Programs - Other: $855,000
- Charges - Other: $2,095,000
Regular Highways: $328,000
Elementary and Secondary Education - Other: $64,000
Parks and Recreation: $20,000
Solid Waste Management: $10,000
- Current Operations - Health - Other: $3,171,000
Police Protection: $3,043,000
General - Other: $2,930,000
Central Staff Services: $1,389,000
Regular Highways: $1,377,000
Elementary and Secondary Education: $1,061,000
Financial Administration: $882,000
Public Welfare - Other: $761,000
Judicial and Legal Services: $572,000
Local Fire Protection: $530,000
Corrections - Other: $368,000
Libraries: $319,000
Protective Inspection and Regulation - Other: $174,000
Transit Utilities: $99,000
Solid Waste Management: $76,000
Parks and Recreation: $41,000
Correctional Institutions: $31,000
Natural Resources - Other: $15,000
- Federal Intergovernmental - Other: $867,000
Natural Resources: $191,000
General Local Government Support: $164,000
Highways: $45,000
Transit Utilities: $43,000
Education: $32,000
- General - Interest on Debt: $40,000
- Intergovernmental to Local - Other - Elementary and Secondary Education: $175,000
Other - General - Other: $105,000
- Intergovernmental to State - Judicial and Legal Services: $87,000
- Local Intergovernmental - Other: $162,000
- Long Term Debt - Beginning Outstanding - Unspecified Public Purpose: $1,005,000
Outstanding Unspecified Public Purpose: $929,000
Retired Unspecified Public Purpose: $75,000
- Miscellaneous - Special Assessments: $481,000
Interest Earnings: $410,000
General Revenue - Other: $371,000
Fines and Forfeits: $218,000
Rents: $203,000
- Other Capital Outlay - General - Other: $583,000
Regular Highways: $457,000
Health - Other: $162,000
General Public Building: $117,000
Public Welfare - Other: $85,000
Police Protection: $59,000
Central Staff Services: $2,000
- Other Funds - Cash and Securities: $33,499,000
- State Intergovernmental - Health and Hospitals: $3,098,000
Other: $2,845,000
Public Welfare: $1,892,000
Education: $1,186,000
Highways: $738,000
Transit Utilities: $63,000
General Local Government Support: $11,000
- Tax - Property: $5,570,000
Other Selective Sales: $683,000
General Sales and Gross Receipts: $395,000
Occupation and Business License - Other: $92,000
Documentary and Stock Transfer: $53,000
Public Utilities Sales: $22,000
Other License: $3,000
- Total Salaries and Wages: $381,000
Alpine County government finances - Revenue in 2018:
- Assistance and Subsidies - Public Welfare, Cash Assistance Programs - Other: $855,000
- Charges - Other: $2,095,000
Regular Highways: $328,000
Elementary and Secondary Education - Other: $64,000
Parks and Recreation: $20,000
Solid Waste Management: $10,000
- Current Operations - Health - Other: $3,171,000
Police Protection: $3,043,000
General - Other: $2,930,000
Central Staff Services: $1,389,000
Regular Highways: $1,377,000
Elementary and Secondary Education: $1,061,000
Financial Administration: $882,000
Public Welfare - Other: $761,000
Judicial and Legal Services: $572,000
Local Fire Protection: $530,000
Corrections - Other: $368,000
Libraries: $319,000
Protective Inspection and Regulation - Other: $174,000
Transit Utilities: $99,000
Solid Waste Management: $76,000
Parks and Recreation: $41,000
Correctional Institutions: $31,000
Natural Resources - Other: $15,000
- Federal Intergovernmental - Other: $867,000
Natural Resources: $191,000
General Local Government Support: $164,000
Highways: $45,000
Transit Utilities: $43,000
Education: $32,000
- General - Interest on Debt: $40,000
- Intergovernmental to Local - Other - Elementary and Secondary Education: $175,000
Other - General - Other: $105,000
- Intergovernmental to State - Judicial and Legal Services: $87,000
- Local Intergovernmental - Other: $162,000
- Long Term Debt - Beginning Outstanding - Unspecified Public Purpose: $1,005,000
Outstanding Unspecified Public Purpose: $929,000
Retired Unspecified Public Purpose: $75,000
- Miscellaneous - Special Assessments: $481,000
Interest Earnings: $410,000
General Revenue - Other: $371,000
Fines and Forfeits: $218,000
Rents: $203,000
- Other Capital Outlay - General - Other: $583,000
Regular Highways: $457,000
Health - Other: $162,000
General Public Building: $117,000
Public Welfare - Other: $85,000
Police Protection: $59,000
Central Staff Services: $2,000
- Other Funds - Cash and Securities: $33,499,000
- State Intergovernmental - Health and Hospitals: $3,098,000
Other: $2,845,000
Public Welfare: $1,892,000
Education: $1,186,000
Highways: $738,000
Transit Utilities: $63,000
General Local Government Support: $11,000
- Tax - Property: $5,570,000
Other Selective Sales: $683,000
General Sales and Gross Receipts: $395,000
Occupation and Business License - Other: $92,000
Documentary and Stock Transfer: $53,000
Public Utilities Sales: $22,000
Other License: $3,000
- Total Salaries and Wages: $381,000
Alpine County government finances - Debt in 2018:
- Assistance and Subsidies - Public Welfare, Cash Assistance Programs - Other: $855,000
- Charges - Other: $2,095,000
Regular Highways: $328,000
Elementary and Secondary Education - Other: $64,000
Parks and Recreation: $20,000
Solid Waste Management: $10,000
- Current Operations - Health - Other: $3,171,000
Police Protection: $3,043,000
General - Other: $2,930,000
Central Staff Services: $1,389,000
Regular Highways: $1,377,000
Elementary and Secondary Education: $1,061,000
Financial Administration: $882,000
Public Welfare - Other: $761,000
Judicial and Legal Services: $572,000
Local Fire Protection: $530,000
Corrections - Other: $368,000
Libraries: $319,000
Protective Inspection and Regulation - Other: $174,000
Transit Utilities: $99,000
Solid Waste Management: $76,000
Parks and Recreation: $41,000
Correctional Institutions: $31,000
Natural Resources - Other: $15,000
- Federal Intergovernmental - Other: $867,000
Natural Resources: $191,000
General Local Government Support: $164,000
Highways: $45,000
Transit Utilities: $43,000
Education: $32,000
- General - Interest on Debt: $40,000
- Intergovernmental to Local - Other - Elementary and Secondary Education: $175,000
Other - General - Other: $105,000
- Intergovernmental to State - Judicial and Legal Services: $87,000
- Local Intergovernmental - Other: $162,000
- Long Term Debt - Beginning Outstanding - Unspecified Public Purpose: $1,005,000
Outstanding Unspecified Public Purpose: $929,000
Retired Unspecified Public Purpose: $75,000
- Miscellaneous - Special Assessments: $481,000
Interest Earnings: $410,000
General Revenue - Other: $371,000
Fines and Forfeits: $218,000
Rents: $203,000
- Other Capital Outlay - General - Other: $583,000
Regular Highways: $457,000
Health - Other: $162,000
General Public Building: $117,000
Public Welfare - Other: $85,000
Police Protection: $59,000
Central Staff Services: $2,000
- Other Funds - Cash and Securities: $33,499,000
- State Intergovernmental - Health and Hospitals: $3,098,000
Other: $2,845,000
Public Welfare: $1,892,000
Education: $1,186,000
Highways: $738,000
Transit Utilities: $63,000
General Local Government Support: $11,000
- Tax - Property: $5,570,000
Other Selective Sales: $683,000
General Sales and Gross Receipts: $395,000
Occupation and Business License - Other: $92,000
Documentary and Stock Transfer: $53,000
Public Utilities Sales: $22,000
Other License: $3,000
- Total Salaries and Wages: $381,000
Alpine County government finances - Cash and Securities in 2018:
- Assistance and Subsidies - Public Welfare, Cash Assistance Programs - Other: $855,000
- Charges - Other: $2,095,000
Regular Highways: $328,000
Elementary and Secondary Education - Other: $64,000
Parks and Recreation: $20,000
Solid Waste Management: $10,000
- Current Operations - Health - Other: $3,171,000
Police Protection: $3,043,000
General - Other: $2,930,000
Central Staff Services: $1,389,000
Regular Highways: $1,377,000
Elementary and Secondary Education: $1,061,000
Financial Administration: $882,000
Public Welfare - Other: $761,000
Judicial and Legal Services: $572,000
Local Fire Protection: $530,000
Corrections - Other: $368,000
Libraries: $319,000
Protective Inspection and Regulation - Other: $174,000
Transit Utilities: $99,000
Solid Waste Management: $76,000
Parks and Recreation: $41,000
Correctional Institutions: $31,000
Natural Resources - Other: $15,000
- Federal Intergovernmental - Other: $867,000
Natural Resources: $191,000
General Local Government Support: $164,000
Highways: $45,000
Transit Utilities: $43,000
Education: $32,000
- General - Interest on Debt: $40,000
- Intergovernmental to Local - Other - Elementary and Secondary Education: $175,000
Other - General - Other: $105,000
- Intergovernmental to State - Judicial and Legal Services: $87,000
- Local Intergovernmental - Other: $162,000
- Long Term Debt - Beginning Outstanding - Unspecified Public Purpose: $1,005,000
Outstanding Unspecified Public Purpose: $929,000
Retired Unspecified Public Purpose: $75,000
- Miscellaneous - Special Assessments: $481,000
Interest Earnings: $410,000
General Revenue - Other: $371,000
Fines and Forfeits: $218,000
Rents: $203,000
- Other Capital Outlay - General - Other: $583,000
Regular Highways: $457,000
Health - Other: $162,000
General Public Building: $117,000
Public Welfare - Other: $85,000
Police Protection: $59,000
Central Staff Services: $2,000
- Other Funds - Cash and Securities: $33,499,000
- State Intergovernmental - Health and Hospitals: $3,098,000
Other: $2,845,000
Public Welfare: $1,892,000
Education: $1,186,000
Highways: $738,000
Transit Utilities: $63,000
General Local Government Support: $11,000
- Tax - Property: $5,570,000
Other Selective Sales: $683,000
General Sales and Gross Receipts: $395,000
Occupation and Business License - Other: $92,000
Documentary and Stock Transfer: $53,000
Public Utilities Sales: $22,000
Other License: $3,000
- Total Salaries and Wages: $381,000
Supplemental Security Income (SSI) in 2006:
- Total number of recipients: 27
- Number of aged recipients: 0
- Number of blind and disabled recipients: 0
- Number of recipients under 18: 0
- Number of recipients between 18 and 64: 22
- Number of recipients older than 64: 0
- Number of recipients also receiving OASDI: 18
- Amount of payments (thousands of dollars): 18
Alpine County on our top lists:
- #36 on the list of "Top 101 counties with the lowest surface withdrawal of fresh water for public supply"
- #61 on the list of "Top 101 counties with the highest percentage of residents relocating to other counties in 2011"
- #97 on the list of "Top 101 counties with highest percentage of residents voting for 3rd party candidates in the 2012 Presidential Election"
- #98 on the list of "Top 101 counties with the lowest total withdrawal of fresh water for public supply"