Percentage of residents living in poverty in 2022: 19.8%
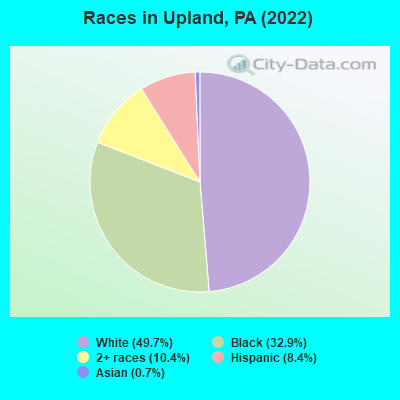
(5.2% for White Non-Hispanic residents, 34.2% for Black residents, 51.0% for Hispanic or Latino residents, 88.2% for other race residents, 28.0% for two or more races residents)
According to our research of Pennsylvania and other state lists, there were 3 registered sex offenders living in Upland, Pennsylvania as of June 08, 2024. The ratio of all residents to sex offenders in Upland is 1,085 to 1. The ratio of registered sex offenders to all residents in this city is lower than the state average.
Crime rates in Upland by year
Type
2009
2010
2011
2012
2013
2014
2015
2016
2017
2018
2019
2020
Murders (per 100,000)
0 (0.0)
0 (0.0)
1 (30.8)
0 (0.0)
0 (0.0)
1 (30.8)
0 (0.0)
0 (0.0)
1 (30.8)
3 (92.3)
0 (0.0)
0 (0.0)
Rapes (per 100,000)
4 (140.3)
1 (30.9)
2 (61.6)
3 (92.4)
3 (92.4)
2 (61.5)
4 (122.9)
0 (0.0)
0 (0.0)
4 (123.1)
0 (0.0)
0 (0.0)
Robberies (per 100,000)
9 (315.6)
6 (185.2)
9 (277.0)
6 (184.9)
7 (215.7)
6 (184.5)
2 (61.4)
4 (122.9)
3 (92.5)
3 (92.3)
4 (121.1)
2 (60.1)
Assaults (per 100,000)
38 (1,332)
51 (1,575)
89 (2,739)
58 (1,787)
27 (831.8)
39 (1,199)
31 (952.1)
43 (1,321)
29 (894.2)
49 (1,508)
37 (1,120)
27 (811.5)
Burglaries (per 100,000)
25 (876.6)
39 (1,204)
41 (1,262)
34 (1,048)
38 (1,171)
25 (768.8)
13 (399.3)
22 (676.1)
13 (400.9)
16 (492.3)
8 (242.2)
6 (180.3)
Thefts (per 100,000)
66 (2,314)
71 (2,192)
89 (2,739)
93 (2,866)
69 (2,126)
64 (1,968)
79 (2,426)
85 (2,612)
82 (2,529)
71 (2,185)
30 (908.3)
28 (841.6)
Auto thefts (per 100,000)
9 (315.6)
6 (185.2)
13 (400.1)
10 (308.2)
10 (308.1)
5 (153.8)
10 (307.1)
6 (184.4)
7 (215.8)
17 (523.1)
8 (242.2)
3 (90.2)
Arson (per 100,000)
2 (70.1)
0 (0.0)
0 (0.0)
0 (0.0)
1 (30.8)
1 (30.8)
1 (30.7)
0 (0.0)
0 (0.0)
0 (0.0)
0 (0.0)
0 (0.0)
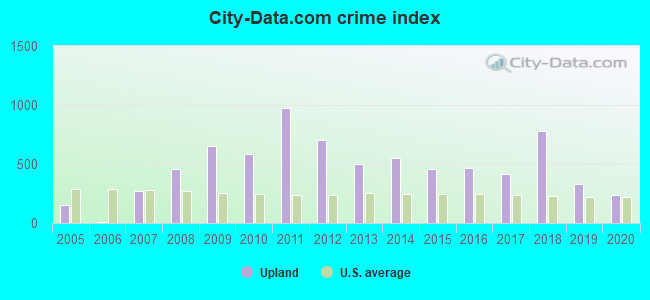
City-Data.com crime index
652.5
582.0
971.7
699.5
496.6
550.7
456.7
467.7
414.7
776.0
333.0
233.8
The City-Data.com crime index weighs serious crimes and violent crimes more heavily. Higher means more crime, U.S. average is 246.1. It adjusts for the number of visitors and daily workers commuting into cities.
Latest news from Upland, PA collected exclusively by city-data.com from local newspapers, TV, and radio stations
Ancestries: Irish (18.5%), German (2.7%), Italian (2.3%), Polish (2.3%), Ukrainian (2.0%), Jamaican (1.5%).
Current Local Time: EST time zone
Incorporated on 05/24/1869
Elevation: 50 feet
Land area: 0.67 square miles.
Population density: 4,525 people per square mile (average).
49 residents are foreign born
This borough:
1.6%
Pennsylvania:
7.3%
Median real estate property taxes paid for housing units with mortgages in 2022: $2,240 (1.5%) Median real estate property taxes paid for housing units with no mortgage in 2022: $3,039 (1.5%)
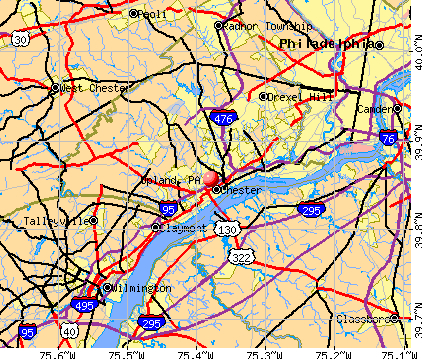
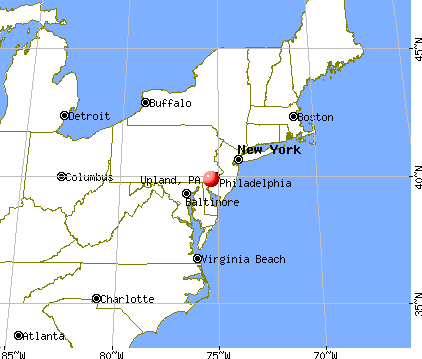
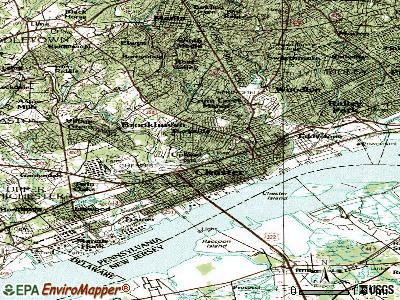
Nearest city with pop. 50,000+: Brandywine, DE (7.8 miles , pop. 78,620).
Nearest city with pop. 200,000+: Philadelphia, PA (15.8 miles , pop. 1,517,550).
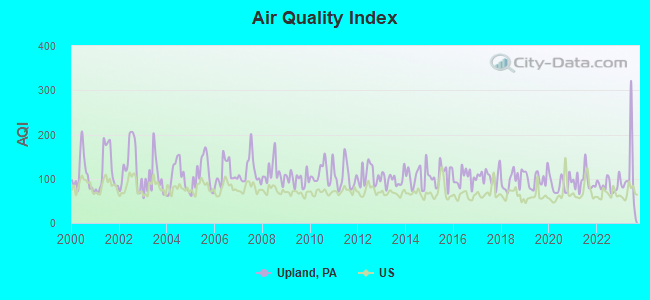
Air Quality Index (AQI) level in 2023 was 110. This is significantly worse than average.
City:
110
U.S.:
73
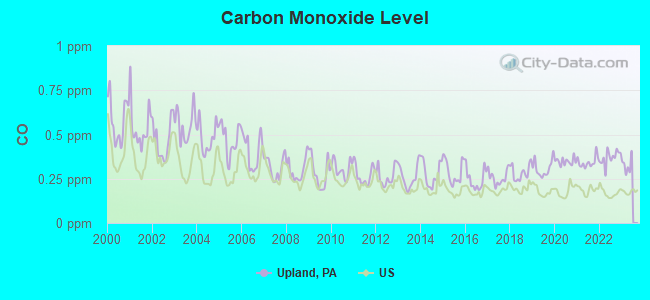
Carbon Monoxide (CO) [ppm] level in 2022 was 0.370. This is significantly worse than average.Closest monitor was 1.5 miles away from the city center.
City:
0.370
U.S.:
0.251
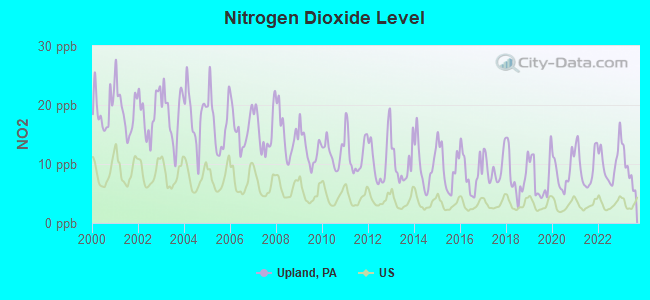
Nitrogen Dioxide (NO2) [ppb] level in 2023 was 9.06. This is significantly worse than average.Closest monitor was 1.5 miles away from the city center.
City:
9.06
U.S.:
5.11
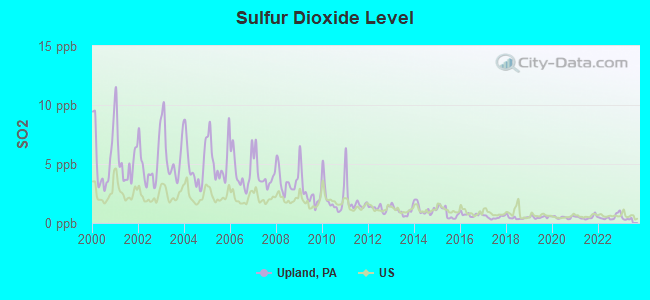
Sulfur Dioxide (SO2) [ppb] level in 2022 was 0.517. This is significantly better than average.Closest monitor was 3.2 miles away from the city center.
City:
0.517
U.S.:
1.515
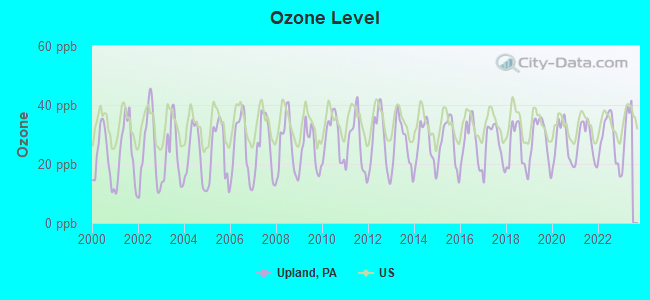
Ozone [ppb] level in 2022 was 28.6. This is about average.Closest monitor was 1.5 miles away from the city center.
City:
28.6
U.S.:
33.3
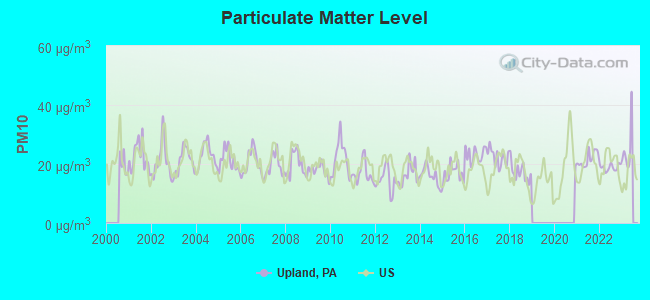
Particulate Matter (PM10) [µg/m3] level in 2022 was 18.9. This is about average.Closest monitor was 1.5 miles away from the city center.
City:
18.9
U.S.:
19.2
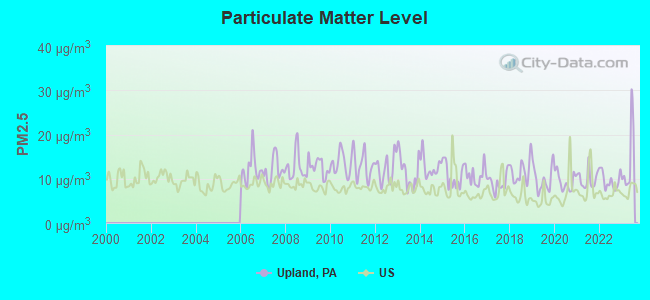
Particulate Matter (PM2.5) [µg/m3] level in 2023 was 14.2. This is significantly worse than average.Closest monitor was 1.5 miles away from the city center.
City:
14.2
U.S.:
8.1
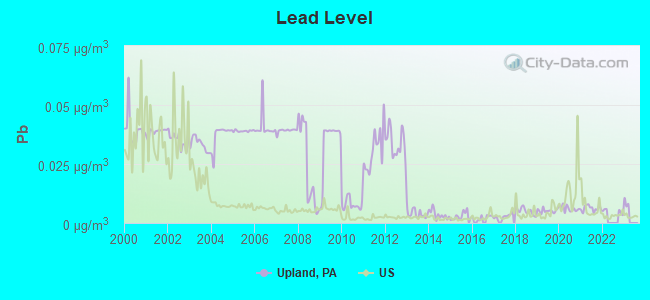
Lead (Pb) [µg/m3] level in 2021 was 0.00621. This is significantly better than average.Closest monitor was 1.5 miles away from the city center.
City:
0.00621
U.S.:
0.00931
Tornado activity:
Upland-area historical tornado activity is slightly above Pennsylvania state average. It is 3% greater than the overall U.S. average.
On 3/22/1955, a category F3 (max. wind speeds 158-206 mph) tornado 14.2 miles away from the Upland borough center killed one personand causedbetween $50,000 and $500,000 in damages.
On 4/28/1961, a category F3 tornado 16.4 miles away from the borough center causedbetween $5000 and $50,000 in damages.
Earthquake activity:
Upland-area historical earthquake activity is significantly above Pennsylvania state average. It is 65% smaller than the overall U.S. average.
On 8/23/2011 at 17:51:04, a magnitude 5.8 (5.8 MW, Depth: 3.7 mi, Class: Moderate, Intensity: VI - VII) earthquake occurred 192.6 miles away from Upland center On 1/16/1994 at 01:49:16, a magnitude 4.6 (4.6 MB, 4.6 LG, Depth: 3.1 mi, Class: Light, Intensity: IV - V) earthquake occurred 47.8 miles away from Upland center On 1/16/1994 at 00:42:43, a magnitude 4.2 (4.2 MB, 4.0 LG, Depth: 3.1 mi) earthquake occurred 46.5 miles away from Upland center On 11/30/2017 at 21:47:31, a magnitude 4.1 (4.1 MW, Depth: 6.1 mi) earthquake occurred 45.7 miles away from the city center On 10/7/1983 at 10:18:46, a magnitude 5.3 (5.1 MB, 5.3 LG, 5.1 ML) earthquake occurred 288.3 miles away from the city center On 9/25/1998 at 19:52:52, a magnitude 5.2 (4.8 MB, 4.3 MS, 5.2 LG, 4.5 MW, Depth: 3.1 mi) earthquake occurred 286.4 miles away from the city center Magnitude types: regional Lg-wave magnitude (LG), body-wave magnitude (MB), local magnitude (ML), surface-wave magnitude (MS), moment magnitude (MW)
Natural disasters:
The number of natural disasters in Delaware County (21) is greater than the US average (15). Major Disasters (Presidential) Declared: 15 Emergencies Declared: 6
Causes of natural disasters: Hurricanes: 5, Floods: 4, Winter Storms: 4, Storms: 3, Tropical Storms: 3, Snowstorms: 2, Blizzard: 1, Snowfall: 1, Tropical Depression: 1, Water Shortage: 1, Other: 1 (Note: some incidents may be assigned to more than one category).
Hospitals and medical centers in Upland:
CROZER CHESTER MEDICAL CENTER (Voluntary non-profit - Other, provides emergency services, ONE MEDICAL CENTER BOULEVARD)
UPLAND DIALYSIS CENTER (PROFESSIONAL OFFICE BUILDING 2, SUITE 120)
CROZER CHESTER MED HOME CARE (ONE MEDICAL CENTER BLVD)
12 miles: ARDMORE (STATION RD. & LANCASTER AVE.) . Services: enclosed waiting area, public restrooms, public payphones, paid short-term parking, call for car rental service, call for taxi service, public transit connection.
13 miles: WILMINGTON (M. L. KING BLVD, & FRENCH ST.) . Services: ticket office, partially wheelchair accessible, enclosed waiting area, public restrooms, public payphones, snack bar, ATM, paid short-term parking, paid long-term parking, car rental agency, taxi stand, intercity bus service, public transit connection.
13 miles: PHILADELPHIA (30TH & MARKET STS.) . Services: ticket office, fully wheelchair accessible, enclosed waiting area, public restrooms, public payphones, snack bar, ATM, paid short-term parking, paid long-term parking, car rental agency, taxi stand, public transit connection.
Colleges/universities with over 2000 students nearest to Upland:
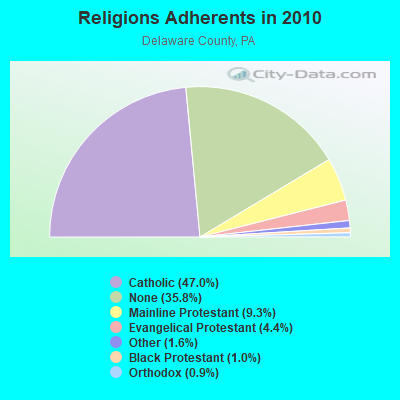
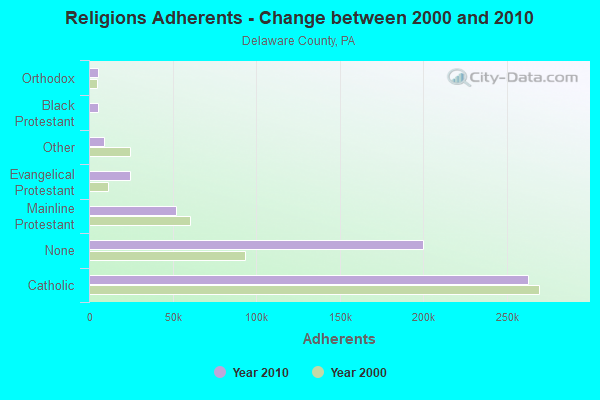
Religion statistics for Upland, PA (based on Delaware County data)
Religion
Adherents
Congregations
Catholic
262,506
50
Mainline Protestant
52,224
169
Evangelical Protestant
24,456
136
Other
9,009
27
Black Protestant
5,617
39
Orthodox
5,096
8
None
200,071
-
Source: Clifford Grammich, Kirk Hadaway, Richard Houseal, Dale E.Jones, Alexei Krindatch, Richie Stanley and Richard H.Taylor. 2012. 2010 U.S.Religion Census: Religious Congregations & Membership Study. Association of Statisticians of American Religious Bodies. Jones, Dale E., et al. 2002. Congregations and Membership in the United States 2000. Nashville, TN: Glenmary Research Center. Graphs represent county-level data
16,117Total future (year 1986) average daily traffic
FCC Registered Antenna Towers:
5
Kristin Steiner, 401 Kent Lane (Lat: 39.854444 Lon: -75.385000), Type: 40.5, Overall height: 39.6 m, Registrant: Wireless Applications Corporation, Fcc@wacorp.Net, , Belle-vue, Phone: (425) 643-5000
Kristin Steiner, 401 Kent Lane (Lat: 39.854444 Lon: -75.385000), Type: 40.5, Overall height: 39.6 m, Registrant: Wireless Applications Corporation, Fcc@wacorp.Net, , Belle-vue, Phone: (425) 643-5000
Kristin Steiner, 401 Kent Lane (Lat: 39.854444 Lon: -75.385000), Type: 40.5, Overall height: 39.6 m, Registrant: Mobilitie Investments, LLC, Pm@mobilitie.Com, , Newpo-rt Beach, Phone: (949) 515-1500
Edward G Roach, 401 Kent Lane (Lat: 39.854444 Lon: -75.385000), Type: 40.5, Overall height: 39.6 m, Registrant: Sba Monarch Towers Ii, LLC, Eroach@sbasite.Com, , Boca -Raton, Phone: (561) 995-7670
Edward G Roach, 401 Kent Lane (Lat: 39.854444 Lon: -75.385000), Type: 40.5, Structure height: 42045 m, Overall height: 39.6 m, Registrant: Sba Monarch Towers Ii, LLC, Eroach@sbasite.Com, , Boca -Raton, Phone: (561) 995-7670
FCC Registered Private Land Mobile Towers:
1
1 Medical Center Blvd (Lat: 39.853167 Lon: -75.368528), Type: Building, Structure height: 18 m, Overall height: 24 m, Call Sign: WPKN564, Assigned Frequencies: 929.387 MHz, Grant Date: 05/13/1997, Expiration Date: 05/13/2007, Cancellation Date: 11/10/2004, Certifier: Kenneth Goldstein, Registrant: Alston & Bird LLP, 601 Pennsylvania Ave., Nw, North Building, 10th Floor, Washington, DC 20004, Phone: (202) 756-3376, Fax: (202) 756-3333, Email:
FCC Registered Broadcast Land Mobile Towers:
2
CROZER CHESTER, One Medical Center Blvd (Lat: 39.849833 Lon: -75.367667), Type: Mast, Structure height: 24 m, Overall height: 27.4 m, Call Sign: WQEB712, Assigned Frequencies: 157.450 MHz, Grant Date: 12/22/2005, Expiration Date: 12/22/2015, Cancellation Date: 02/27/2016, Certifier: Sue M Lohan, Registrant: Radio Maintenance, Inc., 1840 Kutztown Road, Reading, PA 19604, Phone: (610) 898-1211, Fax: (610) 898-1223, Email:
Crozer-Chester Medical Center (Lat: 39.857222 Lon: -75.366611), Type: Bant, Structure height: 18 m, Overall height: 21 m, Call Sign: WQNH394, Assigned Frequencies: 154.625 MHz, Grant Date: 02/07/2011, Expiration Date: 02/07/2021, Cancellation Date: 04/10/2021, Certifier: Marisa H Niedbalski, Registrant: Business Radio Licensing, 30251 Golden Lantern Ste E #501, Laguna Niguel, CA 92677, Phone: (949) 348-8510, Fax: (949) 348-8514, Email:
FCC Registered Amateur Radio Licenses:
2
Call Sign: N3RYO, Licensee ID: L00530575, Grant Date: 02/24/2004, Expiration Date: 05/17/2014, Cancellation Date: 05/18/2016, Certifier: Richard A Harkins, Registrant: Richard A Harkins, 1024 Hill St, Upland, PA 19015
Call Sign: WA3HFM, Grant Date: 02/14/1989, Expiration Date: 02/14/1999, Cancellation Date: 02/15/2001, Registrant: Daniel Malecki, 1153 Woodside Ave, Upland, PA 19015
Home Mortgage Disclosure Act Aggregated Statistics For Year 2009 (Based on 1 full tract)
A) FHA, FSA/RHS & VA Home Purchase Loans
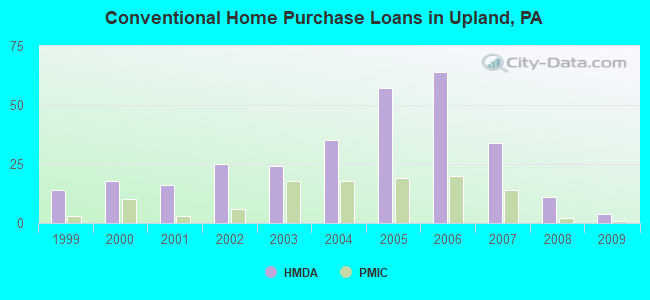
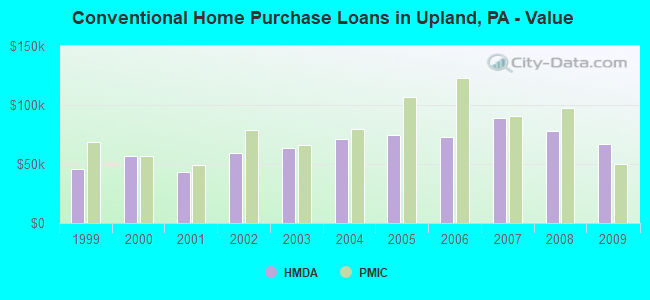
B) Conventional Home Purchase Loans
C) Refinancings
D) Home Improvement Loans
F) Non-occupant Loans on < 5 Family Dwellings (A B C & D)
Number
Average Value
Number
Average Value
Number
Average Value
Number
Average Value
Number
Average Value
LOANS ORIGINATED
16
$120,875
4
$67,250
24
$113,792
6
$23,000
8
$82,875
APPLICATIONS APPROVED, NOT ACCEPTED
0
$0
1
$2,000
2
$70,500
1
$88,000
0
$0
APPLICATIONS DENIED
3
$76,333
2
$101,000
16
$114,938
9
$16,556
4
$42,500
APPLICATIONS WITHDRAWN
2
$100,500
0
$0
7
$93,286
1
$106,000
1
$50,000
FILES CLOSED FOR INCOMPLETENESS
2
$118,000
0
$0
3
$98,667
1
$25,000
0
$0
Aggregated Statistics For Year 2008 (Based on 1 full tract)
A) FHA, FSA/RHS & VA Home Purchase Loans
B) Conventional Home Purchase Loans
C) Refinancings
D) Home Improvement Loans
F) Non-occupant Loans on < 5 Family Dwellings (A B C & D)
G) Loans On Manufactured Home Dwelling (A B C & D)
Number
Average Value
Number
Average Value
Number
Average Value
Number
Average Value
Number
Average Value
Number
Average Value
LOANS ORIGINATED
18
$128,444
11
$78,000
35
$95,257
9
$14,889
12
$78,250
0
$0
APPLICATIONS APPROVED, NOT ACCEPTED
1
$120,000
5
$108,800
6
$63,333
1
$10,000
1
$70,000
0
$0
APPLICATIONS DENIED
2
$104,500
5
$62,800
30
$103,100
17
$22,941
6
$65,333
1
$101,000
APPLICATIONS WITHDRAWN
2
$115,500
1
$59,000
6
$110,667
1
$10,000
1
$59,000
0
$0
FILES CLOSED FOR INCOMPLETENESS
1
$104,000
0
$0
4
$107,500
1
$24,000
1
$70,000
0
$0
Aggregated Statistics For Year 2007 (Based on 1 full tract)
A) FHA, FSA/RHS & VA Home Purchase Loans
B) Conventional Home Purchase Loans
C) Refinancings
D) Home Improvement Loans
F) Non-occupant Loans on < 5 Family Dwellings (A B C & D)
Number
Average Value
Number
Average Value
Number
Average Value
Number
Average Value
Number
Average Value
LOANS ORIGINATED
3
$103,667
34
$89,147
42
$94,738
11
$49,545
14
$75,071
APPLICATIONS APPROVED, NOT ACCEPTED
0
$0
1
$119,000
6
$115,667
1
$22,000
1
$50,000
APPLICATIONS DENIED
3
$87,667
7
$95,286
54
$95,704
7
$36,857
6
$66,667
APPLICATIONS WITHDRAWN
2
$137,000
8
$160,750
12
$101,333
2
$36,500
5
$47,800
FILES CLOSED FOR INCOMPLETENESS
0
$0
2
$81,500
8
$100,625
0
$0
2
$73,500
Aggregated Statistics For Year 2006 (Based on 1 full tract)
A) FHA, FSA/RHS & VA Home Purchase Loans
B) Conventional Home Purchase Loans
C) Refinancings
D) Home Improvement Loans
E) Loans on Dwellings For 5+ Families
F) Non-occupant Loans on < 5 Family Dwellings (A B C & D)
Number
Average Value
Number
Average Value
Number
Average Value
Number
Average Value
Number
Average Value
Number
Average Value
LOANS ORIGINATED
11
$112,091
64
$73,281
64
$84,922
13
$26,462
1
$461,000
49
$63,612
APPLICATIONS APPROVED, NOT ACCEPTED
0
$0
11
$84,273
13
$63,154
6
$26,167
0
$0
11
$77,455
APPLICATIONS DENIED
0
$0
16
$81,688
48
$89,292
16
$51,188
0
$0
21
$83,095
APPLICATIONS WITHDRAWN
1
$108,000
10
$98,600
19
$96,105
1
$124,000
0
$0
4
$70,250
FILES CLOSED FOR INCOMPLETENESS
0
$0
6
$59,833
7
$142,143
0
$0
0
$0
4
$68,500
Aggregated Statistics For Year 2005 (Based on 1 full tract)
A) FHA, FSA/RHS & VA Home Purchase Loans
B) Conventional Home Purchase Loans
C) Refinancings
D) Home Improvement Loans
F) Non-occupant Loans on < 5 Family Dwellings (A B C & D)
Number
Average Value
Number
Average Value
Number
Average Value
Number
Average Value
Number
Average Value
LOANS ORIGINATED
7
$99,857
57
$74,772
39
$81,205
9
$46,889
33
$55,848
APPLICATIONS APPROVED, NOT ACCEPTED
0
$0
12
$62,167
10
$76,900
2
$27,500
3
$76,333
APPLICATIONS DENIED
0
$0
15
$63,733
50
$80,900
13
$40,692
8
$78,125
APPLICATIONS WITHDRAWN
0
$0
10
$111,500
27
$78,630
3
$48,333
5
$136,400
FILES CLOSED FOR INCOMPLETENESS
0
$0
3
$93,667
11
$88,364
0
$0
1
$92,000
Aggregated Statistics For Year 2004 (Based on 1 full tract)
A) FHA, FSA/RHS & VA Home Purchase Loans
B) Conventional Home Purchase Loans
C) Refinancings
D) Home Improvement Loans
F) Non-occupant Loans on < 5 Family Dwellings (A B C & D)
Number
Average Value
Number
Average Value
Number
Average Value
Number
Average Value
Number
Average Value
LOANS ORIGINATED
6
$80,667
35
$71,029
62
$70,306
15
$31,333
26
$50,731
APPLICATIONS APPROVED, NOT ACCEPTED
0
$0
3
$82,000
10
$42,100
2
$35,500
2
$59,000
APPLICATIONS DENIED
0
$0
6
$58,500
58
$75,207
11
$24,545
7
$52,286
APPLICATIONS WITHDRAWN
0
$0
6
$99,000
34
$84,029
6
$68,167
3
$67,000
FILES CLOSED FOR INCOMPLETENESS
0
$0
1
$68,000
16
$76,500
1
$20,000
2
$80,500
Aggregated Statistics For Year 2003 (Based on 1 full tract)
A) FHA, FSA/RHS & VA Home Purchase Loans
B) Conventional Home Purchase Loans
C) Refinancings
D) Home Improvement Loans
F) Non-occupant Loans on < 5 Family Dwellings (A B C & D)
Number
Average Value
Number
Average Value
Number
Average Value
Number
Average Value
Number
Average Value
LOANS ORIGINATED
8
$81,500
24
$63,333
82
$85,793
9
$51,111
27
$81,444
APPLICATIONS APPROVED, NOT ACCEPTED
0
$0
2
$72,500
16
$66,938
2
$50,000
4
$48,500
APPLICATIONS DENIED
0
$0
4
$76,750
53
$62,717
9
$32,222
9
$46,778
APPLICATIONS WITHDRAWN
1
$156,000
2
$59,000
28
$79,250
1
$103,000
5
$50,000
FILES CLOSED FOR INCOMPLETENESS
0
$0
0
$0
4
$79,000
0
$0
0
$0
Aggregated Statistics For Year 2002 (Based on 1 full tract)
A) FHA, FSA/RHS & VA Home Purchase Loans
B) Conventional Home Purchase Loans
C) Refinancings
D) Home Improvement Loans
F) Non-occupant Loans on < 5 Family Dwellings (A B C & D)
Number
Average Value
Number
Average Value
Number
Average Value
Number
Average Value
Number
Average Value
LOANS ORIGINATED
7
$12,388,286
25
$58,960
61
$63,689
8
$18,625
20
$41,900
APPLICATIONS APPROVED, NOT ACCEPTED
0
$0
4
$63,250
10
$75,100
0
$0
2
$27,500
APPLICATIONS DENIED
0
$0
4
$60,500
47
$81,170
10
$46,900
3
$50,000
APPLICATIONS WITHDRAWN
0
$0
0
$0
32
$80,125
2
$52,500
0
$0
FILES CLOSED FOR INCOMPLETENESS
0
$0
2
$77,500
6
$78,500
0
$0
0
$0
Aggregated Statistics For Year 2001 (Based on 1 full tract)
A) FHA, FSA/RHS & VA Home Purchase Loans
B) Conventional Home Purchase Loans
C) Refinancings
D) Home Improvement Loans
F) Non-occupant Loans on < 5 Family Dwellings (A B C & D)
Number
Average Value
Number
Average Value
Number
Average Value
Number
Average Value
Number
Average Value
LOANS ORIGINATED
6
$58,833
16
$43,062
45
$60,356
4
$16,000
10
$45,400
APPLICATIONS APPROVED, NOT ACCEPTED
0
$0
3
$37,667
13
$45,077
4
$17,750
2
$41,000
APPLICATIONS DENIED
1
$56,000
3
$106,333
48
$55,167
16
$12,875
8
$44,250
APPLICATIONS WITHDRAWN
0
$0
1
$50,000
27
$59,963
6
$11,500
1
$63,000
FILES CLOSED FOR INCOMPLETENESS
0
$0
0
$0
7
$62,857
0
$0
0
$0
Aggregated Statistics For Year 2000 (Based on 1 full tract)
A) FHA, FSA/RHS & VA Home Purchase Loans
B) Conventional Home Purchase Loans
C) Refinancings
D) Home Improvement Loans
E) Loans on Dwellings For 5+ Families
F) Non-occupant Loans on < 5 Family Dwellings (A B C & D)
Number
Average Value
Number
Average Value
Number
Average Value
Number
Average Value
Number
Average Value
Number
Average Value
LOANS ORIGINATED
18
$60,667
18
$56,833
25
$50,760
6
$18,667
2
$281,500
6
$41,333
APPLICATIONS APPROVED, NOT ACCEPTED
1
$33,000
1
$38,000
5
$62,200
0
$0
0
$0
0
$0
APPLICATIONS DENIED
1
$37,000
6
$41,000
23
$38,957
14
$18,714
0
$0
8
$35,250
APPLICATIONS WITHDRAWN
1
$50,000
1
$100,000
11
$47,818
1
$59,000
0
$0
1
$50,000
FILES CLOSED FOR INCOMPLETENESS
0
$0
0
$0
3
$48,333
0
$0
0
$0
3
$48,333
Aggregated Statistics For Year 1999 (Based on 1 partial tract)
A) FHA, FSA/RHS & VA Home Purchase Loans
B) Conventional Home Purchase Loans
C) Refinancings
D) Home Improvement Loans
E) Loans on Dwellings For 5+ Families
F) Non-occupant Loans on < 5 Family Dwellings (A B C & D)
Detailed PMIC statistics for the following Tracts:4063.00
2004 - 2018 National Fire Incident Reporting System (NFIRS) incidents
Based on the data from the years 2004 - 2018 the average number of fires per year is 13. The highest number of reported fire incidents - 36 took place in 2016, and the least - 0 in 2009. The data has a rising trend.
When looking into fire subcategories, the most reports belonged to: Structure Fires (85.9%), and Outside Fires (7.0%).
Fire incident types reported to NFIRS in Upland, PA


 Recent articles from our blog. Our writers, many of them Ph.D. graduates or candidates, create easy-to-read articles on a wide variety of topics.

 , pop. 78,620).


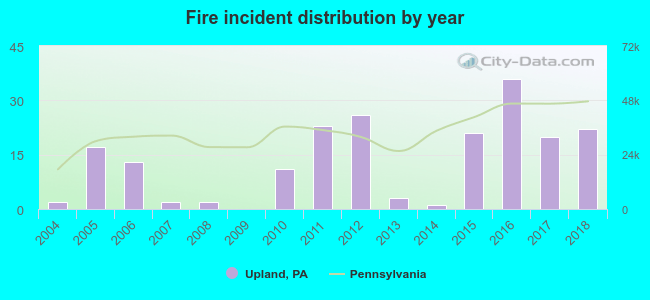 Based on the data from the years 2004 - 2018 the average number of fires per year is 13. The highest number of reported fire incidents - 36 took place in 2016, and the least - 0 in 2009. The data has a rising trend.
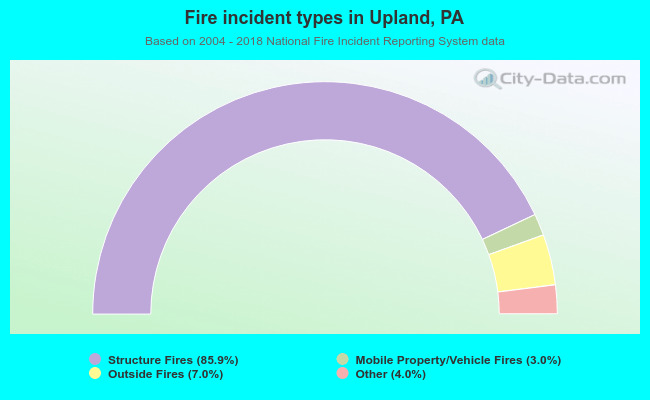 When looking into fire subcategories, the most reports belonged to: Structure Fires (85.9%), and Outside Fires (7.0%).