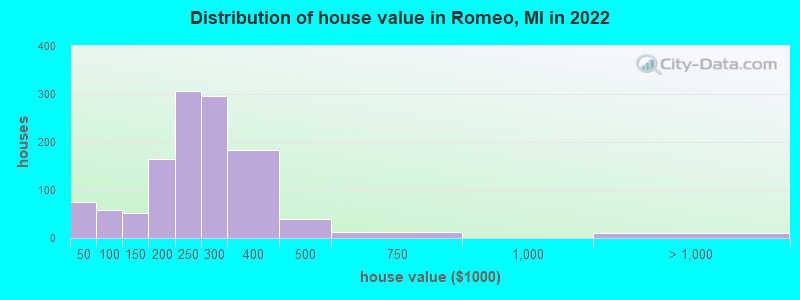
Estimated median house or condo value in 2022: $254,410 (it was $143,200 in 2000)
Romeo:
$254,410
MI:
$224,400
Mean prices in 2022:all housing units: $261,116; detached houses: $281,303; townhouses or other attached units: $204,486; in 2-unit structures: $213,052; in 3-to-4-unit structures: $158,091; in 5-or-more-unit structures: $122,491; mobile homes: $49,436; occupied boats, rvs, vans, etc.: $74,130
Median gross rent in 2022: $894.
March 2022 cost of living index in Romeo: 96.6 (near average, U.S. average is 100)
Percentage of residents living in poverty in 2022: 10.9%
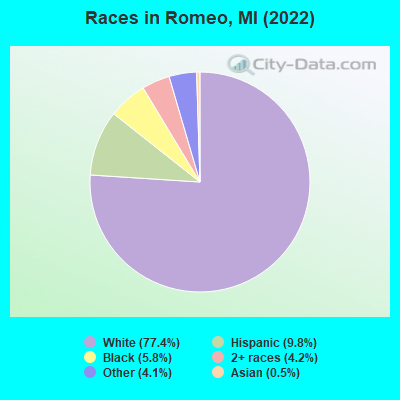
(12.8% for White Non-Hispanic residents, 3.6% for Black residents, 2.0% for Hispanic or Latino residents, 4.1% for other race residents, 8.0% for two or more races residents)
According to our research of Michigan and other state lists, there were 5 registered sex offenders living in Romeo, Michigan as of June 08, 2024. The ratio of all residents to sex offenders in Romeo is 791 to 1. The ratio of registered sex offenders to all residents in this city is much lower than the state average.
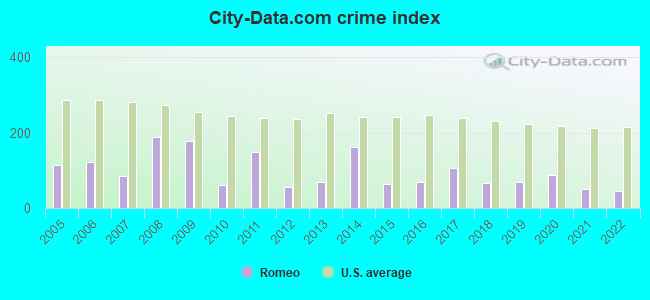
Crime rates in Romeo by year
Type
2009
2010
2011
2012
2013
2014
2015
2016
2017
2018
2019
2020
2021
2022
Murders (per 100,000)
0 (0.0)
0 (0.0)
0 (0.0)
0 (0.0)
0 (0.0)
0 (0.0)
0 (0.0)
0 (0.0)
0 (0.0)
0 (0.0)
0 (0.0)
0 (0.0)
0 (0.0)
0 (0.0)
Rapes (per 100,000)
2 (53.5)
0 (0.0)
2 (55.7)
0 (0.0)
0 (0.0)
2 (55.9)
0 (0.0)
1 (27.5)
2 (55.3)
1 (27.6)
1 (27.7)
3 (83.2)
1 (28.0)
1 (26.9)
Robberies (per 100,000)
1 (26.7)
0 (0.0)
0 (0.0)
0 (0.0)
0 (0.0)
0 (0.0)
0 (0.0)
0 (0.0)
0 (0.0)
0 (0.0)
0 (0.0)
0 (0.0)
0 (0.0)
0 (0.0)
Assaults (per 100,000)
12 (320.9)
1 (27.8)
4 (111.3)
0 (0.0)
5 (139.0)
11 (307.3)
4 (110.0)
0 (0.0)
3 (83.0)
1 (27.6)
6 (166.3)
1 (27.7)
2 (56.0)
2 (53.9)
Burglaries (per 100,000)
6 (160.5)
6 (166.9)
14 (389.6)
3 (83.2)
3 (83.4)
5 (139.7)
2 (55.0)
1 (27.5)
5 (138.3)
3 (82.8)
2 (55.4)
1 (27.7)
0 (0.0)
0 (0.0)
Thefts (per 100,000)
41 (1,097)
30 (834.3)
43 (1,197)
40 (1,110)
31 (861.8)
40 (1,117)
35 (962.6)
40 (1,102)
27 (746.7)
28 (772.8)
7 (194.0)
12 (332.7)
9 (252.2)
11 (296.4)
Auto thefts (per 100,000)
3 (80.2)
4 (111.2)
3 (83.5)
2 (55.5)
1 (27.8)
0 (0.0)
0 (0.0)
1 (27.5)
2 (55.3)
1 (27.6)
1 (27.7)
0 (0.0)
3 (84.1)
1 (26.9)
Arson (per 100,000)
1 (26.7)
2 (55.6)
0 (0.0)
1 (27.7)
0 (0.0)
0 (0.0)
1 (27.5)
0 (0.0)
0 (0.0)
0 (0.0)
1 (27.7)
0 (0.0)
0 (0.0)
0 (0.0)
City-Data.com crime index
176.5
59.5
148.6
54.6
70.3
160.6
64.4
70.2
104.8
66.5
69.3
87.3
50.4
46.3
The City-Data.com crime index weighs serious crimes and violent crimes more heavily. Higher means more crime, U.S. average is 246.1. It adjusts for the number of visitors and daily workers commuting into cities.
Latest news from Romeo, MI collected exclusively by city-data.com from local newspapers, TV, and radio stations
Ancestries: German (14.5%), American (12.1%), Italian (7.8%), English (7.7%), French Canadian (3.6%), Irish (3.2%).
Current Local Time: EST time zone
Elevation: 810 feet
Land area: 2.02 square miles.
Population density: 1,851 people per square mile (low).
184 residents are foreign born (3.1% Latin America, 1.0% Europe).
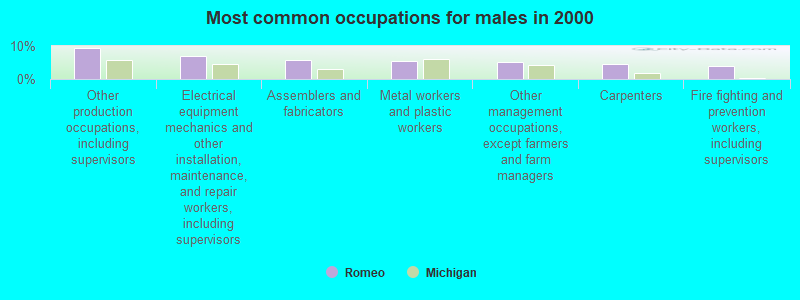
This village:
5.0%
Michigan:
6.9%
Median real estate property taxes paid for housing units with mortgages in 2022: $2,905 (1.1%) Median real estate property taxes paid for housing units with no mortgage in 2022: $2,453 (1.0%)
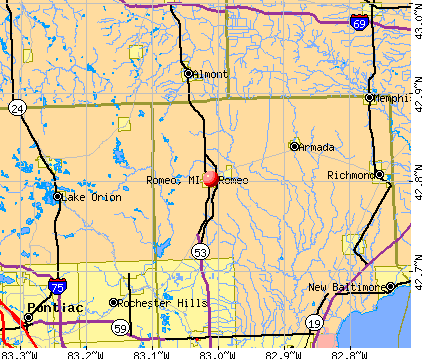
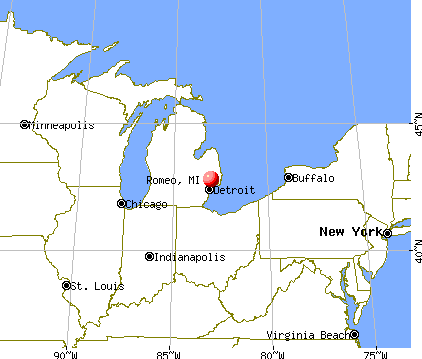
Nearest city with pop. 50,000+: Shelby, MI (9.2 miles , pop. 65,159).
Nearest city with pop. 200,000+: Detroit, MI (29.2 miles , pop. 951,270).
Nearest city with pop. 1,000,000+: Chicago, IL (247.8 miles , pop. 2,896,016).
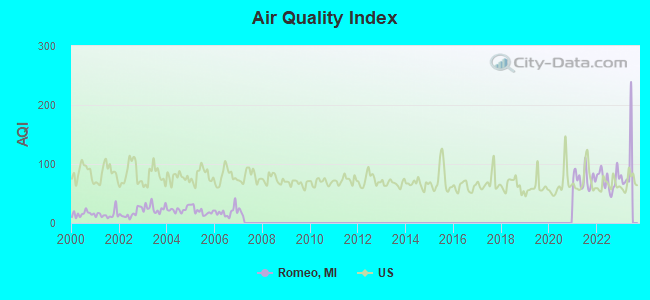
Air Quality Index (AQI) level in 2022 was 73.6. This is about average.
City:
73.6
U.S.:
72.6
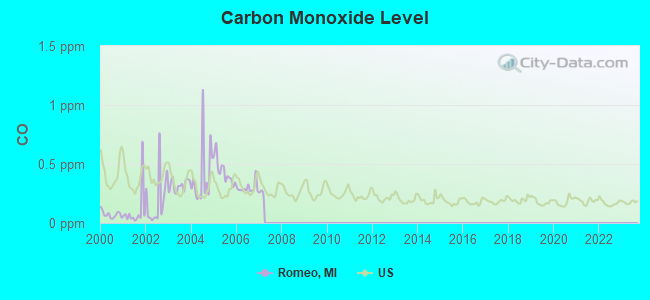
Carbon Monoxide (CO) [ppm] level in 2006 was 0.297. This is about average.Closest monitor was 20.0 miles away from the city center.
City:
0.297
U.S.:
0.251
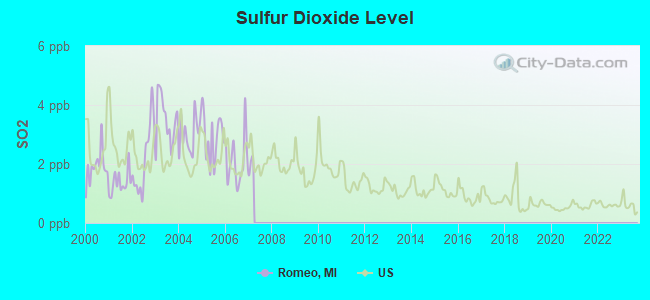
Sulfur Dioxide (SO2) [ppb] level in 2006 was 2.09. This is worse than average.Closest monitor was 11.3 miles away from the city center.
City:
2.09
U.S.:
1.51
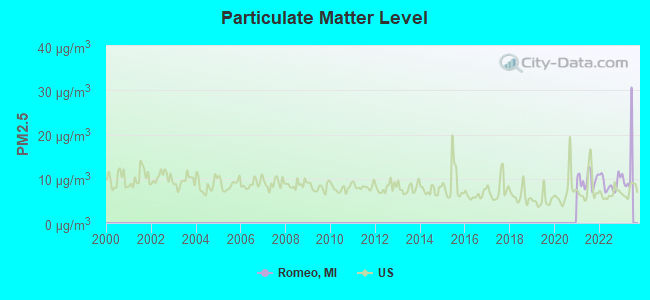
Particulate Matter (PM2.5) [µg/m3] level in 2022 was 8.94. This is about average.Closest monitor was 12.1 miles away from the city center.
City:
8.94
U.S.:
8.11
Tornado activity:
Romeo-area historical tornado activity is slightly above Michigan state average. It is 15% greater than the overall U.S. average.
On 5/8/1964, a category F4 (max. wind speeds 207-260 mph) tornado 13.0 miles away from the Romeo village center killed 11 peopleand injured 224 peopleand causedbetween $500,000 and $5,000,000 in damages.
On 6/8/1953, a category F5 (max. wind speeds 261-318 mph) tornado 32.7 miles away from the village center killed 116 peopleand injured 844 peopleand causedbetween $5,000,000 and $50,000,000 in damages.
Earthquake activity:
Romeo-area historical earthquake activity is significantly above Michigan state average. It is 53% smaller than the overall U.S. average.
On 9/25/1998 at 19:52:52, a magnitude 5.2 (4.8 MB, 4.3 MS, 5.2 LG, 4.5 MW, Depth: 3.1 mi, Class: Moderate, Intensity: VI - VII) earthquake occurred 161.9 miles away from Romeo center On 1/31/1986 at 16:46:43, a magnitude 5.0 (5.0 MB) earthquake occurred 126.1 miles away from Romeo center On 7/12/1986 at 08:19:37, a magnitude 4.5 (4.5 MB, Class: Light, Intensity: IV - V) earthquake occurred 171.8 miles away from the city center On 5/2/2015 at 16:23:07, a magnitude 4.2 (4.2 MW, Depth: 2.8 mi) earthquake occurred 129.3 miles away from Romeo center On 7/27/1980 at 18:52:21, a magnitude 5.2 (5.1 MB, 4.7 MS, 5.0 UK, 5.2 UK) earthquake occurred 321.8 miles away from the city center On 8/23/2011 at 17:51:04, a magnitude 5.8 (5.8 MW, Depth: 3.7 mi) earthquake occurred 431.2 miles away from the city center Magnitude types: regional Lg-wave magnitude (LG), body-wave magnitude (MB), surface-wave magnitude (MS), moment magnitude (MW)
Natural disasters:
The number of natural disasters in Macomb County (15) is near the US average (15). Major Disasters (Presidential) Declared: 9 Emergencies Declared: 5
Causes of natural disasters: Storms: 9, Floods: 7, Tornadoes: 3, Winter Storms: 2, Blizzard: 1, Hurricane: 1, Power Outage: 1, Snowstorm: 1, Wind: 1, Other: 1 (Note: some incidents may be assigned to more than one category).
Hospitals and medical centers in Romeo:
BAY NURSING INC (255 NORTH BAILEY STREET)
COMFORTING ANGEL HOME CARE, L L C (69216 POWELL ROAD)
ROMEO CONTINUING CARE, INC (309 S BAILEY PO BOX 306)
Notable locations in Romeo: Romeo Nursing Center (A), Romeo District Library (B), Romeo Village Police Department (C), Romeo Historical Society Museum (D), Bancroft Museum (E), Bruce Township Fire Department Station 3 (F). Display/hide their locations on the map
Churches in Romeo include: River of God Community Church (A), Harvest Fellowship of Romeo (B), Romeo Church of Christ (C), Jesus Baptist Detroit Church (D), Saint John Lutheran Church (E), Saint Clement Catholic Church (F), Second Baptist Church (G), Romeo First Church of God (H), Zion Temple (I). Display/hide their locations on the map
WOODSIDE BIBLE CHURCH (Population served: 40,Primary Water Source Type: Groundwater)
ROMEO EXPEDITORS INC. (Population served: 25,Primary Water Source Type: Groundwater)
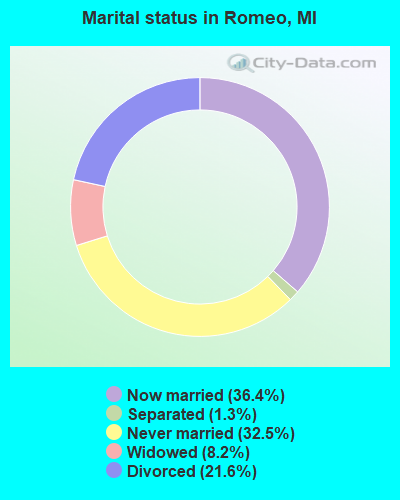
Average household size:
This village:
2.4 people
Michigan:
2.5 people
Percentage of family households:
This village:
65.2%
Whole state:
66.0%
Percentage of households with unmarried partners:
This village:
4.0%
Whole state:
6.4%
Likely homosexual households (counted as self-reported same-sex unmarried-partner households)
Lesbian couples: 0.1% of all households
Gay men: 0.1% of all households
56 people in nursing facilities/skilled-nursing facilities in 2010
61 people in nursing homes in 2000
Banks with branches in Romeo (2011 data):
PNC Bank, National Association: Romeo Drive In at 66640 Van Dyke, branch established on 1980/03/01; Romeo Branch at 100 South Main Street, branch established on 1959/09/01. Info updated 2012/03/20: Bank assets: $263,309.6 mil, Deposits: $197,343.0 mil, headquarters in Wilmington, DE, positive income, Commercial Lending Specialization, 3085 total offices, Holding Company: Pnc Financial Services Group, Inc., The
Citizens Bank: 141 South Main Street Branch at 141 South Main Street, branch established on 1889/01/01. Info updated 2011/08/01: Bank assets: $9,212.3 mil, Deposits: $7,452.0 mil, headquarters in Flint, MI, positive income, Commercial Lending Specialization, 220 total offices, Holding Company: Citizens Republic Bancorp, Inc.
Fifth Third Bank: Romeo Branch at 67855 Van Dyke, branch established on 1993/10/20. Info updated 2009/10/05: Bank assets: $114,540.4 mil, Deposits: $89,689.1 mil, headquarters in Cincinnati, OH, positive income, Commercial Lending Specialization, 1378 total offices, Holding Company: Fifth Third Bancorp
The Huntington National Bank: Romeo Branch at 64961 Van Dyke Highway, branch established on 1972/01/14. Info updated 2012/04/02: Bank assets: $54,183.4 mil, Deposits: $44,300.3 mil, headquarters in Columbus, OH, positive income, Commercial Lending Specialization, 878 total offices, Holding Company: Huntington Bancshares Incorporated
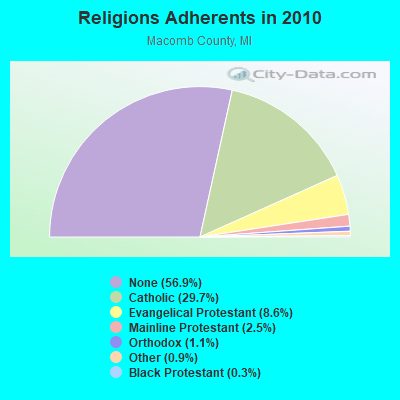
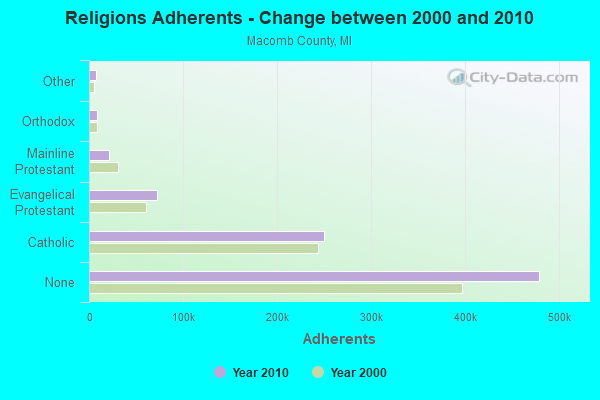
Religion statistics for Romeo, MI (based on Macomb County data)
Religion
Adherents
Congregations
Catholic
249,439
57
Evangelical Protestant
72,383
188
Mainline Protestant
21,221
65
Orthodox
8,925
6
Other
7,482
28
Black Protestant
2,670
12
None
478,858
-
Source: Clifford Grammich, Kirk Hadaway, Richard Houseal, Dale E.Jones, Alexei Krindatch, Richie Stanley and Richard H.Taylor. 2012. 2010 U.S.Religion Census: Religious Congregations & Membership Study. Association of Statisticians of American Religious Bodies. Jones, Dale E., et al. 2002. Congregations and Membership in the United States 2000. Nashville, TN: Glenmary Research Center. Graphs represent county-level data
Aircraft: CESSNA 182T (Category: Land, Seats: 4, Weight: Up to 12,499 Pounds), Engine: LYCOMING IO-540 SER (300 HP) (Reciprocating) N-Number: 229LP, N229LP, N-229LP, Serial Number: 18281229, Year manufactured: 2003, Airworthiness Date: 07/23/2003, Certificate Issue Date: 01/04/2016 Registrant (LLC): Duke Air LLC, 80131 Wood Ridge Ln, Romeo, MI 48065
Aircraft: HARTSIG MORGAN ZENAIR CH601 (Category: Land, Seats: 2, Weight: Up to 12,499 Pounds), Engine: BOMBARDIER ROTAX (ALL) (Reciprocating) N-Number: 41013, N41013, N-41013, Serial Number: 6-3087, Year manufactured: 1994, Airworthiness Date: 12/19/1994, Certificate Issue Date: 08/24/1994 Registrant (Individual): Morgan Hartsig, 371 West Gates Road, Romeo, MI 48065
Aircraft: PIPER PA-28-180 (Category: Land, Seats: 4, Weight: Up to 12,499 Pounds, Speed: 107 mph), Engine: LYCOMING O&VO-360 SER (180 HP) (Reciprocating) N-Number: 73GS, N73GS, N-73GS, Serial Number: 28-7305573, Year manufactured: 1973, Airworthiness Date: 07/30/1973, Certificate Issue Date: 02/26/2007 Registrant (Individual): Gregory A Hill, 75960 Brown Rd, Romeo, MI 48065
Aircraft: PIPER PA-24-250 (Category: Land, Seats: 4, Weight: Up to 12,499 Pounds, Speed: 135 mph), Engine: LYCOMING 0-540 SERIES (250 HP) (Reciprocating) N-Number: 8349P, N8349P, N-8349P, Serial Number: 24-3606, Year manufactured: 1964, Airworthiness Date: 01/24/1964, Certificate Issue Date: 01/10/2011 Registrant (Individual): Douglas M Pickett, 129 1st St, Romeo, MI 48065
Aircraft: HARRISON DANIEL A KOLB MARK II (Category: Land, Seats: 2, Weight: Up to 12,499 Pounds), Engine: BOMBARDIER ROTAX (ALL) (Reciprocating) N-Number: 7140Z, N7140Z, N-7140Z, Serial Number: M2-172, Year manufactured: 1990, Airworthiness Date: 10/23/1990 Registrant (Individual): Reported Sale, Unknown, Romeo, MI 48065 Deregistered:Cancel Date: 02/07/2018
Home Mortgage Disclosure Act Aggregated Statistics For Year 2009 (Based on 1 full tract)
A) FHA, FSA/RHS & VA Home Purchase Loans
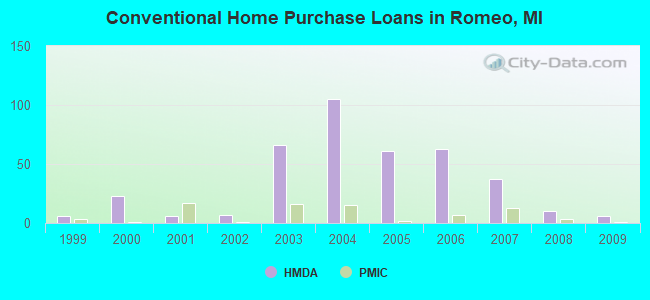
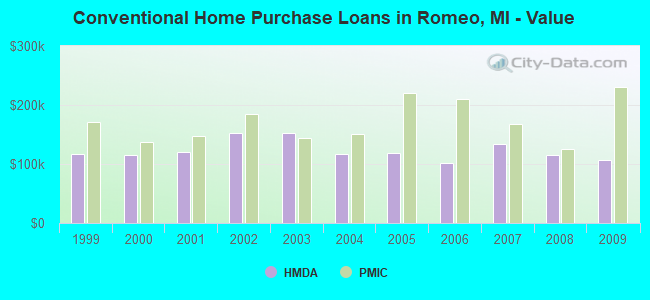
B) Conventional Home Purchase Loans
C) Refinancings
D) Home Improvement Loans
E) Loans on Dwellings For 5+ Families
F) Non-occupant Loans on < 5 Family Dwellings (A B C & D)
G) Loans On Manufactured Home Dwelling (A B C & D)
Number
Average Value
Number
Average Value
Number
Average Value
Number
Average Value
Number
Average Value
Number
Average Value
Number
Average Value
LOANS ORIGINATED
16
$108,000
6
$106,667
40
$133,325
1
$160,000
1
$254,000
1
$63,000
0
$0
APPLICATIONS APPROVED, NOT ACCEPTED
0
$0
2
$211,500
7
$153,286
1
$25,000
0
$0
0
$0
0
$0
APPLICATIONS DENIED
10
$115,400
4
$118,000
22
$137,364
2
$14,500
0
$0
3
$97,667
1
$10,000
APPLICATIONS WITHDRAWN
1
$140,000
3
$101,667
8
$139,250
0
$0
0
$0
1
$84,000
0
$0
FILES CLOSED FOR INCOMPLETENESS
1
$41,000
0
$0
4
$157,000
0
$0
0
$0
0
$0
0
$0
Aggregated Statistics For Year 2008 (Based on 1 full tract)
A) FHA, FSA/RHS & VA Home Purchase Loans
B) Conventional Home Purchase Loans
C) Refinancings
D) Home Improvement Loans
F) Non-occupant Loans on < 5 Family Dwellings (A B C & D)
G) Loans On Manufactured Home Dwelling (A B C & D)
Number
Average Value
Number
Average Value
Number
Average Value
Number
Average Value
Number
Average Value
Number
Average Value
LOANS ORIGINATED
5
$121,800
10
$115,700
33
$129,121
4
$9,750
6
$111,000
0
$0
APPLICATIONS APPROVED, NOT ACCEPTED
0
$0
5
$114,400
5
$89,800
1
$5,000
1
$80,000
0
$0
APPLICATIONS DENIED
5
$117,200
5
$76,600
32
$155,531
1
$10,000
4
$68,500
3
$64,667
APPLICATIONS WITHDRAWN
0
$0
2
$113,500
12
$169,250
0
$0
0
$0
0
$0
FILES CLOSED FOR INCOMPLETENESS
1
$121,000
0
$0
2
$185,000
0
$0
0
$0
0
$0
Aggregated Statistics For Year 2007 (Based on 1 full tract)
A) FHA, FSA/RHS & VA Home Purchase Loans
B) Conventional Home Purchase Loans
C) Refinancings
D) Home Improvement Loans
E) Loans on Dwellings For 5+ Families
F) Non-occupant Loans on < 5 Family Dwellings (A B C & D)
G) Loans On Manufactured Home Dwelling (A B C & D)
Number
Average Value
Number
Average Value
Number
Average Value
Number
Average Value
Number
Average Value
Number
Average Value
Number
Average Value
LOANS ORIGINATED
3
$129,333
37
$133,351
64
$133,156
4
$32,750
2
$914,500
4
$187,000
0
$0
APPLICATIONS APPROVED, NOT ACCEPTED
1
$133,000
3
$164,667
19
$148,737
4
$11,250
0
$0
0
$0
0
$0
APPLICATIONS DENIED
0
$0
9
$143,111
44
$149,091
3
$83,333
0
$0
4
$215,000
2
$15,500
APPLICATIONS WITHDRAWN
0
$0
5
$143,400
16
$170,375
1
$20,000
0
$0
0
$0
0
$0
FILES CLOSED FOR INCOMPLETENESS
0
$0
0
$0
8
$151,500
0
$0
0
$0
0
$0
0
$0
Aggregated Statistics For Year 2006 (Based on 1 full tract)
A) FHA, FSA/RHS & VA Home Purchase Loans
B) Conventional Home Purchase Loans
C) Refinancings
D) Home Improvement Loans
F) Non-occupant Loans on < 5 Family Dwellings (A B C & D)
Number
Average Value
Number
Average Value
Number
Average Value
Number
Average Value
Number
Average Value
LOANS ORIGINATED
3
$186,667
63
$102,111
95
$119,474
16
$40,188
13
$144,000
APPLICATIONS APPROVED, NOT ACCEPTED
0
$0
2
$142,000
21
$133,476
5
$79,600
0
$0
APPLICATIONS DENIED
0
$0
7
$112,571
65
$140,338
14
$59,714
2
$102,000
APPLICATIONS WITHDRAWN
0
$0
11
$101,545
30
$151,600
3
$102,333
0
$0
FILES CLOSED FOR INCOMPLETENESS
0
$0
1
$130,000
9
$170,444
0
$0
0
$0
Aggregated Statistics For Year 2005 (Based on 1 full tract)
A) FHA, FSA/RHS & VA Home Purchase Loans
B) Conventional Home Purchase Loans
C) Refinancings
D) Home Improvement Loans
F) Non-occupant Loans on < 5 Family Dwellings (A B C & D)
G) Loans On Manufactured Home Dwelling (A B C & D)
Number
Average Value
Number
Average Value
Number
Average Value
Number
Average Value
Number
Average Value
Number
Average Value
LOANS ORIGINATED
7
$137,857
61
$118,262
131
$138,160
9
$46,222
9
$122,667
0
$0
APPLICATIONS APPROVED, NOT ACCEPTED
0
$0
9
$71,778
25
$152,080
0
$0
2
$85,500
1
$21,000
APPLICATIONS DENIED
0
$0
13
$122,923
83
$164,518
13
$74,846
9
$116,000
4
$30,500
APPLICATIONS WITHDRAWN
0
$0
14
$128,214
40
$142,000
6
$124,167
3
$123,667
0
$0
FILES CLOSED FOR INCOMPLETENESS
0
$0
1
$147,000
13
$142,308
0
$0
0
$0
0
$0
Aggregated Statistics For Year 2004 (Based on 1 full tract)
A) FHA, FSA/RHS & VA Home Purchase Loans
B) Conventional Home Purchase Loans
C) Refinancings
D) Home Improvement Loans
F) Non-occupant Loans on < 5 Family Dwellings (A B C & D)
G) Loans On Manufactured Home Dwelling (A B C & D)
Number
Average Value
Number
Average Value
Number
Average Value
Number
Average Value
Number
Average Value
Number
Average Value
LOANS ORIGINATED
8
$148,750
105
$117,038
132
$137,159
11
$110,182
10
$144,900
31
$40,677
APPLICATIONS APPROVED, NOT ACCEPTED
0
$0
54
$62,519
41
$99,683
5
$17,200
2
$131,500
60
$47,933
APPLICATIONS DENIED
1
$176,000
112
$47,286
61
$137,377
5
$27,800
1
$113,000
103
$38,650
APPLICATIONS WITHDRAWN
0
$0
20
$146,250
46
$154,652
4
$51,250
0
$0
0
$0
FILES CLOSED FOR INCOMPLETENESS
0
$0
4
$20,500
13
$167,385
1
$15,000
1
$129,000
4
$20,500
Aggregated Statistics For Year 2003 (Based on 1 full tract)
A) FHA, FSA/RHS & VA Home Purchase Loans
B) Conventional Home Purchase Loans
C) Refinancings
D) Home Improvement Loans
F) Non-occupant Loans on < 5 Family Dwellings (A B C & D)
Number
Average Value
Number
Average Value
Number
Average Value
Number
Average Value
Number
Average Value
LOANS ORIGINATED
7
$144,000
66
$152,470
310
$130,752
3
$38,333
12
$128,500
APPLICATIONS APPROVED, NOT ACCEPTED
0
$0
9
$157,000
26
$127,577
0
$0
4
$99,250
APPLICATIONS DENIED
0
$0
13
$42,615
161
$159,857
12
$9,917
4
$96,500
APPLICATIONS WITHDRAWN
0
$0
14
$126,214
85
$158,141
1
$25,000
2
$125,500
FILES CLOSED FOR INCOMPLETENESS
0
$0
1
$62,000
78
$155,769
0
$0
0
$0
Aggregated Statistics For Year 2002 (Based on 1 full tract)
A) FHA, FSA/RHS & VA Home Purchase Loans
B) Conventional Home Purchase Loans
C) Refinancings
D) Home Improvement Loans
F) Non-occupant Loans on < 5 Family Dwellings (A B C & D)
Number
Average Value
Number
Average Value
Number
Average Value
Number
Average Value
Number
Average Value
LOANS ORIGINATED
1
$188,000
7
$151,857
33
$133,000
1
$3,000
2
$102,500
APPLICATIONS APPROVED, NOT ACCEPTED
0
$0
0
$0
4
$108,750
0
$0
0
$0
APPLICATIONS DENIED
0
$0
0
$0
10
$163,800
0
$0
0
$0
APPLICATIONS WITHDRAWN
0
$0
1
$128,000
12
$160,417
2
$15,000
0
$0
FILES CLOSED FOR INCOMPLETENESS
0
$0
0
$0
21
$183,238
0
$0
0
$0
Aggregated Statistics For Year 2001 (Based on 1 full tract)
A) FHA, FSA/RHS & VA Home Purchase Loans
B) Conventional Home Purchase Loans
C) Refinancings
D) Home Improvement Loans
Number
Average Value
Number
Average Value
Number
Average Value
Number
Average Value
LOANS ORIGINATED
1
$122,000
6
$120,833
31
$133,516
3
$25,333
APPLICATIONS APPROVED, NOT ACCEPTED
0
$0
0
$0
5
$145,200
3
$34,333
APPLICATIONS DENIED
0
$0
1
$176,000
5
$39,400
0
$0
APPLICATIONS WITHDRAWN
0
$0
1
$280,000
3
$135,333
0
$0
FILES CLOSED FOR INCOMPLETENESS
0
$0
0
$0
0
$0
0
$0
Aggregated Statistics For Year 2000 (Based on 1 full tract)
A) FHA, FSA/RHS & VA Home Purchase Loans
B) Conventional Home Purchase Loans
C) Refinancings
D) Home Improvement Loans
F) Non-occupant Loans on < 5 Family Dwellings (A B C & D)
Number
Average Value
Number
Average Value
Number
Average Value
Number
Average Value
Number
Average Value
LOANS ORIGINATED
3
$121,000
23
$115,652
10
$128,200
2
$37,000
0
$0
APPLICATIONS APPROVED, NOT ACCEPTED
0
$0
40
$42,425
7
$121,143
0
$0
0
$0
APPLICATIONS DENIED
0
$0
289
$39,889
6
$130,667
1
$3,000
1
$95,000
APPLICATIONS WITHDRAWN
0
$0
4
$72,750
3
$90,333
1
$50,000
0
$0
FILES CLOSED FOR INCOMPLETENESS
0
$0
1
$107,000
4
$122,250
0
$0
0
$0
Aggregated Statistics For Year 1999 (Based on 1 full tract)
A) FHA, FSA/RHS & VA Home Purchase Loans
B) Conventional Home Purchase Loans
C) Refinancings
D) Home Improvement Loans
F) Non-occupant Loans on < 5 Family Dwellings (A B C & D)
Detailed PMIC statistics for the following Tracts:2067.00
2002 - 2018 National Fire Incident Reporting System (NFIRS) incidents
Based on the data from the years 2002 - 2018 the average number of fires per year is 15. The highest number of fires - 29 took place in 2015, and the least - 7 in 2013. The data has a decreasing trend.
When looking into fire subcategories, the most reports belonged to: Structure Fires (41.8%), and Outside Fires (33.6%).
Fire incident types reported to NFIRS in Romeo, MI


 Recent articles from our blog. Our writers, many of them Ph.D. graduates or candidates, create easy-to-read articles on a wide variety of topics.

 (9.2 miles


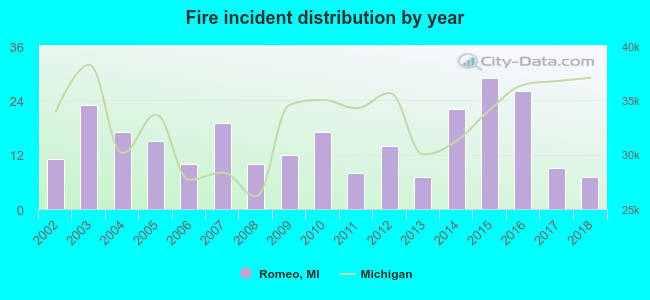 Based on the data from the years 2002 - 2018 the average number of fires per year is 15. The highest number of fires - 29 took place in 2015, and the least - 7 in 2013. The data has a decreasing trend.
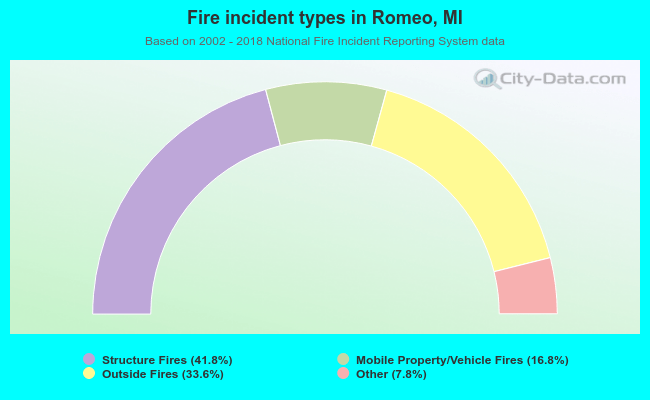 When looking into fire subcategories, the most reports belonged to: Structure Fires (41.8%), and Outside Fires (33.6%).