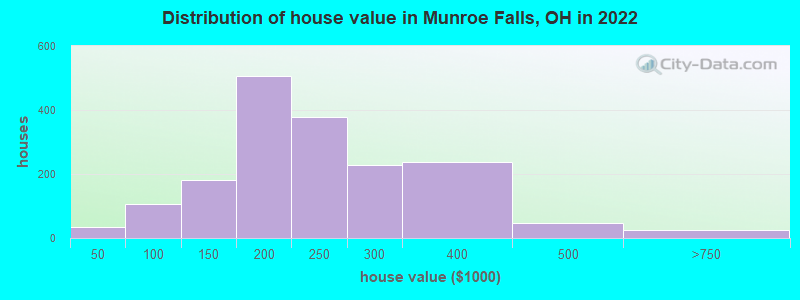
Estimated median house or condo value in 2022: $216,178 (it was $138,100 in 2000)
Munroe Falls:
$216,178
OH:
$204,100
Mean prices in 2022:all housing units: $225,684; detached houses: $227,087; townhouses or other attached units: $194,798March 2022 cost of living index in Munroe Falls: 93.7 (less than average, U.S. average is 100)
Percentage of residents living in poverty in 2022: 5.3%
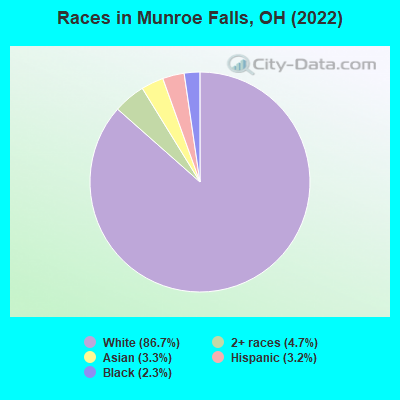
(4.1% for White Non-Hispanic residents, 19.4% for Black residents, 28.7% for two or more races residents)
According to our research of Ohio and other state lists, there was 1 registered sex offender living in Munroe Falls, Ohio as of June 08, 2024. The ratio of all residents to sex offenders in Munroe Falls is 5,044 to 1. The ratio of registered sex offenders to all residents in this city is much lower than the state average.
Crime rates in Munroe Falls by year
Type
2009
2010
2011
2012
2014
2015
2016
2017
2018
2019
2020
2021
2022
Murders (per 100,000)
0 (0.0)
0 (0.0)
0 (0.0)
0 (0.0)
0 (0.0)
0 (0.0)
0 (0.0)
0 (0.0)
0 (0.0)
0 (0.0)
0 (0.0)
0 (0.0)
0 (0.0)
Rapes (per 100,000)
1 (19.4)
0 (0.0)
0 (0.0)
0 (0.0)
0 (0.0)
0 (0.0)
1 (20.0)
0 (0.0)
0 (0.0)
0 (0.0)
1 (19.7)
0 (0.0)
1 (20.0)
Robberies (per 100,000)
0 (0.0)
0 (0.0)
0 (0.0)
0 (0.0)
0 (0.0)
0 (0.0)
0 (0.0)
0 (0.0)
0 (0.0)
0 (0.0)
1 (19.7)
1 (19.8)
0 (0.0)
Assaults (per 100,000)
1 (19.4)
0 (0.0)
1 (19.9)
0 (0.0)
0 (0.0)
3 (59.8)
1 (20.0)
1 (19.8)
1 (19.7)
0 (0.0)
0 (0.0)
0 (0.0)
6 (119.8)
Burglaries (per 100,000)
5 (97.1)
10 (199.5)
9 (179.4)
10 (200.2)
11 (218.8)
8 (159.5)
5 (99.8)
7 (138.6)
2 (39.5)
1 (19.7)
6 (118.5)
6 (118.7)
1 (20.0)
Thefts (per 100,000)
41 (796.3)
32 (638.5)
31 (618.0)
25 (500.6)
32 (636.6)
33 (658.0)
35 (698.3)
32 (633.5)
28 (552.9)
23 (452.8)
21 (414.7)
12 (237.4)
15 (299.6)
Auto thefts (per 100,000)
1 (19.4)
0 (0.0)
0 (0.0)
0 (0.0)
0 (0.0)
2 (39.9)
0 (0.0)
0 (0.0)
0 (0.0)
0 (0.0)
0 (0.0)
1 (19.8)
0 (0.0)
Arson (per 100,000)
0 (0.0)
0 (0.0)
1 (19.9)
0 (0.0)
1 (19.9)
0 (0.0)
2 (39.9)
0 (0.0)
0 (0.0)
0 (0.0)
0 (0.0)
1 (19.8)
0 (0.0)
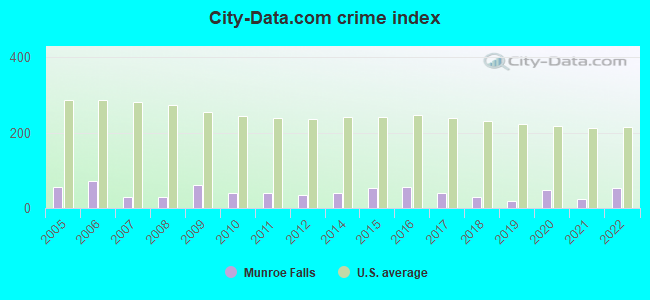
City-Data.com crime index
59.6
39.5
41.3
34.0
40.8
52.6
54.9
39.0
28.8
19.5
46.6
25.3
53.3
The City-Data.com crime index weighs serious crimes and violent crimes more heavily. Higher means more crime, U.S. average is 246.1. It adjusts for the number of visitors and daily workers commuting into cities.
Latest news from Munroe Falls, OH collected exclusively by city-data.com from local newspapers, TV, and radio stations
Ancestries: English (16.9%), German (13.0%), Italian (11.9%), Irish (10.2%), American (4.9%), European (4.9%).
Current Local Time: EST time zone
Incorporated in 1976
Elevation: 1100 feet
Land area: 2.74 square miles.
Population density: 1,827 people per square mile (low).
254 residents are foreign born (2.3% Asia, 1.3% Europe, 0.7% Latin America).
This city:
5.1%
Ohio:
4.9%
Median real estate property taxes paid for housing units with mortgages in 2022: $3,427 (1.5%) Median real estate property taxes paid for housing units with no mortgage in 2022: $3,001 (1.6%)
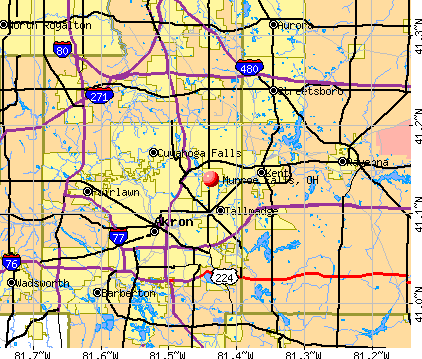
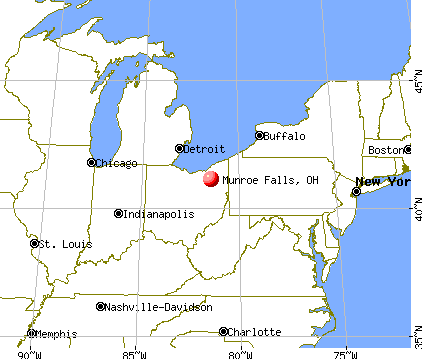
Nearest city with pop. 50,000+: Akron, OH (6.2 miles , pop. 217,074).
Nearest city with pop. 1,000,000+: Chicago, IL (326.9 miles , pop. 2,896,016).
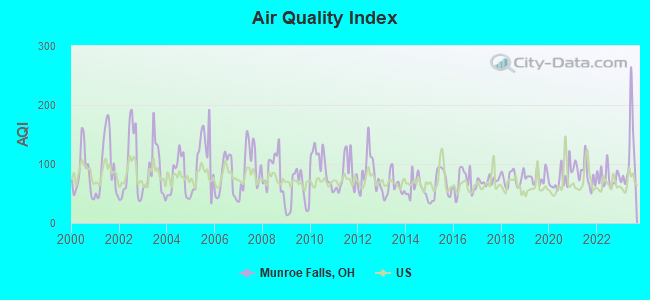
Air Quality Index (AQI) level in 2023 was 114. This is significantly worse than average.
City:
114
U.S.:
73
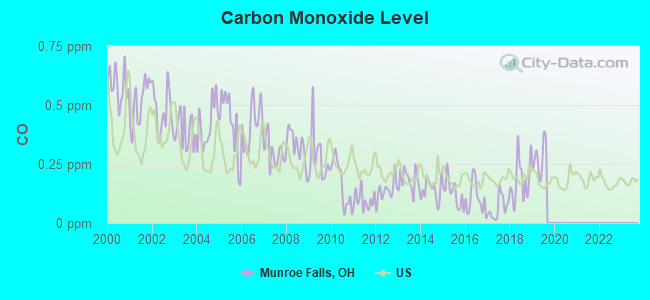
Carbon Monoxide (CO) [ppm] level in 2019 was 0.276. This is about average.Closest monitor was 4.1 miles away from the city center.
City:
0.276
U.S.:
0.251
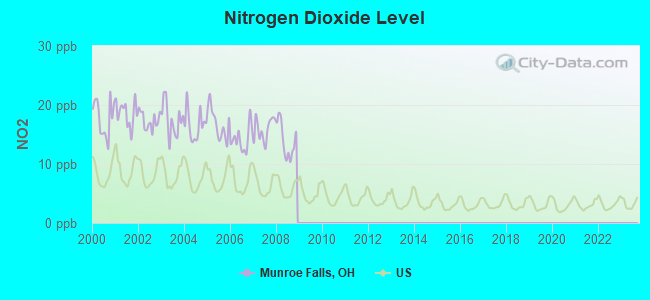
Nitrogen Dioxide (NO2) [ppb] level in 2008 was 14.0. This is significantly worse than average.Closest monitor was 2.0 miles away from the city center.
City:
14.0
U.S.:
5.1
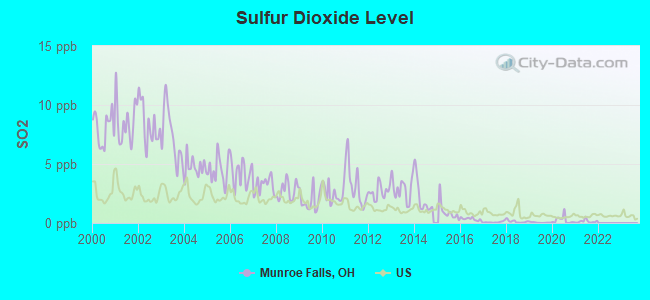
Sulfur Dioxide (SO2) [ppb] level in 2021 was 0.136. This is significantly better than average.Closest monitor was 2.0 miles away from the city center.
City:
0.136
U.S.:
1.515
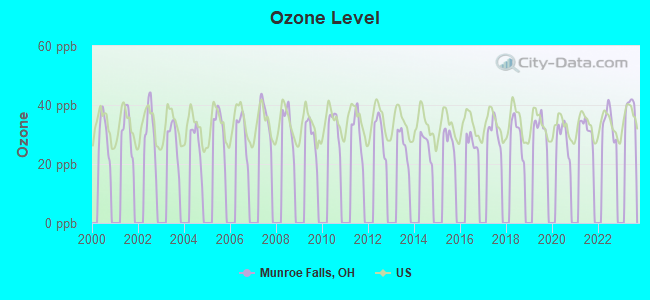
Ozone [ppb] level in 2022 was 34.2. This is about average.Closest monitor was 3.9 miles away from the city center.
City:
34.2
U.S.:
33.3
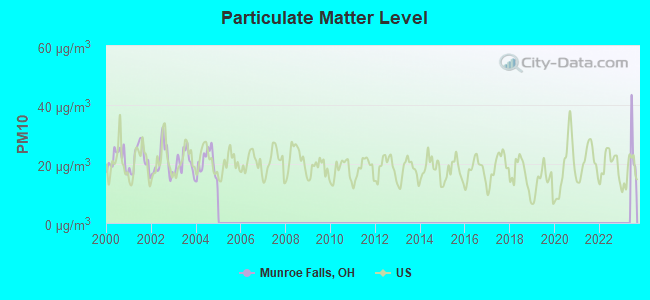
Particulate Matter (PM10) [µg/m3] level in 2004 was 20.4. This is about average.Closest monitor was 5.5 miles away from the city center.
City:
20.4
U.S.:
19.2
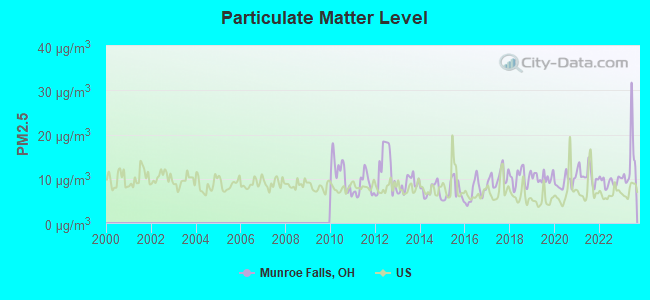
Particulate Matter (PM2.5) [µg/m3] level in 2023 was 13.9. This is significantly worse than average.Closest monitor was 5.5 miles away from the city center.
City:
13.9
U.S.:
8.1
Tornado activity:
Munroe Falls-area historical tornado activity is near Ohio state average. It is 9% greater than the overall U.S. average.
On 5/31/1985, a category F5 (max. wind speeds 261-318 mph) tornado 15.6 miles away from the Munroe Falls city center killed 18 peopleand injured 310 peopleand causedbetween $50,000,000 and $500,000,000 in damages.
On 4/11/1965, a category F4 (max. wind speeds 207-260 mph) tornado 24.3 miles away from the city center killed 18 peopleand injured 200 peopleand causedbetween $5,000,000 and $50,000,000 in damages.
Earthquake activity:
Munroe Falls-area historical earthquake activity is significantly above Ohio state average. It is 49% smaller than the overall U.S. average.
On 9/25/1998 at 19:52:52, a magnitude 5.2 (4.8 MB, 4.3 MS, 5.2 LG, 4.5 MW, Depth: 3.1 mi, Class: Moderate, Intensity: VI - VII) earthquake occurred 59.4 miles away from Munroe Falls center On 1/31/1986 at 16:46:43, a magnitude 5.0 (5.0 MB) earthquake occurred 35.1 miles away from Munroe Falls center On 8/23/2011 at 17:51:04, a magnitude 5.8 (5.8 MW, Depth: 3.7 mi) earthquake occurred 291.1 miles away from the city center On 7/27/1980 at 18:52:21, a magnitude 5.2 (5.1 MB, 4.7 MS, 5.0 UK, 5.2 UK) earthquake occurred 242.8 miles away from the city center On 6/10/2019 at 14:50:45, a magnitude 4.0 (4.0 MB, Depth: 1.2 mi, Class: Light, Intensity: IV - V) earthquake occurred 37.4 miles away from Munroe Falls center On 12/31/2011 at 20:05:01, a magnitude 4.0 (4.0 ML, Depth: 3.1 mi) earthquake occurred 39.3 miles away from the city center Magnitude types: regional Lg-wave magnitude (LG), body-wave magnitude (MB), local magnitude (ML), surface-wave magnitude (MS), moment magnitude (MW)
Natural disasters:
The number of natural disasters in Summit County (11) is smaller than the US average (15). Major Disasters (Presidential) Declared: 7 Emergencies Declared: 3
Causes of natural disasters: Storms: 6, Tornadoes: 5, Floods: 4, Winds: 2, Blizzard: 1, Hurricane: 1, Power Outage: 1, Snowstorm: 1, Tropical Depression: 1, Other: 1 (Note: some incidents may be assigned to more than one category).
Hospitals and medical centers in Munroe Falls:
DAVITA - MUNROE FALLS (265 NORTH MAIN STREET)
Other hospitals and medical centers near Munroe Falls:
HEATHER KNOLL RETIREMENT VILLAGE (Nursing Home, about 2 miles away; TALLMADGE, OH)
SUMMIT COUNTY NURSING HOME (Nursing Home, about 2 miles away; TALLMADGE, OH)
STOW-GLEN HOME HEALTH CARE (Home Health Center, about 2 miles away; STOW, OH)
STOW GLEN HEALTH CARE CENTER (Nursing Home, about 2 miles away; STOW, OH)
EVANT / LAKEVIEW HOME (Hospital, about 2 miles away; STOW, OH)
ALTERCARE OF CUYAHOGA FALLS CTR FOR REHAB AND NURSIN (Nursing Home, about 3 miles away; CUYAHOGA FALLS, OH)
BRIARWOOD THE (Nursing Home, about 3 miles away; STOW, OH)
Amtrak station near Munroe Falls:
6 miles: AKRON (906 E. BOWERY ST.) . Services: enclosed waiting area, public restrooms, public payphones, free short-term parking, free long-term parking, taxi stand.
Notable locations in Munroe Falls: Munroe Falls Fire Department Station 1 (A), Munroe Falls Fire Department Station 2 (B). Display/hide their locations on the map
Parks in Munroe Falls include: Guise Park (1), Monroe Falls Metropolitan Park (2), Riverside Park (3), Damon Park (4). Display/hide their locations on the map
Summit County has a predicted average indoor radon screening level greater than 4 pCi/L (pico curies per liter) - Highest Potential
Average household size:
This city:
2.4 people
Ohio:
2.4 people
Percentage of family households:
This city:
70.3%
Whole state:
65.0%
Percentage of households with unmarried partners:
This city:
5.2%
Whole state:
6.8%
Likely homosexual households (counted as self-reported same-sex unmarried-partner households)
Lesbian couples: 0.5% of all households
Gay men: 0.2% of all households
120 people in nursing homes in 2000
Banks with branches in Munroe Falls (2011 data):
North Akron Savings Bank: Munroe Falls Branch at 43 South Main Street, branch established on 1998/02/01. Info updated 2006/11/03: Bank assets: $157.6 mil, Deposits: $112.0 mil, headquarters in Akron, OH, negative income in the last year, Mortgage Lending Specialization, 5 total offices
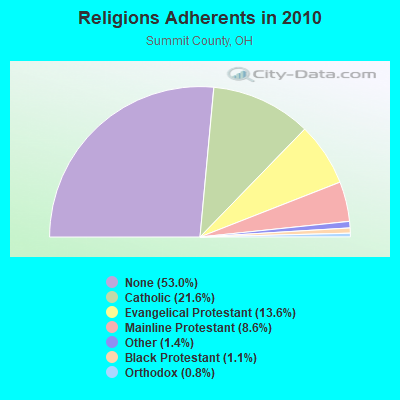
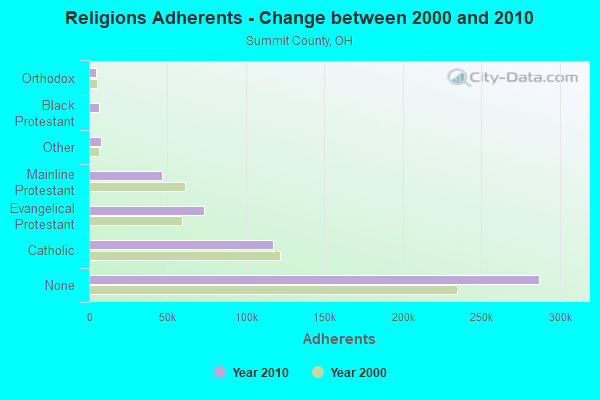
Religion statistics for Munroe Falls, OH (based on Summit County data)
Religion
Adherents
Congregations
Catholic
116,941
33
Evangelical Protestant
73,586
254
Mainline Protestant
46,521
127
Other
7,347
34
Black Protestant
6,129
26
Orthodox
4,230
12
None
287,027
-
Source: Clifford Grammich, Kirk Hadaway, Richard Houseal, Dale E.Jones, Alexei Krindatch, Richie Stanley and Richard H.Taylor. 2012. 2010 U.S.Religion Census: Religious Congregations & Membership Study. Association of Statisticians of American Religious Bodies. Jones, Dale E., et al. 2002. Congregations and Membership in the United States 2000. Nashville, TN: Glenmary Research Center. Graphs represent county-level data
Aircraft: RASMUSSEN RONALD H ONEX (Category: Land, Weight: Up to 12,499 Pounds), Engine: HUMMEL 2180 (76 HP) (Reciprocating) N-Number: 1231X, N1231X, N-1231X, Serial Number: ONX0030, Year manufactured: 2013, Airworthiness Date: 04/01/2014, Certificate Issue Date: 11/19/2019 Registrant (Individual): Benjamin T Hedderly, 248 N River Rd, Munroe Falls, OH 44262
Aircraft: CESSNA 170B (Category: Land, Seats: 4, Weight: Up to 12,499 Pounds, Speed: 105 mph), Engine: CONT MOTOR 0-300 SER (145 HP) (Reciprocating) N-Number: 2917D, N2917D, N-2917D, Serial Number: 26860, Year manufactured: 1955, Airworthiness Date: 05/25/1956, Certificate Issue Date: 11/16/2017 Registrant (Individual): Michael E Young, 289 Gaylord Dr, Munroe Falls, OH 44262
Home Mortgage Disclosure Act Aggregated Statistics For Year 2009 (Based on 1 full tract)
A) FHA, FSA/RHS & VA Home Purchase Loans
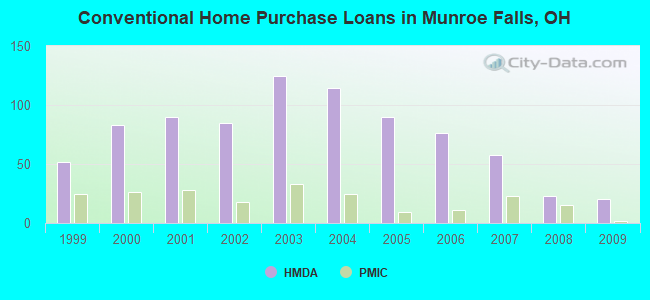
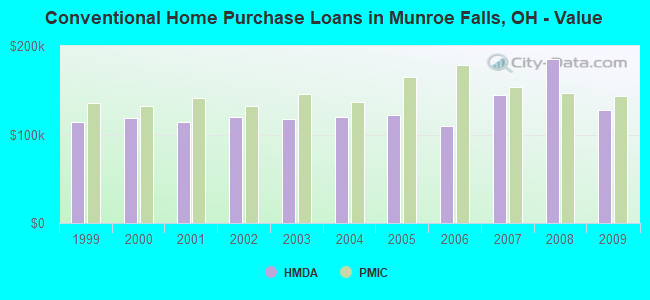
B) Conventional Home Purchase Loans
C) Refinancings
D) Home Improvement Loans
F) Non-occupant Loans on < 5 Family Dwellings (A B C & D)
Number
Average Value
Number
Average Value
Number
Average Value
Number
Average Value
Number
Average Value
LOANS ORIGINATED
37
$139,946
20
$127,250
92
$134,620
2
$23,000
2
$93,000
APPLICATIONS APPROVED, NOT ACCEPTED
2
$147,500
1
$50,000
10
$178,200
2
$4,000
0
$0
APPLICATIONS DENIED
3
$188,333
2
$95,000
37
$143,514
7
$13,429
3
$115,000
APPLICATIONS WITHDRAWN
1
$108,000
4
$71,250
17
$148,647
2
$4,500
1
$136,000
FILES CLOSED FOR INCOMPLETENESS
0
$0
0
$0
9
$174,889
0
$0
0
$0
Aggregated Statistics For Year 2008 (Based on 1 full tract)
A) FHA, FSA/RHS & VA Home Purchase Loans
B) Conventional Home Purchase Loans
C) Refinancings
D) Home Improvement Loans
F) Non-occupant Loans on < 5 Family Dwellings (A B C & D)
Number
Average Value
Number
Average Value
Number
Average Value
Number
Average Value
Number
Average Value
LOANS ORIGINATED
21
$135,571
23
$184,957
53
$128,811
11
$22,455
3
$104,667
APPLICATIONS APPROVED, NOT ACCEPTED
0
$0
2
$218,500
7
$144,143
2
$10,000
0
$0
APPLICATIONS DENIED
2
$107,000
4
$80,750
42
$142,405
12
$65,167
1
$144,000
APPLICATIONS WITHDRAWN
2
$131,500
2
$132,000
7
$149,143
1
$10,000
1
$84,000
FILES CLOSED FOR INCOMPLETENESS
0
$0
1
$154,000
3
$78,667
2
$26,000
0
$0
Aggregated Statistics For Year 2007 (Based on 1 full tract)
A) FHA, FSA/RHS & VA Home Purchase Loans
B) Conventional Home Purchase Loans
C) Refinancings
D) Home Improvement Loans
E) Loans on Dwellings For 5+ Families
F) Non-occupant Loans on < 5 Family Dwellings (A B C & D)
Number
Average Value
Number
Average Value
Number
Average Value
Number
Average Value
Number
Average Value
Number
Average Value
LOANS ORIGINATED
5
$180,800
58
$144,966
66
$134,182
9
$50,889
2
$545,000
5
$79,200
APPLICATIONS APPROVED, NOT ACCEPTED
0
$0
6
$154,167
22
$82,773
7
$36,143
0
$0
1
$112,000
APPLICATIONS DENIED
2
$155,000
7
$90,714
62
$138,565
19
$19,737
0
$0
4
$151,750
APPLICATIONS WITHDRAWN
0
$0
4
$101,000
20
$133,600
2
$71,500
0
$0
1
$112,000
FILES CLOSED FOR INCOMPLETENESS
0
$0
2
$185,500
11
$135,364
0
$0
0
$0
0
$0
Aggregated Statistics For Year 2006 (Based on 1 full tract)
A) FHA, FSA/RHS & VA Home Purchase Loans
B) Conventional Home Purchase Loans
C) Refinancings
D) Home Improvement Loans
F) Non-occupant Loans on < 5 Family Dwellings (A B C & D)
G) Loans On Manufactured Home Dwelling (A B C & D)
Number
Average Value
Number
Average Value
Number
Average Value
Number
Average Value
Number
Average Value
Number
Average Value
LOANS ORIGINATED
14
$146,429
76
$109,934
109
$108,294
11
$30,818
15
$104,800
0
$0
APPLICATIONS APPROVED, NOT ACCEPTED
0
$0
14
$95,000
21
$108,429
2
$40,000
3
$120,000
0
$0
APPLICATIONS DENIED
0
$0
10
$121,900
79
$121,051
14
$33,071
18
$124,889
1
$11,000
APPLICATIONS WITHDRAWN
0
$0
8
$96,875
34
$130,382
4
$56,750
4
$93,750
0
$0
FILES CLOSED FOR INCOMPLETENESS
0
$0
2
$110,000
20
$154,500
1
$43,000
1
$72,000
0
$0
Aggregated Statistics For Year 2005 (Based on 1 full tract)
A) FHA, FSA/RHS & VA Home Purchase Loans
B) Conventional Home Purchase Loans
C) Refinancings
D) Home Improvement Loans
E) Loans on Dwellings For 5+ Families
F) Non-occupant Loans on < 5 Family Dwellings (A B C & D)
Number
Average Value
Number
Average Value
Number
Average Value
Number
Average Value
Number
Average Value
Number
Average Value
LOANS ORIGINATED
8
$131,250
90
$122,511
116
$115,560
13
$80,231
0
$0
5
$116,200
APPLICATIONS APPROVED, NOT ACCEPTED
0
$0
11
$109,636
34
$125,941
2
$5,000
0
$0
1
$120,000
APPLICATIONS DENIED
0
$0
13
$105,923
79
$126,658
14
$16,643
1
$2,400,000
0
$0
APPLICATIONS WITHDRAWN
0
$0
7
$144,143
42
$154,476
6
$231,667
0
$0
2
$238,000
FILES CLOSED FOR INCOMPLETENESS
0
$0
3
$100,000
9
$154,556
0
$0
0
$0
2
$107,500
Aggregated Statistics For Year 2004 (Based on 1 full tract)
A) FHA, FSA/RHS & VA Home Purchase Loans
B) Conventional Home Purchase Loans
C) Refinancings
D) Home Improvement Loans
F) Non-occupant Loans on < 5 Family Dwellings (A B C & D)
Number
Average Value
Number
Average Value
Number
Average Value
Number
Average Value
Number
Average Value
LOANS ORIGINATED
7
$136,000
114
$120,114
141
$122,440
10
$56,900
7
$97,143
APPLICATIONS APPROVED, NOT ACCEPTED
0
$0
5
$171,400
15
$92,600
1
$88,000
0
$0
APPLICATIONS DENIED
1
$85,000
4
$93,750
74
$118,486
13
$39,692
3
$112,333
APPLICATIONS WITHDRAWN
0
$0
2
$144,500
30
$127,000
2
$92,000
0
$0
FILES CLOSED FOR INCOMPLETENESS
1
$100,000
2
$76,000
13
$137,154
4
$30,500
0
$0
Aggregated Statistics For Year 2003 (Based on 1 full tract)
A) FHA, FSA/RHS & VA Home Purchase Loans
B) Conventional Home Purchase Loans
C) Refinancings
D) Home Improvement Loans
F) Non-occupant Loans on < 5 Family Dwellings (A B C & D)
Number
Average Value
Number
Average Value
Number
Average Value
Number
Average Value
Number
Average Value
LOANS ORIGINATED
6
$122,000
125
$117,056
338
$120,281
8
$37,125
7
$72,000
APPLICATIONS APPROVED, NOT ACCEPTED
1
$85,000
8
$93,500
49
$112,265
3
$57,333
0
$0
APPLICATIONS DENIED
0
$0
7
$100,714
56
$117,054
3
$32,000
0
$0
APPLICATIONS WITHDRAWN
0
$0
12
$132,417
40
$135,400
2
$38,000
3
$121,000
FILES CLOSED FOR INCOMPLETENESS
0
$0
4
$128,000
11
$126,364
0
$0
0
$0
Aggregated Statistics For Year 2002 (Based on 1 full tract)
A) FHA, FSA/RHS & VA Home Purchase Loans
B) Conventional Home Purchase Loans
C) Refinancings
D) Home Improvement Loans
E) Loans on Dwellings For 5+ Families
F) Non-occupant Loans on < 5 Family Dwellings (A B C & D)
Number
Average Value
Number
Average Value
Number
Average Value
Number
Average Value
Number
Average Value
Number
Average Value
LOANS ORIGINATED
21
$130,000
85
$119,482
221
$117,955
4
$22,750
1
$480,000
3
$114,000
APPLICATIONS APPROVED, NOT ACCEPTED
1
$122,000
9
$140,444
40
$121,150
6
$20,333
0
$0
0
$0
APPLICATIONS DENIED
1
$108,000
7
$92,429
60
$92,917
3
$15,333
0
$0
1
$6,000
APPLICATIONS WITHDRAWN
1
$94,000
8
$127,000
38
$118,842
1
$103,000
0
$0
0
$0
FILES CLOSED FOR INCOMPLETENESS
0
$0
2
$135,500
13
$109,462
0
$0
0
$0
0
$0
Aggregated Statistics For Year 2001 (Based on 1 full tract)
A) FHA, FSA/RHS & VA Home Purchase Loans
B) Conventional Home Purchase Loans
C) Refinancings
D) Home Improvement Loans
F) Non-occupant Loans on < 5 Family Dwellings (A B C & D)
Number
Average Value
Number
Average Value
Number
Average Value
Number
Average Value
Number
Average Value
LOANS ORIGINATED
15
$127,333
90
$113,933
220
$112,927
14
$41,071
6
$80,000
APPLICATIONS APPROVED, NOT ACCEPTED
0
$0
4
$125,750
28
$74,500
5
$15,800
3
$71,667
APPLICATIONS DENIED
1
$119,000
16
$89,250
52
$107,077
7
$4,429
0
$0
APPLICATIONS WITHDRAWN
2
$115,000
0
$0
33
$120,818
1
$36,000
0
$0
FILES CLOSED FOR INCOMPLETENESS
0
$0
3
$81,667
13
$137,462
3
$10,667
0
$0
Aggregated Statistics For Year 2000 (Based on 1 full tract)
A) FHA, FSA/RHS & VA Home Purchase Loans
B) Conventional Home Purchase Loans
C) Refinancings
D) Home Improvement Loans
F) Non-occupant Loans on < 5 Family Dwellings (A B C & D)
Number
Average Value
Number
Average Value
Number
Average Value
Number
Average Value
Number
Average Value
LOANS ORIGINATED
15
$109,000
83
$119,157
54
$88,963
13
$33,923
5
$84,800
APPLICATIONS APPROVED, NOT ACCEPTED
1
$105,000
8
$66,750
14
$95,286
6
$12,833
1
$41,000
APPLICATIONS DENIED
1
$98,000
12
$50,583
30
$127,633
5
$34,800
0
$0
APPLICATIONS WITHDRAWN
3
$125,667
2
$127,500
12
$77,167
3
$15,000
2
$52,500
FILES CLOSED FOR INCOMPLETENESS
0
$0
5
$89,600
6
$94,667
0
$0
0
$0
Aggregated Statistics For Year 1999 (Based on 1 full tract)
A) FHA, FSA/RHS & VA Home Purchase Loans
B) Conventional Home Purchase Loans
C) Refinancings
D) Home Improvement Loans
E) Loans on Dwellings For 5+ Families
F) Non-occupant Loans on < 5 Family Dwellings (A B C & D)
Detailed PMIC statistics for the following Tracts:5308.01
2002 - 2018 National Fire Incident Reporting System (NFIRS) incidents
According to the data from the years 2002 - 2018 the average number of fire incidents per year is 9. The highest number of reported fires - 20 took place in 2015, and the least - 4 in 2016. The data has a constant trend.
When looking into fire subcategories, the most incidents belonged to: Structure Fires (59.2%), and Outside Fires (28.7%).
Fire incident types reported to NFIRS in Munroe Falls, OH


 Recent articles from our blog. Our writers, many of them Ph.D. graduates or candidates, create easy-to-read articles on a wide variety of topics.

 (6.2 miles


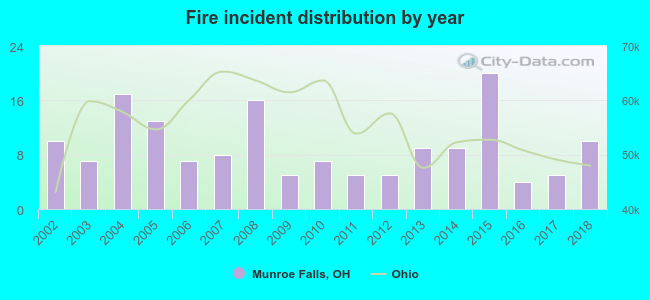 According to the data from the years 2002 - 2018 the average number of fire incidents per year is 9. The highest number of reported fires - 20 took place in 2015, and the least - 4 in 2016. The data has a constant trend.
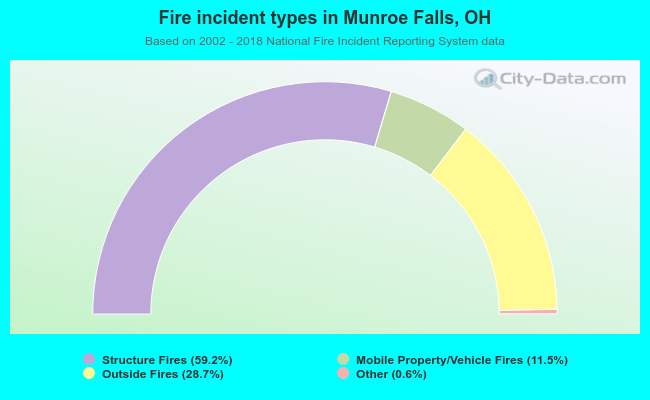 When looking into fire subcategories, the most incidents belonged to: Structure Fires (59.2%), and Outside Fires (28.7%).