Ellsworth, Wisconsin Submit your own pictures of this village and show them to the world
OSM Map
General Map
Google Map
MSN Map
OSM Map
General Map
Google Map
MSN Map
OSM Map
General Map
Google Map
MSN Map
OSM Map
General Map
Google Map
MSN Map
Please wait while loading the map...
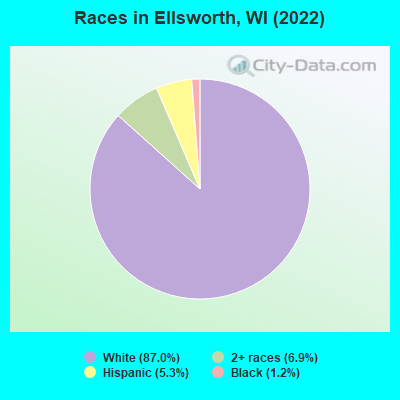
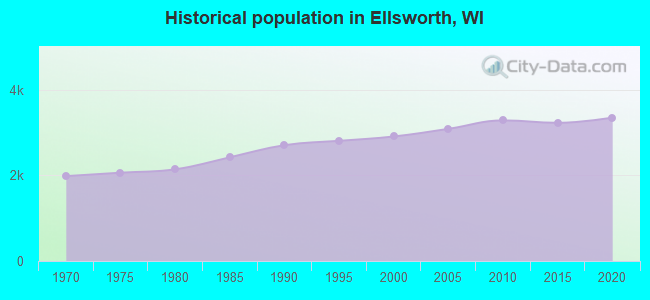
Population in 2022: 3,306 (87% urban, 13% rural). Population change since 2000: +13.6%Males: 1,562 Females: 1,744
March 2022 cost of living index in Ellsworth: 112.3 (more than average, U.S. average is 100) Percentage of residents living in poverty in 2022: 9.0%for White Non-Hispanic residents , 18.7% for Hispanic or Latino residents , 11.9% for two or more races residents )
Profiles of local businesses
Business Search - 14 Million verified businesses
Data:
Median household income ($)
Median household income (% change since 2000)
Household income diversity
Ratio of average income to average house value (%)
Ratio of average income to average rent
Median household income ($) - White
Median household income ($) - Black or African American
Median household income ($) - Asian
Median household income ($) - Hispanic or Latino
Median household income ($) - American Indian and Alaska Native
Median household income ($) - Multirace
Median household income ($) - Other Race
Median household income for houses/condos with a mortgage ($)
Median household income for apartments without a mortgage ($)
Races - White alone (%)
Races - White alone (% change since 2000)
Races - Black alone (%)
Races - Black alone (% change since 2000)
Races - American Indian alone (%)
Races - American Indian alone (% change since 2000)
Races - Asian alone (%)
Races - Asian alone (% change since 2000)
Races - Hispanic (%)
Races - Hispanic (% change since 2000)
Races - Native Hawaiian and Other Pacific Islander alone (%)
Races - Native Hawaiian and Other Pacific Islander alone (% change since 2000)
Races - Two or more races (%)
Races - Two or more races (% change since 2000)
Races - Other race alone (%)
Races - Other race alone (% change since 2000)
Racial diversity
Unemployment (%)
Unemployment (% change since 2000)
Unemployment (%) - White
Unemployment (%) - Black or African American
Unemployment (%) - Asian
Unemployment (%) - Hispanic or Latino
Unemployment (%) - American Indian and Alaska Native
Unemployment (%) - Multirace
Unemployment (%) - Other Race
Population density (people per square mile)
Population - Males (%)
Population - Females (%)
Population - Males (%) - White
Population - Males (%) - Black or African American
Population - Males (%) - Asian
Population - Males (%) - Hispanic or Latino
Population - Males (%) - American Indian and Alaska Native
Population - Males (%) - Multirace
Population - Males (%) - Other Race
Population - Females (%) - White
Population - Females (%) - Black or African American
Population - Females (%) - Asian
Population - Females (%) - Hispanic or Latino
Population - Females (%) - American Indian and Alaska Native
Population - Females (%) - Multirace
Population - Females (%) - Other Race
Coronavirus confirmed cases (Jun 08, 2024)
Deaths caused by coronavirus (Jun 08, 2024)
Coronavirus confirmed cases (per 100k population) (Jun 08, 2024)
Deaths caused by coronavirus (per 100k population) (Jun 08, 2024)
Daily increase in number of cases (Jun 08, 2024)
Weekly increase in number of cases (Jun 08, 2024)
Cases doubled (in days) (Jun 08, 2024)
Hospitalized patients (Apr 18, 2022)
Negative test results (Apr 18, 2022)
Total test results (Apr 18, 2022)
COVID Vaccine doses distributed (per 100k population) (Sep 19, 2023)
COVID Vaccine doses administered (per 100k population) (Sep 19, 2023)
COVID Vaccine doses distributed (Sep 19, 2023)
COVID Vaccine doses administered (Sep 19, 2023)
Likely homosexual households (%)
Likely homosexual households (% change since 2000)
Likely homosexual households - Lesbian couples (%)
Likely homosexual households - Lesbian couples (% change since 2000)
Likely homosexual households - Gay men (%)
Likely homosexual households - Gay men (% change since 2000)
Cost of living index
Median gross rent ($)
Median contract rent ($)
Median monthly housing costs ($)
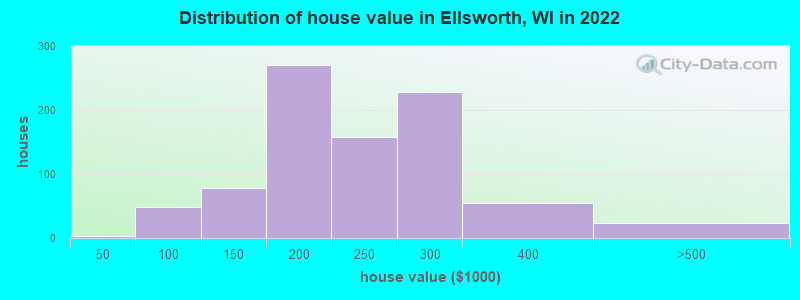
Median house or condo value ($)
Median house or condo value ($ change since 2000)
Mean house or condo value by units in structure - 1, detached ($)
Mean house or condo value by units in structure - 1, attached ($)
Mean house or condo value by units in structure - 2 ($)
Mean house or condo value by units in structure by units in structure - 3 or 4 ($)
Mean house or condo value by units in structure - 5 or more ($)
Mean house or condo value by units in structure - Boat, RV, van, etc. ($)
Mean house or condo value by units in structure - Mobile home ($)
Median house or condo value ($) - White
Median house or condo value ($) - Black or African American
Median house or condo value ($) - Asian
Median house or condo value ($) - Hispanic or Latino
Median house or condo value ($) - American Indian and Alaska Native
Median house or condo value ($) - Multirace
Median house or condo value ($) - Other Race
Median resident age
Resident age diversity
Median resident age - Males
Median resident age - Females
Median resident age - White
Median resident age - Black or African American
Median resident age - Asian
Median resident age - Hispanic or Latino
Median resident age - American Indian and Alaska Native
Median resident age - Multirace
Median resident age - Other Race
Median resident age - Males - White
Median resident age - Males - Black or African American
Median resident age - Males - Asian
Median resident age - Males - Hispanic or Latino
Median resident age - Males - American Indian and Alaska Native
Median resident age - Males - Multirace
Median resident age - Males - Other Race
Median resident age - Females - White
Median resident age - Females - Black or African American
Median resident age - Females - Asian
Median resident age - Females - Hispanic or Latino
Median resident age - Females - American Indian and Alaska Native
Median resident age - Females - Multirace
Median resident age - Females - Other Race
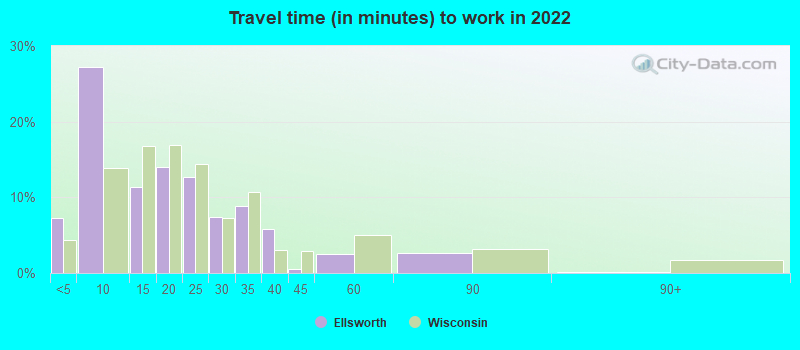
Commute - mean travel time to work (minutes)
Travel time to work - Less than 5 minutes (%)
Travel time to work - Less than 5 minutes (% change since 2000)
Travel time to work - 5 to 9 minutes (%)
Travel time to work - 5 to 9 minutes (% change since 2000)
Travel time to work - 10 to 19 minutes (%)
Travel time to work - 10 to 19 minutes (% change since 2000)
Travel time to work - 20 to 29 minutes (%)
Travel time to work - 20 to 29 minutes (% change since 2000)
Travel time to work - 30 to 39 minutes (%)
Travel time to work - 30 to 39 minutes (% change since 2000)
Travel time to work - 40 to 59 minutes (%)
Travel time to work - 40 to 59 minutes (% change since 2000)
Travel time to work - 60 to 89 minutes (%)
Travel time to work - 60 to 89 minutes (% change since 2000)
Travel time to work - 90 or more minutes (%)
Travel time to work - 90 or more minutes (% change since 2000)
Marital status - Never married (%)
Marital status - Now married (%)
Marital status - Separated (%)
Marital status - Widowed (%)
Marital status - Divorced (%)
Median family income ($)
Median family income (% change since 2000)
Median non-family income ($)
Median non-family income (% change since 2000)
Median per capita income ($)
Median per capita income (% change since 2000)
Median family income ($) - White
Median family income ($) - Black or African American
Median family income ($) - Asian
Median family income ($) - Hispanic or Latino
Median family income ($) - American Indian and Alaska Native
Median family income ($) - Multirace
Median family income ($) - Other Race
Median year house/condo built
Median year apartment built
Year house built - Built 2005 or later (%)
Year house built - Built 2000 to 2004 (%)
Year house built - Built 1990 to 1999 (%)
Year house built - Built 1980 to 1989 (%)
Year house built - Built 1970 to 1979 (%)
Year house built - Built 1960 to 1969 (%)
Year house built - Built 1950 to 1959 (%)
Year house built - Built 1940 to 1949 (%)
Year house built - Built 1939 or earlier (%)
Average household size
Household density (households per square mile)
Average household size - White
Average household size - Black or African American
Average household size - Asian
Average household size - Hispanic or Latino
Average household size - American Indian and Alaska Native
Average household size - Multirace
Average household size - Other Race
Occupied housing units (%)
Vacant housing units (%)
Owner occupied housing units (%)
Renter occupied housing units (%)
Vacancy status - For rent (%)
Vacancy status - For sale only (%)
Vacancy status - Rented or sold, not occupied (%)
Vacancy status - For seasonal, recreational, or occasional use (%)
Vacancy status - For migrant workers (%)
Vacancy status - Other vacant (%)
Residents with income below the poverty level (%)
Residents with income below 50% of the poverty level (%)
Children below poverty level (%)
Poor families by family type - Married-couple family (%)
Poor families by family type - Male, no wife present (%)
Poor families by family type - Female, no husband present (%)
Poverty status for native-born residents (%)
Poverty status for foreign-born residents (%)
Poverty among high school graduates not in families (%)
Poverty among people who did not graduate high school not in families (%)
Residents with income below the poverty level (%) - White
Residents with income below the poverty level (%) - Black or African American
Residents with income below the poverty level (%) - Asian
Residents with income below the poverty level (%) - Hispanic or Latino
Residents with income below the poverty level (%) - American Indian and Alaska Native
Residents with income below the poverty level (%) - Multirace
Residents with income below the poverty level (%) - Other Race
Air pollution - Air Quality Index (AQI)
Air pollution - CO
Air pollution - NO2
Air pollution - SO2
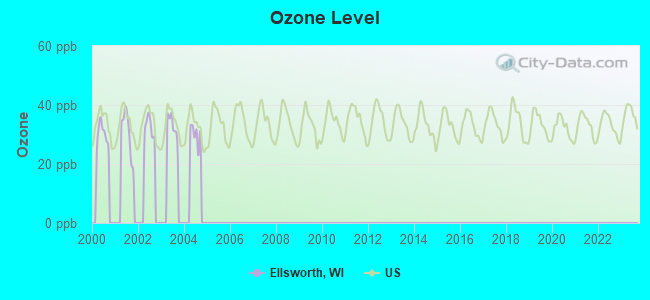
Air pollution - Ozone
Air pollution - PM10
Air pollution - PM25
Air pollution - Pb
Crime - Murders per 100,000 population
Crime - Rapes per 100,000 population
Crime - Robberies per 100,000 population
Crime - Assaults per 100,000 population
Crime - Burglaries per 100,000 population
Crime - Thefts per 100,000 population
Crime - Auto thefts per 100,000 population
Crime - Arson per 100,000 population
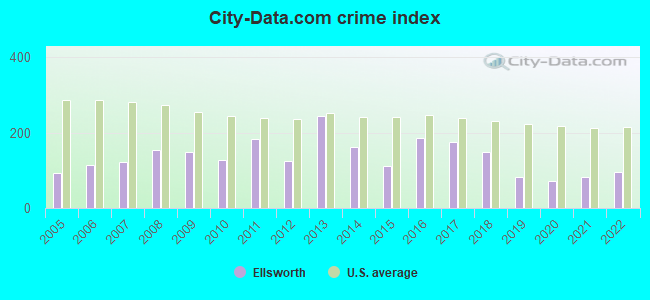
Crime - City-data.com crime index
Crime - Violent crime index
Crime - Property crime index
Crime - Murders per 100,000 population (5 year average)
Crime - Rapes per 100,000 population (5 year average)
Crime - Robberies per 100,000 population (5 year average)
Crime - Assaults per 100,000 population (5 year average)
Crime - Burglaries per 100,000 population (5 year average)
Crime - Thefts per 100,000 population (5 year average)
Crime - Auto thefts per 100,000 population (5 year average)
Crime - Arson per 100,000 population (5 year average)
Crime - City-data.com crime index (5 year average)
Crime - Violent crime index (5 year average)
Crime - Property crime index (5 year average)
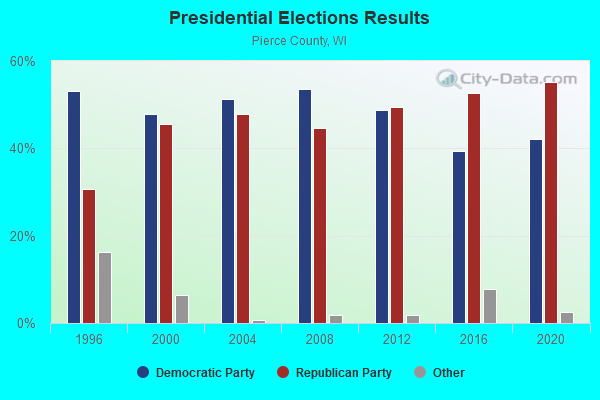
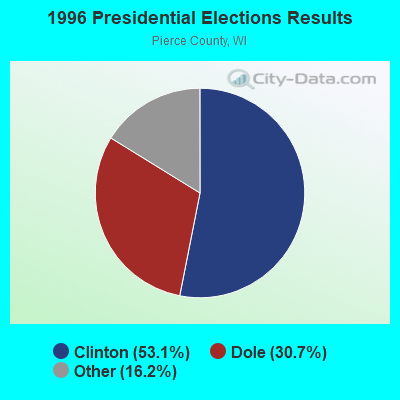
1996 Presidential Elections Results (%) - Democratic Party (Clinton)
1996 Presidential Elections Results (%) - Republican Party (Dole)
1996 Presidential Elections Results (%) - Other
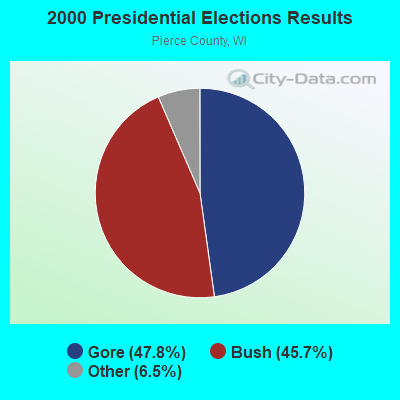
2000 Presidential Elections Results (%) - Democratic Party (Gore)
2000 Presidential Elections Results (%) - Republican Party (Bush)
2000 Presidential Elections Results (%) - Other
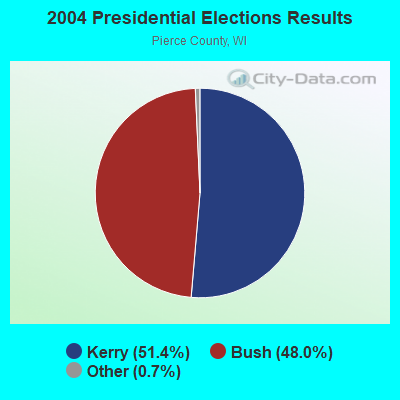
2004 Presidential Elections Results (%) - Democratic Party (Kerry)
2004 Presidential Elections Results (%) - Republican Party (Bush)
2004 Presidential Elections Results (%) - Other
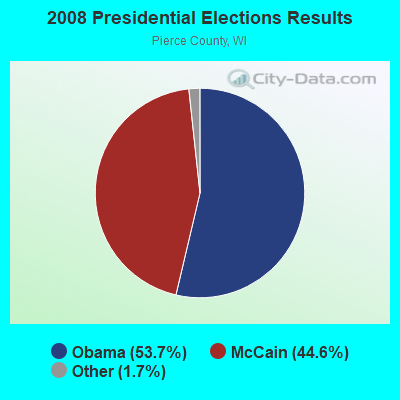
2008 Presidential Elections Results (%) - Democratic Party (Obama)
2008 Presidential Elections Results (%) - Republican Party (McCain)
2008 Presidential Elections Results (%) - Other
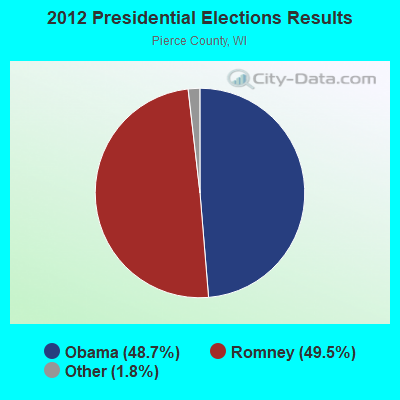
2012 Presidential Elections Results (%) - Democratic Party (Obama)
2012 Presidential Elections Results (%) - Republican Party (Romney)
2012 Presidential Elections Results (%) - Other
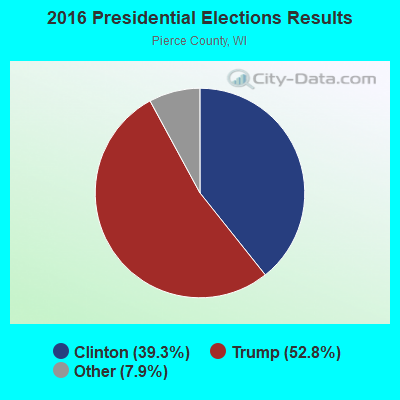
2016 Presidential Elections Results (%) - Democratic Party (Clinton)
2016 Presidential Elections Results (%) - Republican Party (Trump)
2016 Presidential Elections Results (%) - Other
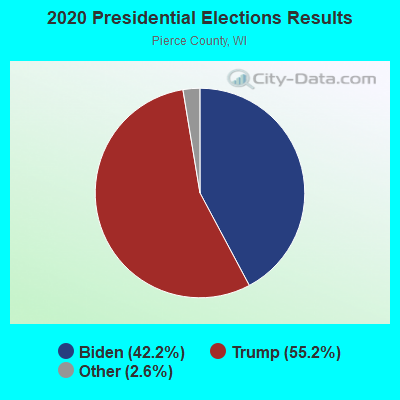
2020 Presidential Elections Results (%) - Democratic Party (Biden)
2020 Presidential Elections Results (%) - Republican Party (Trump)
2020 Presidential Elections Results (%) - Other
Ancestries Reported - Arab (%)
Ancestries Reported - Czech (%)
Ancestries Reported - Danish (%)
Ancestries Reported - Dutch (%)
Ancestries Reported - English (%)
Ancestries Reported - French (%)
Ancestries Reported - French Canadian (%)
Ancestries Reported - German (%)
Ancestries Reported - Greek (%)
Ancestries Reported - Hungarian (%)
Ancestries Reported - Irish (%)
Ancestries Reported - Italian (%)
Ancestries Reported - Lithuanian (%)
Ancestries Reported - Norwegian (%)
Ancestries Reported - Polish (%)
Ancestries Reported - Portuguese (%)
Ancestries Reported - Russian (%)
Ancestries Reported - Scotch-Irish (%)
Ancestries Reported - Scottish (%)
Ancestries Reported - Slovak (%)
Ancestries Reported - Subsaharan African (%)
Ancestries Reported - Swedish (%)
Ancestries Reported - Swiss (%)
Ancestries Reported - Ukrainian (%)
Ancestries Reported - United States (%)
Ancestries Reported - Welsh (%)
Ancestries Reported - West Indian (%)
Ancestries Reported - Other (%)
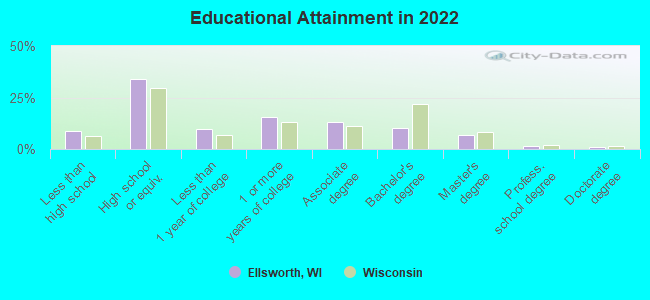
Educational Attainment - No schooling completed (%)
Educational Attainment - Less than high school (%)
Educational Attainment - High school or equivalent (%)
Educational Attainment - Less than 1 year of college (%)
Educational Attainment - 1 or more years of college (%)
Educational Attainment - Associate degree (%)
Educational Attainment - Bachelor's degree (%)
Educational Attainment - Master's degree (%)
Educational Attainment - Professional school degree (%)
Educational Attainment - Doctorate degree (%)
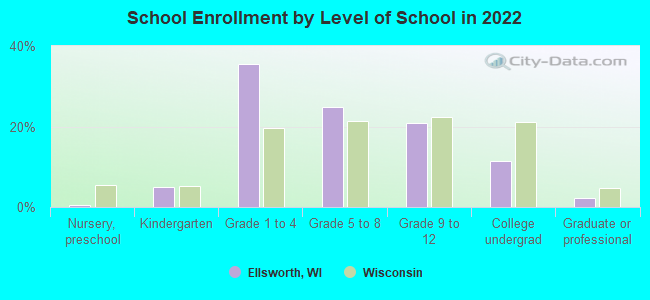
School Enrollment - Nursery, preschool (%)
School Enrollment - Kindergarten (%)
School Enrollment - Grade 1 to 4 (%)
School Enrollment - Grade 5 to 8 (%)
School Enrollment - Grade 9 to 12 (%)
School Enrollment - College undergrad (%)
School Enrollment - Graduate or professional (%)
School Enrollment - Not enrolled in school (%)
School enrollment - Public schools (%)
School enrollment - Private schools (%)
School enrollment - Not enrolled (%)
Median number of rooms in houses and condos
Median number of rooms in apartments
Housing units lacking complete plumbing facilities (%)
Housing units lacking complete kitchen facilities (%)
Density of houses
Urban houses (%)
Rural houses (%)
Households with people 60 years and over (%)
Households with people 65 years and over (%)
Households with people 75 years and over (%)
Households with one or more nonrelatives (%)
Households with no nonrelatives (%)
Population in households (%)
Family households (%)
Nonfamily households (%)
Population in families (%)
Family households with own children (%)
Median number of bedrooms in owner occupied houses
Mean number of bedrooms in owner occupied houses
Median number of bedrooms in renter occupied houses
Mean number of bedrooms in renter occupied houses
Median number of vehichles in owner occupied houses
Mean number of vehichles in owner occupied houses
Median number of vehichles in renter occupied houses
Mean number of vehichles in renter occupied houses
Mortgage status - with mortgage (%)
Mortgage status - with second mortgage (%)
Mortgage status - with home equity loan (%)
Mortgage status - with both second mortgage and home equity loan (%)
Mortgage status - without a mortgage (%)
Average family size
Average family size - White
Average family size - Black or African American
Average family size - Asian
Average family size - Hispanic or Latino
Average family size - American Indian and Alaska Native
Average family size - Multirace
Average family size - Other Race
Geographical mobility - Same house 1 year ago (%)
Geographical mobility - Moved within same county (%)
Geographical mobility - Moved from different county within same state (%)
Geographical mobility - Moved from different state (%)
Geographical mobility - Moved from abroad (%)
Place of birth - Born in state of residence (%)
Place of birth - Born in other state (%)
Place of birth - Native, outside of US (%)
Place of birth - Foreign born (%)
Housing units in structures - 1, detached (%)
Housing units in structures - 1, attached (%)
Housing units in structures - 2 (%)
Housing units in structures - 3 or 4 (%)
Housing units in structures - 5 to 9 (%)
Housing units in structures - 10 to 19 (%)
Housing units in structures - 20 to 49 (%)
Housing units in structures - 50 or more (%)
Housing units in structures - Mobile home (%)
Housing units in structures - Boat, RV, van, etc. (%)
House/condo owner moved in on average (years ago)
Renter moved in on average (years ago)
Year householder moved into unit - Moved in 1999 to March 2000 (%)
Year householder moved into unit - Moved in 1995 to 1998 (%)
Year householder moved into unit - Moved in 1990 to 1994 (%)
Year householder moved into unit - Moved in 1980 to 1989 (%)
Year householder moved into unit - Moved in 1970 to 1979 (%)
Year householder moved into unit - Moved in 1969 or earlier (%)
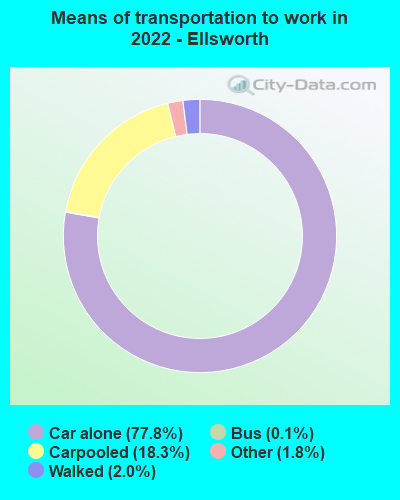
Means of transportation to work - Drove car alone (%)
Means of transportation to work - Carpooled (%)
Means of transportation to work - Public transportation (%)
Means of transportation to work - Bus or trolley bus (%)
Means of transportation to work - Streetcar or trolley car (%)
Means of transportation to work - Subway or elevated (%)
Means of transportation to work - Railroad (%)
Means of transportation to work - Ferryboat (%)
Means of transportation to work - Taxicab (%)
Means of transportation to work - Motorcycle (%)
Means of transportation to work - Bicycle (%)
Means of transportation to work - Walked (%)
Means of transportation to work - Other means (%)
Working at home (%)
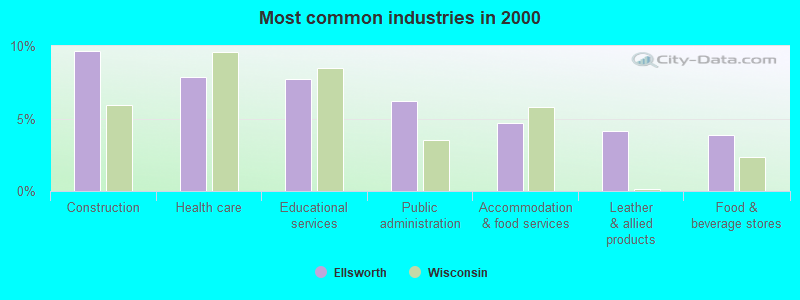
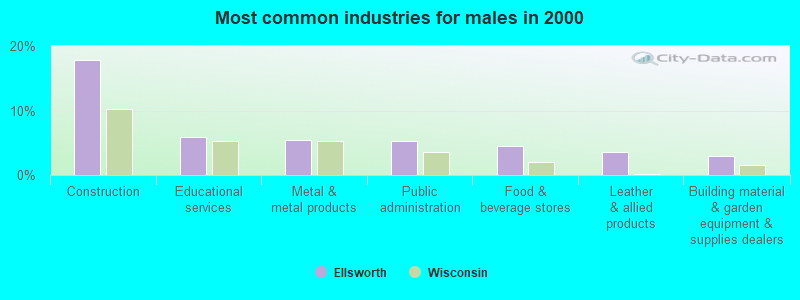
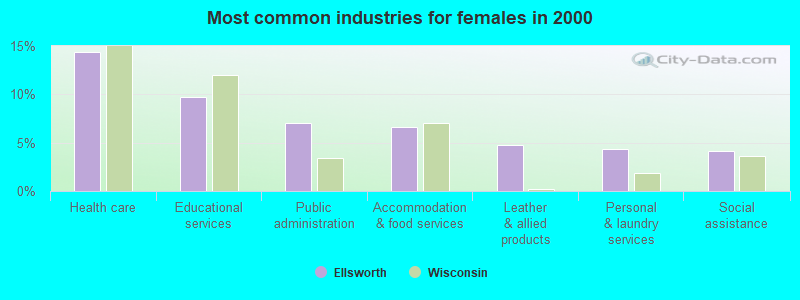
Industry diversity
Most Common Industries - Agriculture, forestry, fishing and hunting, and mining (%)
Most Common Industries - Agriculture, forestry, fishing and hunting (%)
Most Common Industries - Mining, quarrying, and oil and gas extraction (%)
Most Common Industries - Construction (%)
Most Common Industries - Manufacturing (%)
Most Common Industries - Wholesale trade (%)
Most Common Industries - Retail trade (%)
Most Common Industries - Transportation and warehousing, and utilities (%)
Most Common Industries - Transportation and warehousing (%)
Most Common Industries - Utilities (%)
Most Common Industries - Information (%)
Most Common Industries - Finance and insurance, and real estate and rental and leasing (%)
Most Common Industries - Finance and insurance (%)
Most Common Industries - Real estate and rental and leasing (%)
Most Common Industries - Professional, scientific, and management, and administrative and waste management services (%)
Most Common Industries - Professional, scientific, and technical services (%)
Most Common Industries - Management of companies and enterprises (%)
Most Common Industries - Administrative and support and waste management services (%)
Most Common Industries - Educational services, and health care and social assistance (%)
Most Common Industries - Educational services (%)
Most Common Industries - Health care and social assistance (%)
Most Common Industries - Arts, entertainment, and recreation, and accommodation and food services (%)
Most Common Industries - Arts, entertainment, and recreation (%)
Most Common Industries - Accommodation and food services (%)
Most Common Industries - Other services, except public administration (%)
Most Common Industries - Public administration (%)
Occupation diversity
Most Common Occupations - Management, business, science, and arts occupations (%)
Most Common Occupations - Management, business, and financial occupations (%)
Most Common Occupations - Management occupations (%)
Most Common Occupations - Business and financial operations occupations (%)
Most Common Occupations - Computer, engineering, and science occupations (%)
Most Common Occupations - Computer and mathematical occupations (%)
Most Common Occupations - Architecture and engineering occupations (%)
Most Common Occupations - Life, physical, and social science occupations (%)
Most Common Occupations - Education, legal, community service, arts, and media occupations (%)
Most Common Occupations - Community and social service occupations (%)
Most Common Occupations - Legal occupations (%)
Most Common Occupations - Education, training, and library occupations (%)
Most Common Occupations - Arts, design, entertainment, sports, and media occupations (%)
Most Common Occupations - Healthcare practitioners and technical occupations (%)
Most Common Occupations - Health diagnosing and treating practitioners and other technical occupations (%)
Most Common Occupations - Health technologists and technicians (%)
Most Common Occupations - Service occupations (%)
Most Common Occupations - Healthcare support occupations (%)
Most Common Occupations - Protective service occupations (%)
Most Common Occupations - Fire fighting and prevention, and other protective service workers including supervisors (%)
Most Common Occupations - Law enforcement workers including supervisors (%)
Most Common Occupations - Food preparation and serving related occupations (%)
Most Common Occupations - Building and grounds cleaning and maintenance occupations (%)
Most Common Occupations - Personal care and service occupations (%)
Most Common Occupations - Sales and office occupations (%)
Most Common Occupations - Sales and related occupations (%)
Most Common Occupations - Office and administrative support occupations (%)
Most Common Occupations - Natural resources, construction, and maintenance occupations (%)
Most Common Occupations - Farming, fishing, and forestry occupations (%)
Most Common Occupations - Construction and extraction occupations (%)
Most Common Occupations - Installation, maintenance, and repair occupations (%)
Most Common Occupations - Production, transportation, and material moving occupations (%)
Most Common Occupations - Production occupations (%)
Most Common Occupations - Transportation occupations (%)
Most Common Occupations - Material moving occupations (%)
People in Group quarters - Institutionalized population (%)
People in Group quarters - Correctional institutions (%)
People in Group quarters - Federal prisons and detention centers (%)
People in Group quarters - Halfway houses (%)
People in Group quarters - Local jails and other confinement facilities (including police lockups) (%)
People in Group quarters - Military disciplinary barracks (%)
People in Group quarters - State prisons (%)
People in Group quarters - Other types of correctional institutions (%)
People in Group quarters - Nursing homes (%)
People in Group quarters - Hospitals/wards, hospices, and schools for the handicapped (%)
People in Group quarters - Hospitals/wards and hospices for chronically ill (%)
People in Group quarters - Hospices or homes for chronically ill (%)
People in Group quarters - Military hospitals or wards for chronically ill (%)
People in Group quarters - Other hospitals or wards for chronically ill (%)
People in Group quarters - Hospitals or wards for drug/alcohol abuse (%)
People in Group quarters - Mental (Psychiatric) hospitals or wards (%)
People in Group quarters - Schools, hospitals, or wards for the mentally retarded (%)
People in Group quarters - Schools, hospitals, or wards for the physically handicapped (%)
People in Group quarters - Institutions for the deaf (%)
People in Group quarters - Institutions for the blind (%)
People in Group quarters - Orthopedic wards and institutions for the physically handicapped (%)
People in Group quarters - Wards in general hospitals for patients who have no usual home elsewhere (%)
People in Group quarters - Wards in military hospitals for patients who have no usual home elsewhere (%)
People in Group quarters - Juvenile institutions (%)
People in Group quarters - Long-term care (%)
People in Group quarters - Homes for abused, dependent, and neglected children (%)
People in Group quarters - Residential treatment centers for emotionally disturbed children (%)
People in Group quarters - Training schools for juvenile delinquents (%)
People in Group quarters - Short-term care, detention or diagnostic centers for delinquent children (%)
People in Group quarters - Type of juvenile institution unknown (%)
People in Group quarters - Noninstitutionalized population (%)
People in Group quarters - College dormitories (includes college quarters off campus) (%)
People in Group quarters - Military quarters (%)
People in Group quarters - On base (%)
People in Group quarters - Barracks, unaccompanied personnel housing (UPH), (Enlisted/Officer), ;and similar group living quarters for military personnel (%)
People in Group quarters - Transient quarters for temporary residents (%)
People in Group quarters - Military ships (%)
People in Group quarters - Group homes (%)
People in Group quarters - Homes or halfway houses for drug/alcohol abuse (%)
People in Group quarters - Homes for the mentally ill (%)
People in Group quarters - Homes for the mentally retarded (%)
People in Group quarters - Homes for the physically handicapped (%)
People in Group quarters - Other group homes (%)
People in Group quarters - Religious group quarters (%)
People in Group quarters - Dormitories (%)
People in Group quarters - Agriculture workers' dormitories on farms (%)
People in Group quarters - Job Corps and vocational training facilities (%)
People in Group quarters - Other workers' dormitories (%)
People in Group quarters - Crews of maritime vessels (%)
People in Group quarters - Other nonhousehold living situations (%)
People in Group quarters - Other noninstitutional group quarters (%)
Residents speaking English at home (%)
Residents speaking English at home - Born in the United States (%)
Residents speaking English at home - Native, born elsewhere (%)
Residents speaking English at home - Foreign born (%)
Residents speaking Spanish at home (%)
Residents speaking Spanish at home - Born in the United States (%)
Residents speaking Spanish at home - Native, born elsewhere (%)
Residents speaking Spanish at home - Foreign born (%)
Residents speaking other language at home (%)
Residents speaking other language at home - Born in the United States (%)
Residents speaking other language at home - Native, born elsewhere (%)
Residents speaking other language at home - Foreign born (%)
Class of Workers - Employee of private company (%)
Class of Workers - Self-employed in own incorporated business (%)
Class of Workers - Private not-for-profit wage and salary workers (%)
Class of Workers - Local government workers (%)
Class of Workers - State government workers (%)
Class of Workers - Federal government workers (%)
Class of Workers - Self-employed workers in own not incorporated business and Unpaid family workers (%)
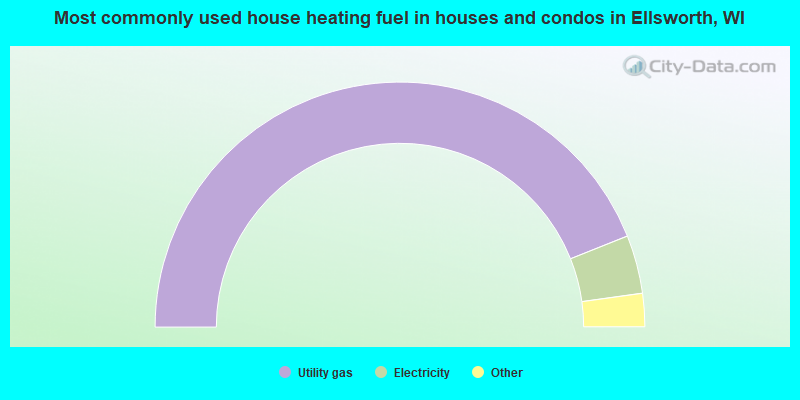
House heating fuel used in houses and condos - Utility gas (%)
House heating fuel used in houses and condos - Bottled, tank, or LP gas (%)
House heating fuel used in houses and condos - Electricity (%)
House heating fuel used in houses and condos - Fuel oil, kerosene, etc. (%)
House heating fuel used in houses and condos - Coal or coke (%)
House heating fuel used in houses and condos - Wood (%)
House heating fuel used in houses and condos - Solar energy (%)
House heating fuel used in houses and condos - Other fuel (%)
House heating fuel used in houses and condos - No fuel used (%)
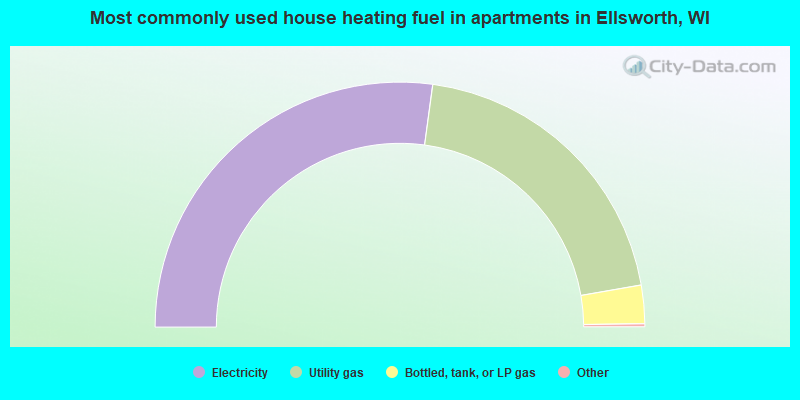
House heating fuel used in apartments - Utility gas (%)
House heating fuel used in apartments - Bottled, tank, or LP gas (%)
House heating fuel used in apartments - Electricity (%)
House heating fuel used in apartments - Fuel oil, kerosene, etc. (%)
House heating fuel used in apartments - Coal or coke (%)
House heating fuel used in apartments - Wood (%)
House heating fuel used in apartments - Solar energy (%)
House heating fuel used in apartments - Other fuel (%)
House heating fuel used in apartments - No fuel used (%)
Armed forces status - In Armed Forces (%)
Armed forces status - Civilian (%)
Armed forces status - Civilian - Veteran (%)
Armed forces status - Civilian - Nonveteran (%)
Fatal accidents locations in years 2005-2021
Fatal accidents locations in 2005
Fatal accidents locations in 2006
Fatal accidents locations in 2007
Fatal accidents locations in 2008
Fatal accidents locations in 2009
Fatal accidents locations in 2010
Fatal accidents locations in 2011
Fatal accidents locations in 2012
Fatal accidents locations in 2013
Fatal accidents locations in 2014
Fatal accidents locations in 2015
Fatal accidents locations in 2016
Fatal accidents locations in 2017
Fatal accidents locations in 2018
Fatal accidents locations in 2019
Fatal accidents locations in 2020
Fatal accidents locations in 2021
Alcohol use - People drinking some alcohol every month (%)
Alcohol use - People not drinking at all (%)
Alcohol use - Average days/month drinking alcohol
Alcohol use - Average drinks/week
Alcohol use - Average days/year people drink much
Audiometry - Average condition of hearing (%)
Audiometry - People that can hear a whisper from across a quiet room (%)
Audiometry - People that can hear normal voice from across a quiet room (%)
Audiometry - Ears ringing, roaring, buzzing (%)
Audiometry - Had a job exposure to loud noise (%)
Audiometry - Had off-work exposure to loud noise (%)
Blood Pressure & Cholesterol - Has high blood pressure (%)
Blood Pressure & Cholesterol - Checking blood pressure at home (%)
Blood Pressure & Cholesterol - Frequently checking blood cholesterol (%)
Blood Pressure & Cholesterol - Has high cholesterol level (%)
Consumer Behavior - Money monthly spent on food at supermarket/grocery store
Consumer Behavior - Money monthly spent on food at other stores
Consumer Behavior - Money monthly spent on eating out
Consumer Behavior - Money monthly spent on carryout/delivered foods
Consumer Behavior - Income spent on food at supermarket/grocery store (%)
Consumer Behavior - Income spent on food at other stores (%)
Consumer Behavior - Income spent on eating out (%)
Consumer Behavior - Income spent on carryout/delivered foods (%)
Current Health Status - General health condition (%)
Current Health Status - Blood donors (%)
Current Health Status - Has blood ever tested for HIV virus (%)
Current Health Status - Left-handed people (%)
Dermatology - People using sunscreen (%)
Diabetes - Diabetics (%)
Diabetes - Had a blood test for high blood sugar (%)
Diabetes - People taking insulin (%)
Diet Behavior & Nutrition - Diet health (%)
Diet Behavior & Nutrition - Milk product consumption (# of products/month)
Diet Behavior & Nutrition - Meals not home prepared (#/week)
Diet Behavior & Nutrition - Meals from fast food or pizza place (#/week)
Diet Behavior & Nutrition - Ready-to-eat foods (#/month)
Diet Behavior & Nutrition - Frozen meals/pizza (#/month)
Drug Use - People that ever used marijuana or hashish (%)
Drug Use - Ever used hard drugs (%)
Drug Use - Ever used any form of cocaine (%)
Drug Use - Ever used heroin (%)
Drug Use - Ever used methamphetamine (%)
Health Insurance - People covered by health insurance (%)
Kidney Conditions-Urology - Avg. # of times urinating at night
Medical Conditions - People with asthma (%)
Medical Conditions - People with anemia (%)
Medical Conditions - People with psoriasis (%)
Medical Conditions - People with overweight (%)
Medical Conditions - Elderly people having difficulties in thinking or remembering (%)
Medical Conditions - People who ever received blood transfusion (%)
Medical Conditions - People having trouble seeing even with glass/contacts (%)
Medical Conditions - People with arthritis (%)
Medical Conditions - People with gout (%)
Medical Conditions - People with congestive heart failure (%)
Medical Conditions - People with coronary heart disease (%)
Medical Conditions - People with angina pectoris (%)
Medical Conditions - People who ever had heart attack (%)
Medical Conditions - People who ever had stroke (%)
Medical Conditions - People with emphysema (%)
Medical Conditions - People with thyroid problem (%)
Medical Conditions - People with chronic bronchitis (%)
Medical Conditions - People with any liver condition (%)
Medical Conditions - People who ever had cancer or malignancy (%)
Mental Health - People who have little interest in doing things (%)
Mental Health - People feeling down, depressed, or hopeless (%)
Mental Health - People who have trouble sleeping or sleeping too much (%)
Mental Health - People feeling tired or having little energy (%)
Mental Health - People with poor appetite or overeating (%)
Mental Health - People feeling bad about themself (%)
Mental Health - People who have trouble concentrating on things (%)
Mental Health - People moving or speaking slowly or too fast (%)
Mental Health - People having thoughts they would be better off dead (%)
Oral Health - Average years since last visit a dentist
Oral Health - People embarrassed because of mouth (%)
Oral Health - People with gum disease (%)
Oral Health - General health of teeth and gums (%)
Oral Health - Average days a week using dental floss/device
Oral Health - Average days a week using mouthwash for dental problem
Oral Health - Average number of teeth
Pesticide Use - Households using pesticides to control insects (%)
Pesticide Use - Households using pesticides to kill weeds (%)
Physical Activity - People doing vigorous-intensity work activities (%)
Physical Activity - People doing moderate-intensity work activities (%)
Physical Activity - People walking or bicycling (%)
Physical Activity - People doing vigorous-intensity recreational activities (%)
Physical Activity - People doing moderate-intensity recreational activities (%)
Physical Activity - Average hours a day doing sedentary activities
Physical Activity - Average hours a day watching TV or videos
Physical Activity - Average hours a day using computer
Physical Functioning - People having limitations keeping them from working (%)
Physical Functioning - People limited in amount of work they can do (%)
Physical Functioning - People that need special equipment to walk (%)
Physical Functioning - People experiencing confusion/memory problems (%)
Physical Functioning - People requiring special healthcare equipment (%)
Prescription Medications - Average number of prescription medicines taking
Preventive Aspirin Use - Adults 40+ taking low-dose aspirin (%)
Reproductive Health - Vaginal deliveries (%)
Reproductive Health - Cesarean deliveries (%)
Reproductive Health - Deliveries resulted in a live birth (%)
Reproductive Health - Pregnancies resulted in a delivery (%)
Reproductive Health - Women breastfeeding newborns (%)
Reproductive Health - Women that had a hysterectomy (%)
Reproductive Health - Women that had both ovaries removed (%)
Reproductive Health - Women that have ever taken birth control pills (%)
Reproductive Health - Women taking birth control pills (%)
Reproductive Health - Women that have ever used Depo-Provera or injectables (%)
Reproductive Health - Women that have ever used female hormones (%)
Sexual Behavior - People 18+ that ever had sex (vaginal, anal, or oral) (%)
Sexual Behavior - Males 18+ that ever had vaginal sex with a woman (%)
Sexual Behavior - Males 18+ that ever performed oral sex on a woman (%)
Sexual Behavior - Males 18+ that ever had anal sex with a woman (%)
Sexual Behavior - Males 18+ that ever had any sex with a man (%)
Sexual Behavior - Females 18+ that ever had vaginal sex with a man (%)
Sexual Behavior - Females 18+ that ever performed oral sex on a man (%)
Sexual Behavior - Females 18+ that ever had anal sex with a man (%)
Sexual Behavior - Females 18+ that ever had any kind of sex with a woman (%)
Sexual Behavior - Average age people first had sex
Sexual Behavior - Average number of female sex partners in lifetime (males 18+)
Sexual Behavior - Average number of female vaginal sex partners in lifetime (males 18+)
Sexual Behavior - Average age people first performed oral sex on a woman (18+)
Sexual Behavior - Average number of woman performed oral sex on in lifetime (18+)
Sexual Behavior - Average number of male sex partners in lifetime (males 18+)
Sexual Behavior - Average number of male anal sex partners in lifetime (males 18+)
Sexual Behavior - Average age people first performed oral sex on a man (18+)
Sexual Behavior - Average number of male oral sex partners in lifetime (18+)
Sexual Behavior - People using protection when performing oral sex (%)
Sexual Behavior - Average number of times people have vaginal or anal sex a year
Sexual Behavior - People having sex without condom (%)
Sexual Behavior - Average number of male sex partners in lifetime (females 18+)
Sexual Behavior - Average number of male vaginal sex partners in lifetime (females 18+)
Sexual Behavior - Average number of female sex partners in lifetime (females 18+)
Sexual Behavior - Circumcised males 18+ (%)
Sleep Disorders - Average hours sleeping at night
Sleep Disorders - People that has trouble sleeping (%)
Smoking-Cigarette Use - People smoking cigarettes (%)
Taste & Smell - People 40+ having problems with smell (%)
Taste & Smell - People 40+ having problems with taste (%)
Taste & Smell - People 40+ that ever had wisdom teeth removed (%)
Taste & Smell - People 40+ that ever had tonsils teeth removed (%)
Taste & Smell - People 40+ that ever had a loss of consciousness because of a head injury (%)
Taste & Smell - People 40+ that ever had a broken nose or other serious injury to face or skull (%)
Taste & Smell - People 40+ that ever had two or more sinus infections (%)
Weight - Average height (inches)
Weight - Average weight (pounds)
Weight - Average BMI
Weight - People that are obese (%)
Weight - People that ever were obese (%)
Weight - People trying to lose weight (%)
According to our research of Wisconsin and other state lists, there were 9 registered sex offenders living in Ellsworth, Wisconsin as of June 08, 2024 . The ratio of all residents to sex offenders in Ellsworth is 359 to 1.The ratio of registered sex offenders to all residents in this city is near the state average.
Officers per 1,000 residents here:
1.83Wisconsin average:
2.07
Latest news from Ellsworth, WI collected exclusively by city-data.com from local newspapers, TV, and radio stations
Ancestries: German (29.0%), Norwegian (16.9%), Czech (5.0%), Irish (4.9%), Swedish (4.5%), American (4.1%).
Current Local Time:
Land area: 3.73 square miles.
Population density: 886 people per square mile (low).
121 residents are foreign born (3.5% Latin America ).
This village:
3.6%Wisconsin:
5.0%
Median real estate property taxes paid for housing units with mortgages in 2022: $3,386 (1.6%)Median real estate property taxes paid for housing units with no mortgage in 2022: $3,811 (1.7%)
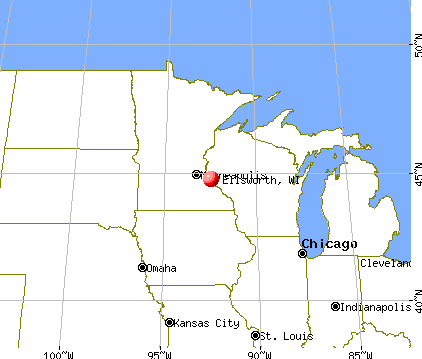
Nearest city with pop. 50,000+: Eagan, MN
Nearest city with pop. 200,000+: St. Paul, MN
Nearest city with pop. 1,000,000+: Chicago, IL
Nearest cities:
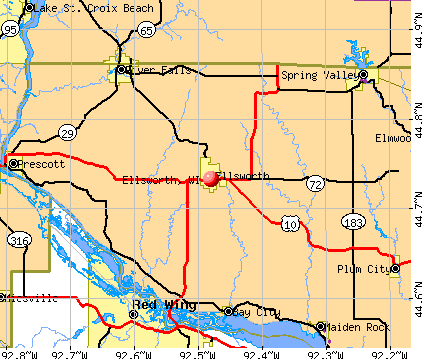
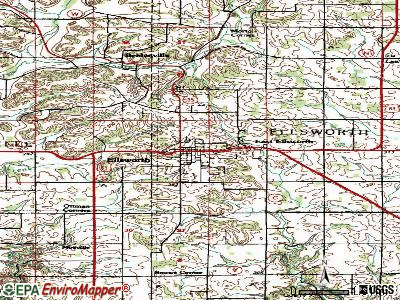
Latitude: 44.73 N, Longitude: 92.48 W
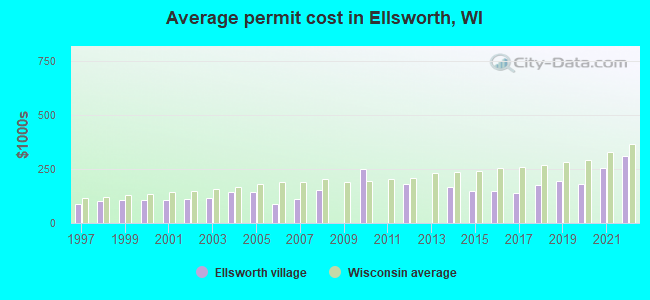
Single-family new house construction building permits:
2022: 1 building , cost: $311,7002021: 8 buildings , average cost: $253,0002020: 4 buildings , average cost: $180,0002019: 6 buildings , average cost: $193,7002018: 6 buildings , average cost: $178,0002017: 8 buildings , average cost: $136,9002016: 8 buildings , average cost: $148,9002015: 3 buildings , average cost: $148,3002014: 3 buildings , average cost: $166,7002012: 1 building , cost: $179,6002010: 2 buildings , average cost: $250,0002008: 1 building , cost: $155,0002007: 3 buildings , average cost: $109,9002006: 26 buildings , average cost: $87,1002005: 23 buildings , average cost: $142,4002004: 30 buildings , average cost: $146,1002003: 23 buildings , average cost: $114,9002002: 18 buildings , average cost: $110,6002001: 22 buildings , average cost: $105,3002000: 24 buildings , average cost: $108,0001999: 24 buildings , average cost: $105,7001998: 12 buildings , average cost: $104,3001997: 8 buildings , average cost: $90,000Unemployment in December 2023:
Population change in the 1990s: +138 (+5.0%).
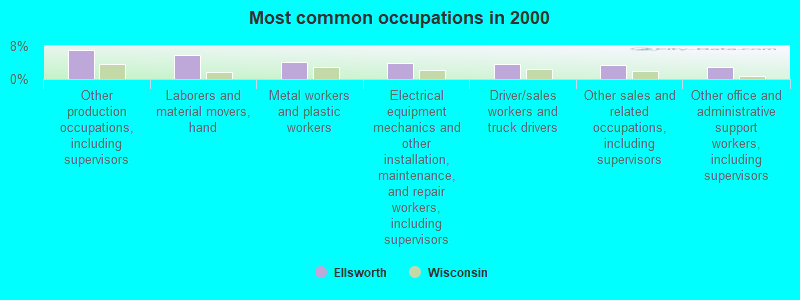
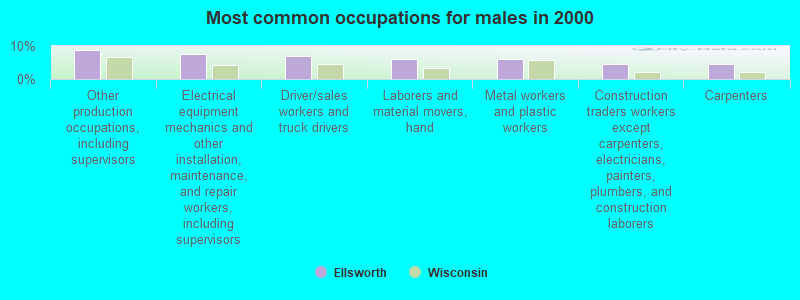
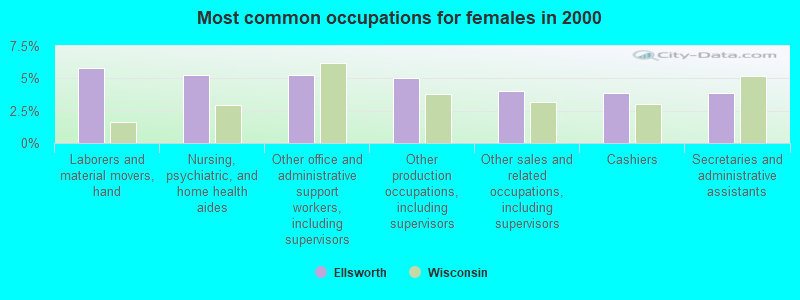
Most common occupations in Ellsworth, WI (%)
Both Males Females
Other production occupations, including supervisors (6.9%)
Laborers and material movers, hand (5.9%)
Metal workers and plastic workers (4.1%)
Electrical equipment mechanics and other installation, maintenance, and repair workers, including supervisors (3.9%)
Driver/sales workers and truck drivers (3.6%)
Other sales and related occupations, including supervisors (3.4%)
Other office and administrative support workers, including supervisors (3.0%)
Other production occupations, including supervisors (8.7%)
Electrical equipment mechanics and other installation, maintenance, and repair workers, including supervisors (7.5%)
Driver/sales workers and truck drivers (7.0%)
Laborers and material movers, hand (6.0%)
Metal workers and plastic workers (6.0%)
Construction traders workers except carpenters, electricians, painters, plumbers, and construction laborers (4.7%)
Carpenters (4.7%)
Laborers and material movers, hand (5.8%)
Nursing, psychiatric, and home health aides (5.3%)
Other office and administrative support workers, including supervisors (5.3%)
Other production occupations, including supervisors (5.0%)
Other sales and related occupations, including supervisors (4.0%)
Cashiers (3.9%)
Secretaries and administrative assistants (3.9%)
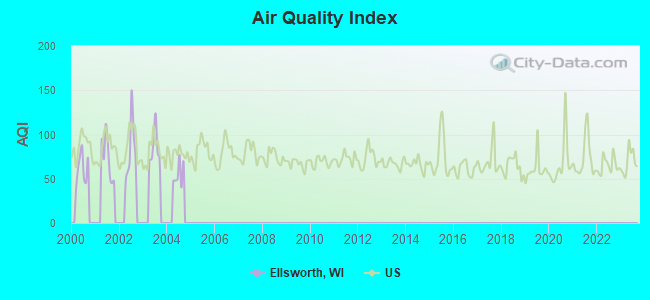
Air pollution and air quality trends(lower is better)
AQI Ozone
Tornado activity:
Ellsworth-area historical tornado activity is slightly above Wisconsin state average. It is 27% greater than the overall U.S. average.
On 6/4/1958, a category F5 (max. wind speeds 261-318 mph) tornado 13.7 miles away from the Ellsworth village center killed 21 people and injured 74 people and caused between $5,000,000 and $50,000,000 in damages.
On 7/27/1987, a category F3 (max. wind speeds 158-206 mph) tornado 16.3 miles away from the village center caused between $500,000 and $5,000,000 in damages.
Earthquake activity:
Ellsworth-area historical earthquake activity is significantly above Wisconsin state average. It is 62% smaller than the overall U.S. average. On 7/9/1975 at 14:54:15, a magnitude 4.6 (4.6 MB, Class: Light, Intensity: IV - V) earthquake occurred 185.2 miles away from Ellsworth center On 6/5/1993 at 01:24:53, a magnitude 4.1 (4.1 LG, Depth: 6.2 mi) earthquake occurred 196.9 miles away from Ellsworth center On 3/4/1983 at 06:32:18, a magnitude 4.6 (4.4 MB, 4.6 LG, 4.4 ML) earthquake occurred 343.8 miles away from Ellsworth center On 6/28/2004 at 06:10:52, a magnitude 4.2 (4.2 MW, Depth: 6.2 mi) earthquake occurred 289.7 miles away from Ellsworth center On 10/20/1995 at 15:57:18, a magnitude 3.7 (3.7 LG, Depth: 3.1 mi, Class: Light, Intensity: II - III) earthquake occurred 225.5 miles away from the city center On 2/9/1994 at 08:45:35, a magnitude 3.1 (3.1 LG, Depth: 3.1 mi) earthquake occurred 124.9 miles away from Ellsworth center Magnitude types: regional Lg-wave magnitude (LG), body-wave magnitude (MB), local magnitude (ML), moment magnitude (MW) Natural disasters: The number of natural disasters in Pierce County (12) is smaller than the US average (15).Major Disasters (Presidential) Declared: 10Emergencies Declared: 2Floods: 8, Storms: 6, Tornadoes: 5, Heavy Rains: 2, Drought: 1, Flash Flood: 1, Hurricane: 1, Wind: 1, Other: 1 (Note: some incidents may be assigned to more than one category). Hospitals and medical centers in Ellsworth: PIERCE CTY HOME CARE (412 W KINNE ST)
ELLSWORTH CARE CTR (403 N MAPLE ST)
PIETY PLACE (120 S PIETY ST)
Amtrak station near Ellsworth: 13 miles: RED WING (LEVEE RD.) Services: partially wheelchair accessible, enclosed waiting area, public restrooms, public payphones, free short-term parking, free long-term parking, call for taxi service, intercity bus service.
Operable nuclear power plants near Ellsworth:
13 miles: Prairie Island 1 and 2 in Red Wing, MN.
Colleges/universities with over 2000 students nearest to Ellsworth:
University of Wisconsin-River Falls (about 11 miles; River Falls, WI ; Full-time enrollment: 5,868)
Inver Hills Community College (about 29 miles; Inver Grove Heights, MN ; FT enrollment: 4,049)
University of Wisconsin-Stout (about 30 miles; Menomonie, WI ; FT enrollment: 8,120)
Dakota County Technical College (about 30 miles; Rosemount, MN ; FT enrollment: 2,478)
Century College (about 33 miles; White Bear Lake, MN ; FT enrollment: 7,393)
Metropolitan State University (about 34 miles; Saint Paul, MN ; FT enrollment: 6,159)
Saint Paul College (about 35 miles; Saint Paul, MN ; FT enrollment: 4,778)
Public high school in Ellsworth: ELLSWORTH HIGH Students: 537, Location: 323 HILLCREST ST, Grades: 9-12)Public elementary/middle schools in Ellsworth: ELLSWORTH MIDDLE Students: 482, Location: 312 PANTHER DR, Grades: 5-8)HILLCREST ELEMENTARY Location: 350 S GRANT ST, Grades: KG-4)
Private elementary/middle school in Ellsworth: ST FRANCIS SCHOOL Students: 138, Location: 244 W WOODWORTH ST, Grades: PK-5)
See full list of schools located in Ellsworth Library in Ellsworth: ELLSWORTH PUBLIC LIBRARY Operating income: $194,180; Location: 312 W. MAIN ST.; 18,149 books ; 4,723 e-books ; 5,702 audio materials ; 3,522 video materials ; 28 state licensed databases ; 7 other licensed databases ; 69 print serial subscriptions )
Notable locations in Ellsworth: (A) , Ellsworth Village Hall (B) , Ellsworth Public Library (C) , Ellsworth Area Ambulance Service (D) , Ellsworth Volunteer Fire Department (E) . Display/hide their locations on the map
Churches in Ellsworth include: (A) , Saint Francis Catholic Church (B) , First Presbyterian Church (C) . Display/hide their locations on the map
Cemetery: (1) . Display/hide its location on the map
Parks in Ellsworth include: (1) , Pierce County Fairgrounds (2) , Summit Hill Park (3) . Display/hide their locations on the map
Tourist attraction:
Hotels:
Birthplace of: George Thompson (Wisconsin politician) - Politician.
Pierce County has a predicted average indoor radon screening level greater than 4 pCi/L (pico curies per liter) - Highest Potential Drinking water stations with addresses in Ellsworth and their reported violations in the past:
ELLSWORTH WATERWORKS (Population served: 2,844, Groundwater):
Past health violations:
MCL, Monthly (TCR) - In OCT-2013, Contaminant: Coliform. Follow-up actions: St Other (OCT-31-2013), St Violation/Reminder Notice (OCT-31-2013), St Public Notif received (OCT-31-2013), St Public Notif requested (OCT-31-2013), St Compliance achieved (NOV-14-2013)
MCL, Monthly (TCR) - In SEP-2013, Contaminant: Coliform. Follow-up actions: St Public Notif requested (SEP-17-2013), St Boil Water Order (SEP-17-2013), St Public Notif received (SEP-18-2013), St Violation/Reminder Notice (SEP-18-2013), St Compliance achieved (SEP-26-2013)
Drinking water stations with addresses in Ellsworth that have no violations reported:
ST PAULS UNITED CH OF CHRIST (Address: W5706 STATE ROAD 72 Population served: 100, Primary Water Source Type: Groundwater)
DAR-RAY ADDITION (Population served: 60, Primary Water Source Type: Groundwater)
SHADY GROVE (Population served: 50, Primary Water Source Type: Groundwater)
TRIANGLE BAR (Population served: 26, Primary Water Source Type: Groundwater)
Average household size: This village:
2.4 peopleWisconsin:
2.4 people
Percentage of family households: This village:
62.1%Whole state:
64.4%
Percentage of households with unmarried partners: This village:
9.2%Whole state:
7.3%
Likely homosexual households (counted as self-reported same-sex unmarried-partner households)
Lesbian couples: 0.3% of all households Gay men: 0.1% of all households
People in group quarters in Ellsworth in 2010:
48 people in nursing facilities/skilled-nursing facilities
34 people in group homes intended for adults
25 people in local jails and other municipal confinement facilities
People in group quarters in Ellsworth in 2000:
67 people in nursing homes
29 people in homes for the mentally retarded
22 people in local jails and other confinement facilities (including police lockups)
5 people in other nonhousehold living situations
Banks with branches in Ellsworth (2011 data):
Associated Bank, National Association: Ellsworth Branch at 420 East Main Street, branch established on 1992/02/10. Info updated 2008/09/12: Bank assets: $21,715.0 mil, Deposits: $15,244.4 mil, headquarters in Green Bay, WI, positive income , Commercial Lending Specialization, 282 total offices , Holding Company: Associated Banc-Corp
Bank Mutual: West Main Street Branch at 385 West Main Street, branch established on 1943/09/01. Info updated 2011/07/21: Bank assets: $2,497.0 mil, Deposits: $2,046.0 mil, headquarters in Brown Deer, WI, negative income in the last year , Mortgage Lending Specialization, 79 total offices
BMO Harris Bank National Association: Ellsworth Branch at 388 West Main Street, branch established on 1888/06/26. Info updated 2011/07/14: Bank assets: $97,264.0 mil, Deposits: $75,624.6 mil, headquarters in Chicago, IL, positive income , 717 total offices , Holding Company: Bank Of Montreal
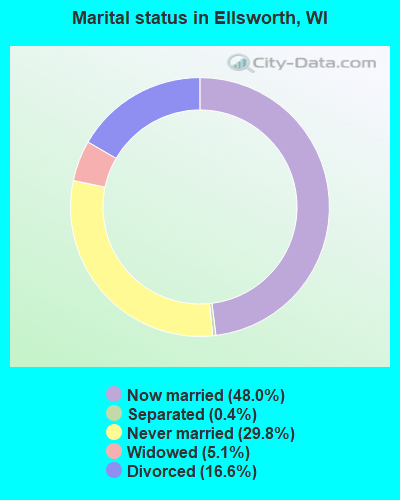
For population 15 years and over in Ellsworth:
Never married: 29.8%Now married: 48.0%Separated: 0.4%Widowed: 5.1%Divorced: 16.6% For population 25 years and over in Ellsworth:
High school or higher: 90.1%Bachelor's degree or higher: 18.1%Graduate or professional degree: 8.4%Unemployed: 7.2%Mean travel time to work (commute): 24.6 minutes
Education Gini index (Inequality in education) Here:
9.3Wisconsin average:
10.4
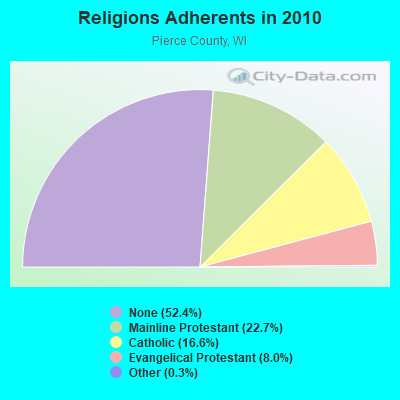
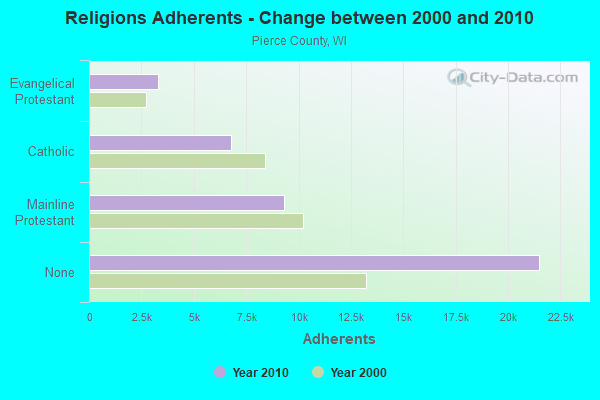
Religion statistics for Ellsworth, WI (based on Pierce County data)
Religion Adherents Congregations Mainline Protestant 9,316 29 Catholic 6,790 6 Evangelical Protestant 3,275 20 Other 137 2 None 21,501 -
Source: Clifford Grammich, Kirk Hadaway, Richard Houseal, Dale E.Jones, Alexei Krindatch, Richie Stanley and Richard H.Taylor. 2012. 2010 U.S.Religion Census: Religious Congregations & Membership Study. Association of Statisticians of American Religious Bodies. Jones, Dale E., et al. 2002. Congregations and Membership in the United States 2000. Nashville, TN: Glenmary Research Center. Graphs represent county-level data
Food Environment Statistics: Number of grocery stores : 6Pierce County :
1.51 / 10,000 pop.Wisconsin :
1.86 / 10,000 pop.
Number of convenience stores (with gas) : 15Here :
3.77 / 10,000 pop.State :
4.12 / 10,000 pop.
Number of full-service restaurants : 29Pierce County :
7.29 / 10,000 pop.Wisconsin :
8.64 / 10,000 pop.
Adult diabetes rate : Pierce County :
6.4%Wisconsin :
7.6%
Adult obesity rate : Here :
26.7%Wisconsin :
27.5%
Low-income preschool obesity rate : Pierce County :
10.4%Wisconsin :
13.0%
Health and Nutrition: Healthy diet rate : This city:
48.7%Wisconsin:
49.5%
Average overall health of teeth and gums : Ellsworth:
44.1%State:
46.6%
Average BMI : Ellsworth:
29.5Wisconsin:
28.7
People feeling badly about themselves : Ellsworth:
21.5%Wisconsin:
21.4%
People not drinking alcohol at all : Here:
14.4%Wisconsin:
10.2%
Average hours sleeping at night : Overweight people : Ellsworth:
34.9%Wisconsin:
34.0%
General health condition : Ellsworth:
55.3%Wisconsin:
56.3%
Average condition of hearing : This city:
76.4%Wisconsin:
78.5%
More about Health and Nutrition of Ellsworth, WI Residents
Local government employment and payroll (March 2022)
Function
Full-time employees
Monthly full-time payroll
Average yearly full-time wage
Part-time employees
Monthly part-time payroll
Police Protection - Officers
6 $32,918 $65,836 0 $0 Streets and Highways
4 $23,302 $69,906 1 $63 Local Libraries
2 $7,801 $46,806 4 $6,972 Water Supply
1 $5,128 $61,536 0 $0 Financial Administration
1 $4,949 $59,388 0 $0 Sewerage
1 $6,097 $73,164 0 $0 Other Government Administration
0 $0 1 $535 Police - Other
0 $0 1 $3,600
Totals for Government
15 $80,196 $64,157 7 $11,171
Ellsworth government finances - Expenditure in 2017 (per resident):
Construction - Parks and Recreation: $250,000 ($75.62)
Regular Highways: $190,000 ($57.47)General Public Buildings: $16,000 ($4.84)Current Operations - Sewerage: $704,000 ($212.95)
Water Utilities: $669,000 ($202.36)Police Protection: $649,000 ($196.31)Regular Highways: $373,000 ($112.83)Local Fire Protection: $293,000 ($88.63)Libraries: $290,000 ($87.72)Natural Resources - Other: $209,000 ($63.22)Central Staff Services: $188,000 ($56.87)Solid Waste Management: $134,000 ($40.53)Health - Other: $67,000 ($20.27)Financial Administration: $49,000 ($14.82)Parks and Recreation: $42,000 ($12.70)General - Other: $32,000 ($9.68)General Public Buildings: $18,000 ($5.44)Miscellaneous Commercial Activities - Other: $9,000 ($2.72)Protective Inspection and Regulation - Other: $6,000 ($1.81)Housing and Community Development: $3,000 ($0.91)Judicial and Legal Services: $2,000 ($0.60)General - Interest on Debt: $176,000 ($53.24)
Other Capital Outlay - Police Protection: $10,000 ($3.02)
Total Salaries and Wages: $1,006,000 ($304.30)
Ellsworth government finances - Revenue in 2017 (per resident):
Charges - Sewerage: $620,000 ($187.54)
Solid Waste Management: $126,000 ($38.11)Other: $20,000 ($6.05)Regular Highways: $4,000 ($1.21)Miscellaneous Commercial Activities: $4,000 ($1.21)Parks and Recreation: $2,000 ($0.60)Local Intergovernmental - Other: $141,000 ($42.65)
Sewerage: $47,000 ($14.22)Highways: $6,000 ($1.81)Miscellaneous - General Revenue - Other: $148,000 ($44.77)
Special Assessments: $27,000 ($8.17)Rents: $21,000 ($6.35)Interest Earnings: $12,000 ($3.63)Fines and Forfeits: $11,000 ($3.33)Sale of Property: $6,000 ($1.81)Revenue - Water Utilities: $247,000 ($74.71)
State Intergovernmental - General Local Government Support: $552,000 ($166.97)
Highways: $143,000 ($43.25)Education: $64,000 ($19.36)Other: $23,000 ($6.96)Tax - Property: $1,358,000 ($410.77)
Other: $69,000 ($20.87)Other License: $28,000 ($8.47)Occupation and Business License - Other: $25,000 ($7.56)
Ellsworth government finances - Debt in 2017 (per resident):
Long Term Debt - Beginning Outstanding - Unspecified Public Purpose: $6,496,000 ($1964.91)
Outstanding Unspecified Public Purpose: $6,159,000 ($1862.98)Retired Unspecified Public Purpose: $416,000 ($125.83)Issue, Unspecified Public Purpose: $80,000 ($24.20)
Ellsworth government finances - Cash and Securities in 2017 (per resident):
Other Funds - Cash and Securities: $5,517,000 ($1668.78)
Businesses in Ellsworth, WI
Name Count Name Count
Chevrolet 1 True Value 1 Dairy Queen 1 U-Haul 1 Ford 1 UPS 1 Subway 1
Strongest AM radio stations in Ellsworth:
WCTS (1030 AM; 50 kW; MAPLEWOOD, MN; Owner: CNTL. BAPT. THEO/AL SEMI MINNEAPOLIS)
WDGY (630 AM; 8 kW; HUDSON, WI; Owner: 630 RADIO, INCORPORATED)
KTIS (900 AM; 25 kW; MINNEAPOLIS, MN; Owner: NORTHWESTERN COLLEGE)
KSTP (1500 AM; 50 kW; ST. PAUL, MN; Owner: KSTP-AM, LLC (DELAWARE))
KFAN (1130 AM; 50 kW; MINNEAPOLIS, MN; Owner: AMFM RADIO LICENSES, L.L.C.)
WCCO (830 AM; 50 kW; MINNEAPOLIS, MN; Owner: INFINITY MEDIA CORPORATION)
WMEQ (880 AM; 10 kW; MENOMONIE, WI; Owner: CAPSTAR TX LIMITED PARTNERSHIP)
WMGT (1220 AM; 5 kW; STILLWATER, MN; Owner: ENDURANCE BROADCASTING, LLC)
WIXK (1590 AM; daytime; 5 kW; NEW RICHMOND, WI; Owner: WIXK-AM, LLC)
WEBC (560 AM; 50 kW; DULUTH, MN)
KCUE (1250 AM; 1 kW; RED WING, MN; Owner: SORENSON BROADCASTING CORP.)
WMIN (740 AM; daytime; 1 kW; HUDSON, WI; Owner: WRPX, INC.)
WMNN (1330 AM; 10 kW; MINNEAPOLIS, MN; Owner: MINNESOTA PUBLIC RADIO.)
Strongest FM radio stations in Ellsworth:
WXPT (104.1 FM; ST. LOUIS PARK, MN; Owner: THE AUDIO HOUSE, INC.)
WEVR-FM (106.3 FM; RIVER FALLS, WI; Owner: HANTEN BROADCASTING COMPANY, INC.)
KNOW-FM (91.1 FM; MINNEAPOLIS-ST. PAUL, MN; Owner: MINNESOTA PUBLIC RADIO)
WLTE (102.9 FM; MINNEAPOLIS, MN; Owner: INFINITY MEDIA CORPORATION)
KSTP-FM (94.5 FM; ST. PAUL, MN; Owner: KSTP-FM, LLC, A DELAWARE LLC)
KWNG (105.9 FM; RED WING, MN; Owner: SORENSON BROADCASTING CORPORATION)
WCAL (89.3 FM; NORTHFIELD, MN; Owner: ST. OLAF COLLEGE)
WHWC (88.3 FM; MENOMONIE, WI; Owner: STATE OF WISCONSIN - EDUCATIONAL COMMUNICATIONS BOARD)
W211AY (90.1 FM; MENOMONIE, WI; Owner: CALVARY CHAPEL OF TWIN FALLS, INC.)
KEEY-FM (102.1 FM; ST. PAUL, MN; Owner: AMFM RADIO LICENSES, L.L.C.)
KTIS-FM (98.5 FM; MINNEAPOLIS, MN; Owner: NORTHWESTERN COLLEGE)
KDWB-FM (101.3 FM; RICHFIELD, MN; Owner: AMFM RADIO LICENSES, L.L.C.)
KQRS-FM (92.5 FM; GOLDEN VALLEY, MN; Owner: KQRS, Inc.)
KSJN (99.5 FM; MINNEAPOLIS, MN; Owner: MINNESOTA PUBLIC RADIO)
KXXR (93.7 FM; MINNEAPOLIS, MN; Owner: KQRS, INC.)
WVSS (90.7 FM; MENOMONIE, WI; Owner: BD. OF REGENTS, UNIVERSITY OF WISCONSIN SYSTEM)
KLCH (94.9 FM; LAKE CITY, MN; Owner: WAITT RADIO, INC.)
WDMO (95.9 FM; DURAND, WI; Owner: ZOE COMMUNICATIONS, INC.)
KMFX-FM (102.5 FM; LAKE CITY, MN; Owner: CLEAR CHANNEL BROADCASTING LICENSES, INC.)
K297AF (107.3 FM; RED WING, MN; Owner: KRCH OF MINNESOTA, INC.)
TV broadcast stations around Ellsworth:
KMSP-TV (Channel 9; MINNEAPOLIS, MN; Owner: FOX TELEVISION STATIONS, INC.)
KARE (Channel 11; MINNEAPOLIS, MN; Owner: MULTIMEDIA HOLDINGS CORPORATION)
KSTP-TV (Channel 5; ST. PAUL, MN; Owner: HUBBARD BROADCASTING, INC.)
KTCA-TV (Channel 2; ST. PAUL, MN; Owner: TWIN CITIES PUBLIC TELEVISION, INC.)
WCCO-TV (Channel 4; MINNEAPOLIS, MN; Owner: CBS BROADCASTING INC.)
KTCI-TV (Channel 17; ST. PAUL, MN; Owner: TWIN CITIES PUBLIC TELEVISION, INC.)
KSTC-TV (Channel 45; MINNEAPOLIS, MN; Owner: HUBBARD BROADCASTING, INC.)
KMWB (Channel 23; MINNEAPOLIS, MN; Owner: KLGT LICENSEE, LLC)
WHWC-TV (Channel 28; MENOMONIE, WI; Owner: STATE OF WISCONSIN - EDUCATIONAL COMMUNICATIONS BOARD)
WFTC (Channel 29; MINNEAPOLIS, MN; Owner: FOX TELEVISION STATIONS, INC.)
W55AP (Channel 55; RIVER FALLS, WI; Owner: STATE OF WISCONSIN - EDUCATIONAL COMMUNICATIONS BOARD)
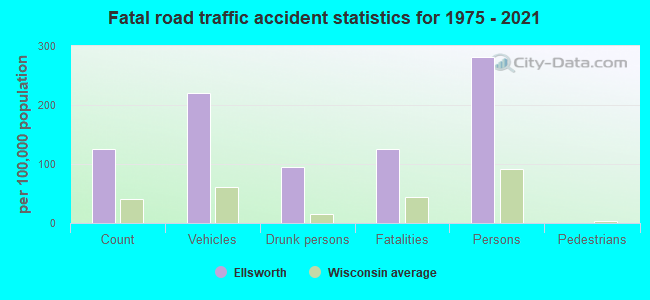
Ellsworth fatal accident statistics for 1975 - 2021
Ellsworth fatal accident list:
Jun 1, 2016 12:43 AM, Sr-65, Cross Town Rd, Lat: 44.750111, Lon: -92.487061, Vehicles: 3, Persons: 3, Fatalities: 1Lat: 44.716197, Lon: -92.477358, Vehicles: 1, Persons: 2, Fatalities: 1, Drunk persons involved: 1Lat: 44.731375, Lon: -92.494967, Vehicles: 1, Persons: 2, Fatalities: 1, Drunk persons involved: 1Lat: 44.732134, Lon: -92.485800, Vehicles: 2, Persons: 2, Fatalities: 1, Drunk persons involved: 1
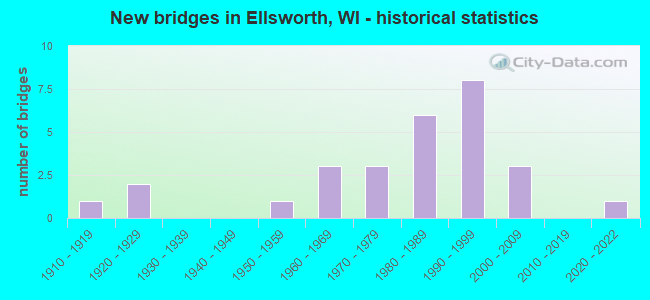
National Bridge Inventory (NBI) Statistics 28 Number of bridges118ft / 35.9m Total length $332,000 Total costs25,999 Total average daily traffic1,667 Total average daily truck traffic32,145 Total future (year 2039) average daily traffic
New bridges - historical statistics
1 1910-1919 2 1920-1929 1 1950-1959 3 1960-1969 3 1970-1979 6 1980-1989 8 1990-1999 3 2000-2009 1 2020-2022
See full National Bridge Inventory statistics for Ellsworth, WI
FCC Registered Cell Phone Towers: 4 (
See the full list of FCC Registered Cell Phone Towers in Ellsworth )
FCC Registered Antenna Towers: 53 (
See the full list of FCC Registered Antenna Towers )
FCC Registered Broadcast Land Mobile Towers: 6
432 W Main St (Lat: 44.733028 Lon: -92.485472), Type: Tower, Structure height: 73 m, Overall height: 79 m, Call Sign: WPQK972, Assigned Frequencies: 45.1200 MHz, Grant Date: 06/17/2015, Expiration Date: 08/22/2025, Certifier: Michael Knoll, Registrant: County Of Pierce, 432 W Main Street, Ellsworth, WI 54011, Phone: (715) 273-5051, Fax: (715) 273-6856, Email:
Lat: 44.733333 Lon: -92.358333, Call Sign: WPXD750, Assigned Frequencies: 154.980 MHz, Grant Date: 02/23/2023, Expiration Date: 03/12/2033, Certifier: Lester W Heise, Registrant: Town Of El Paso, N5325 450th St., Ellsworth, WI 54011, Phone: (715) 273-4811, Email:
Lat: 44.744694 Lon: -92.373556, Call Sign: WQOJ650, Assigned Frequencies: 464.862 MHz, Grant Date: 10/19/2011, Expiration Date: 10/19/2021, Cancellation Date: 12/25/2021, Certifier: Robert Fenske, Registrant: Hilltop Communications, 1523 Old W. Main St., Red Wing, MN 55066, Phone: (651) 388-1795, Fax: (651) 385-9020, Email:
Lat: 44.727361 Lon: -92.480472, Call Sign: WQWC857, Assigned Frequencies: 72.3200 MHz, Grant Date: 07/21/2015, Expiration Date: 07/21/2025, Certifier: Mark Stoesz, Registrant: Federal License Management, 175 Pine St, Suite 104, Williamsport, PA 17701-6549, Phone: (866) 908-2220, Fax: (570) 323-4002, Email:
Lat: 44.730194 Lon: -92.540500, Call Sign: WQZW877, Licensee ID: L02120002, Assigned Frequencies: 153.117 MHz, 158.160 MHz, 160.072 MHz, Grant Date: 08/24/2017, Expiration Date: 08/24/2027, Certifier: Nicholas Huppert, Registrant: Nicholas Huppert, W8191 Us Hwy 10, Ellsworth, WI 54011, Phone: (715) 497-3522, Email:
Lat: 44.689694 Lon: -92.435722, Call Sign: WRPX651, Licensee ID: L02542512, Assigned Frequencies: 153.155 MHz, Grant Date: 04/05/2022, Expiration Date: 04/05/2032, Certifier: Nathan Sears, Registrant: Nathan Sears, W6054 410th Ave, Ellsworth, WI 54011, Phone: (715) 821-0865, Email:
FCC Registered Microwave Towers: 13 (
See the full list of FCC Registered Microwave Towers in this town )
FCC Registered Amateur Radio Licenses: 26 (
See the full list of FCC Registered Amateur Radio Licenses in Ellsworth )
FAA Registered Aircraft: 11 (
See the full list of FAA Registered Aircraft in Ellsworth )
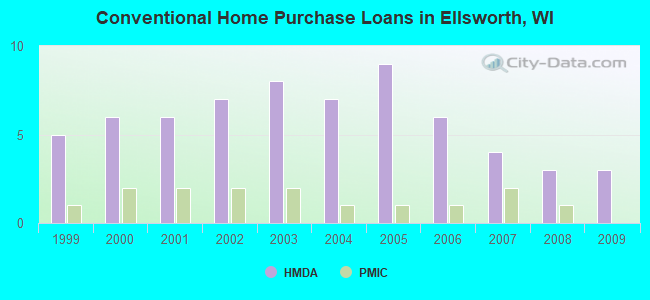
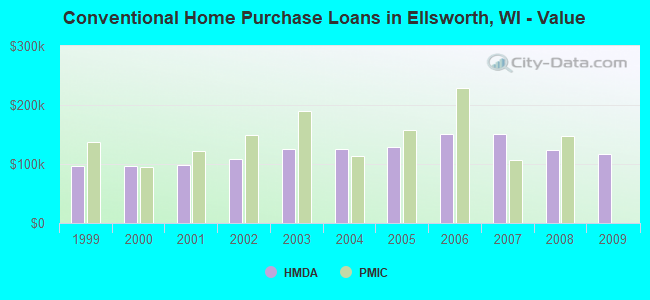
Home Mortgage Disclosure Act Aggregated Statistics For Year 2009(Based on 1 partial tract) A) FHA, FSA/RHS & VA B) Conventional C) Refinancings D) Home Improvement Loans F) Non-occupant Loans on Number Average Value Number Average Value Number Average Value Number Average Value Number Average Value
LOANS ORIGINATED 1 $116,240 3 $116,187 12 $140,187 1 $46,640 1 $107,840 APPLICATIONS APPROVED, NOT ACCEPTED 0 $0 0 $0 1 $126,720 0 $0 0 $0 APPLICATIONS DENIED 0 $0 1 $52,720 3 $200,027 0 $0 0 $0 APPLICATIONS WITHDRAWN 0 $0 0 $0 3 $132,080 0 $0 0 $0 FILES CLOSED FOR INCOMPLETENESS 0 $0 0 $0 1 $97,040 0 $0 0 $0
Aggregated Statistics For Year 2008(Based on 1 partial tract) A) FHA, FSA/RHS & VA B) Conventional C) Refinancings D) Home Improvement Loans F) Non-occupant Loans on Number Average Value Number Average Value Number Average Value Number Average Value Number Average Value
LOANS ORIGINATED 1 $125,680 3 $123,893 7 $149,280 1 $96,240 1 $112,400 APPLICATIONS APPROVED, NOT ACCEPTED 0 $0 0 $0 1 $171,200 0 $0 0 $0 APPLICATIONS DENIED 0 $0 1 $78,960 4 $134,240 1 $55,200 1 $54,800 APPLICATIONS WITHDRAWN 0 $0 1 $123,040 2 $188,440 0 $0 0 $0 FILES CLOSED FOR INCOMPLETENESS 0 $0 0 $0 0 $0 0 $0 0 $0
Aggregated Statistics For Year 2007(Based on 1 partial tract) B) Conventional C) Refinancings D) Home Improvement Loans F) Non-occupant Loans on G) Loans On Manufactured Number Average Value Number Average Value Number Average Value Number Average Value Number Average Value
LOANS ORIGINATED 4 $150,580 8 $133,300 2 $62,880 1 $87,200 1 $52,720 APPLICATIONS APPROVED, NOT ACCEPTED 1 $93,600 1 $225,120 0 $0 0 $0 0 $0 APPLICATIONS DENIED 1 $83,680 5 $141,392 0 $0 0 $0 0 $0 APPLICATIONS WITHDRAWN 1 $79,120 2 $195,040 0 $0 0 $0 0 $0 FILES CLOSED FOR INCOMPLETENESS 0 $0 1 $94,720 0 $0 0 $0 0 $0
Aggregated Statistics For Year 2006(Based on 1 partial tract) B) Conventional C) Refinancings D) Home Improvement Loans F) Non-occupant Loans on Number Average Value Number Average Value Number Average Value Number Average Value
LOANS ORIGINATED 6 $150,627 10 $111,840 2 $62,600 1 $103,840 APPLICATIONS APPROVED, NOT ACCEPTED 0 $0 2 $117,680 0 $0 0 $0 APPLICATIONS DENIED 1 $91,760 5 $144,000 0 $0 0 $0 APPLICATIONS WITHDRAWN 1 $104,640 3 $127,093 0 $0 0 $0 FILES CLOSED FOR INCOMPLETENESS 1 $66,800 1 $168,480 0 $0 0 $0
Aggregated Statistics For Year 2005(Based on 1 partial tract) B) Conventional C) Refinancings D) Home Improvement Loans F) Non-occupant Loans on G) Loans On Manufactured Number Average Value Number Average Value Number Average Value Number Average Value Number Average Value
LOANS ORIGINATED 9 $128,409 12 $130,027 2 $56,440 1 $146,240 1 $77,680 APPLICATIONS APPROVED, NOT ACCEPTED 1 $149,920 1 $148,240 0 $0 0 $0 0 $0 APPLICATIONS DENIED 2 $97,720 5 $149,456 0 $0 0 $0 0 $0 APPLICATIONS WITHDRAWN 1 $99,360 5 $149,552 0 $0 0 $0 0 $0 FILES CLOSED FOR INCOMPLETENESS 0 $0 2 $141,520 0 $0 0 $0 0 $0
Aggregated Statistics For Year 2004(Based on 1 partial tract) A) FHA, FSA/RHS & VA B) Conventional C) Refinancings D) Home Improvement Loans F) Non-occupant Loans on G) Loans On Manufactured Number Average Value Number Average Value Number Average Value Number Average Value Number Average Value Number Average Value
LOANS ORIGINATED 1 $100,720 7 $124,903 14 $123,914 3 $39,840 1 $134,400 1 $74,000 APPLICATIONS APPROVED, NOT ACCEPTED 0 $0 1 $187,920 2 $104,360 0 $0 0 $0 0 $0 APPLICATIONS DENIED 0 $0 2 $97,240 4 $134,600 0 $0 0 $0 0 $0 APPLICATIONS WITHDRAWN 0 $0 1 $111,520 5 $145,600 0 $0 0 $0 0 $0 FILES CLOSED FOR INCOMPLETENESS 0 $0 0 $0 0 $0 0 $0 0 $0 0 $0
Aggregated Statistics For Year 2003(Based on 1 partial tract) A) FHA, FSA/RHS & VA B) Conventional C) Refinancings D) Home Improvement Loans F) Non-occupant Loans on Number Average Value Number Average Value Number Average Value Number Average Value Number Average Value
LOANS ORIGINATED 1 $75,920 8 $125,800 30 $112,227 2 $30,800 1 $69,360 APPLICATIONS APPROVED, NOT ACCEPTED 0 $0 1 $79,600 2 $110,480 0 $0 0 $0 APPLICATIONS DENIED 0 $0 1 $78,240 6 $119,747 1 $6,640 0 $0 APPLICATIONS WITHDRAWN 0 $0 1 $101,840 3 $139,520 0 $0 0 $0 FILES CLOSED FOR INCOMPLETENESS 0 $0 0 $0 1 $61,440 0 $0 0 $0
Aggregated Statistics For Year 2002(Based on 1 partial tract) A) FHA, FSA/RHS & VA B) Conventional C) Refinancings D) Home Improvement Loans Number Average Value Number Average Value Number Average Value Number Average Value
LOANS ORIGINATED 1 $89,840 7 $108,594 24 $106,143 1 $23,440 APPLICATIONS APPROVED, NOT ACCEPTED 0 $0 1 $99,840 1 $228,560 0 $0 APPLICATIONS DENIED 0 $0 2 $105,680 4 $117,800 1 $27,040 APPLICATIONS WITHDRAWN 0 $0 1 $76,560 2 $88,280 0 $0 FILES CLOSED FOR INCOMPLETENESS 0 $0 0 $0 1 $69,840 0 $0
Aggregated Statistics For Year 2001(Based on 1 partial tract) A) FHA, FSA/RHS & VA B) Conventional C) Refinancings D) Home Improvement Loans F) Non-occupant Loans on Number Average Value Number Average Value Number Average Value Number Average Value Number Average Value
LOANS ORIGINATED 1 $121,280 6 $98,440 19 $102,055 2 $14,040 1 $37,920 APPLICATIONS APPROVED, NOT ACCEPTED 0 $0 0 $0 1 $61,120 0 $0 0 $0 APPLICATIONS DENIED 0 $0 1 $72,800 3 $89,947 1 $15,040 0 $0 APPLICATIONS WITHDRAWN 0 $0 0 $0 2 $104,040 0 $0 0 $0 FILES CLOSED FOR INCOMPLETENESS 0 $0 0 $0 0 $0 0 $0 0 $0
Aggregated Statistics For Year 2000(Based on 1 partial tract) A) FHA, FSA/RHS & VA B) Conventional C) Refinancings D) Home Improvement Loans F) Non-occupant Loans on Number Average Value Number Average Value Number Average Value Number Average Value Number Average Value
LOANS ORIGINATED 1 $102,720 6 $97,413 6 $80,587 2 $23,680 1 $48,080 APPLICATIONS APPROVED, NOT ACCEPTED 0 $0 1 $41,280 1 $38,080 0 $0 0 $0 APPLICATIONS DENIED 0 $0 1 $64,960 3 $78,827 0 $0 0 $0 APPLICATIONS WITHDRAWN 0 $0 0 $0 1 $94,560 0 $0 0 $0 FILES CLOSED FOR INCOMPLETENESS 0 $0 0 $0 0 $0 0 $0 0 $0
Aggregated Statistics For Year 1999(Based on 1 partial tract) B) Conventional C) Refinancings D) Home Improvement Loans F) Non-occupant Loans on Number Average Value Number Average Value Number Average Value Number Average Value
LOANS ORIGINATED 5 $96,198 9 $71,057 3 $19,233 1 $51,330 APPLICATIONS APPROVED, NOT ACCEPTED 0 $0 1 $69,100 1 $7,090 0 $0 APPLICATIONS DENIED 3 $47,900 3 $78,503 1 $28,850 0 $0 APPLICATIONS WITHDRAWN 0 $0 2 $51,445 1 $34,670 0 $0 FILES CLOSED FOR INCOMPLETENESS 0 $0 0 $0 0 $0 0 $0
Detailed HMDA statistics for the following Tracts:
9607.00
Private Mortgage Insurance Companies Aggregated Statistics For Year 2008(Based on 1 partial tract) A) Conventional B) Refinancings Number Average Value Number Average Value
LOANS ORIGINATED 1 $147,360 1 $102,880 APPLICATIONS APPROVED, NOT ACCEPTED 0 $0 0 $0 APPLICATIONS DENIED 0 $0 0 $0 APPLICATIONS WITHDRAWN 0 $0 0 $0 FILES CLOSED FOR INCOMPLETENESS 0 $0 0 $0
Aggregated Statistics For Year 2007(Based on 1 partial tract) A) Conventional B) Refinancings Number Average Value Number Average Value
LOANS ORIGINATED 2 $107,160 1 $164,800 APPLICATIONS APPROVED, NOT ACCEPTED 0 $0 0 $0 APPLICATIONS DENIED 0 $0 0 $0 APPLICATIONS WITHDRAWN 0 $0 0 $0 FILES CLOSED FOR INCOMPLETENESS 0 $0 0 $0
Aggregated Statistics For Year 2006(Based on 1 partial tract) A) Conventional Number Average Value
LOANS ORIGINATED 1 $229,520 APPLICATIONS APPROVED, NOT ACCEPTED 0 $0 APPLICATIONS DENIED 0 $0 APPLICATIONS WITHDRAWN 0 $0 FILES CLOSED FOR INCOMPLETENESS 0 $0
Aggregated Statistics For Year 2005(Based on 1 partial tract) A) Conventional Number Average Value
LOANS ORIGINATED 1 $158,160 APPLICATIONS APPROVED, NOT ACCEPTED 0 $0 APPLICATIONS DENIED 0 $0 APPLICATIONS WITHDRAWN 0 $0 FILES CLOSED FOR INCOMPLETENESS 0 $0
Aggregated Statistics For Year 2004(Based on 1 partial tract) A) Conventional B) Refinancings Number Average Value Number Average Value
LOANS ORIGINATED 1 $114,240 1 $154,400 APPLICATIONS APPROVED, NOT ACCEPTED 0 $0 0 $0 APPLICATIONS DENIED 0 $0 0 $0 APPLICATIONS WITHDRAWN 0 $0 0 $0 FILES CLOSED FOR INCOMPLETENESS 0 $0 0 $0
Aggregated Statistics For Year 2003(Based on 1 partial tract) A) Conventional B) Refinancings Number Average Value Number Average Value
LOANS ORIGINATED 2 $190,400 2 $138,600 APPLICATIONS APPROVED, NOT ACCEPTED 0 $0 1 $102,160 APPLICATIONS DENIED 0 $0 0 $0 APPLICATIONS WITHDRAWN 0 $0 0 $0 FILES CLOSED FOR INCOMPLETENESS 0 $0 0 $0
Aggregated Statistics For Year 2002(Based on 1 partial tract) A) Conventional B) Refinancings Number Average Value Number Average Value
LOANS ORIGINATED 2 $149,000 1 $158,880 APPLICATIONS APPROVED, NOT ACCEPTED 0 $0 0 $0 APPLICATIONS DENIED 0 $0 0 $0 APPLICATIONS WITHDRAWN 0 $0 0 $0 FILES CLOSED FOR INCOMPLETENESS 0 $0 0 $0
Aggregated Statistics For Year 2001(Based on 1 partial tract) A) Conventional B) Refinancings Number Average Value Number Average Value
LOANS ORIGINATED 2 $122,520 1 $156,880 APPLICATIONS APPROVED, NOT ACCEPTED 0 $0 0 $0 APPLICATIONS DENIED 0 $0 0 $0 APPLICATIONS WITHDRAWN 0 $0 0 $0 FILES CLOSED FOR INCOMPLETENESS 0 $0 0 $0
Aggregated Statistics For Year 2000(Based on 1 partial tract) A) Conventional Number Average Value
LOANS ORIGINATED 2 $95,560 APPLICATIONS APPROVED, NOT ACCEPTED 0 $0 APPLICATIONS DENIED 0 $0 APPLICATIONS WITHDRAWN 0 $0 FILES CLOSED FOR INCOMPLETENESS 0 $0
Aggregated Statistics For Year 1999(Based on 1 partial tract) A) Conventional Number Average Value
LOANS ORIGINATED 1 $138,120 APPLICATIONS APPROVED, NOT ACCEPTED 0 $0 APPLICATIONS DENIED 0 $0 APPLICATIONS WITHDRAWN 0 $0 FILES CLOSED FOR INCOMPLETENESS 0 $0
Detailed PMIC statistics for the following Tracts:
9607.00
Ellsworth compared to Wisconsin state average:
Unemployed percentage below state average. Black race population percentage significantly below state average. Median age below state average.
Top Patent Applicants
Robert M. Benson (10)
Peter Gunderson (8)
Todd Sarnstrom (5)
Dean S. Holmes (4)
Kent Brittain (4)
James F. Poch (3)
Todd R. Sarnstrom (3)
Robert Benson (3)
Quinn D. Sanford (3)
Farhad Kosari (3)
Total of 62 patent applications in 2008-2024.


 Recent articles from our blog. Our writers, many of them Ph.D. graduates or candidates, create easy-to-read articles on a wide variety of topics.

 (34.3 miles
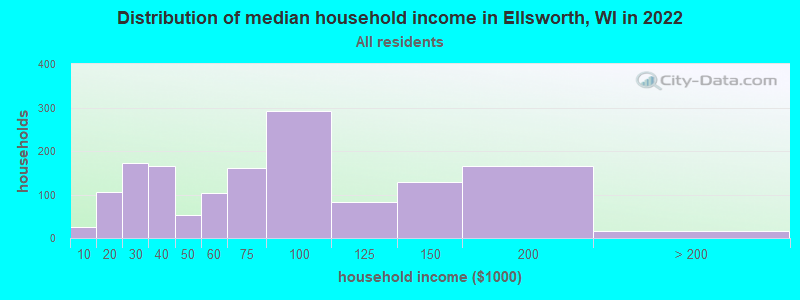


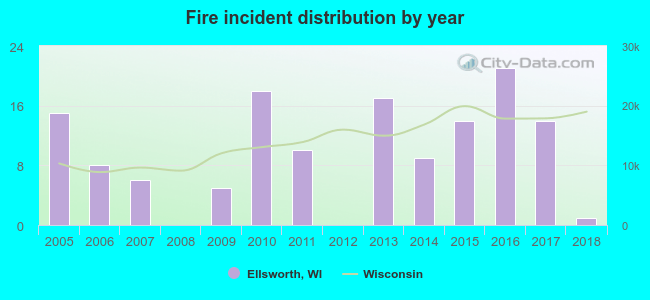 Based on the data from the years 2005 - 2018 the average number of fire incidents per year is 10. The highest number of fires - 21 took place in 2016, and the least - 0 in 2008. The data has a decreasing trend.
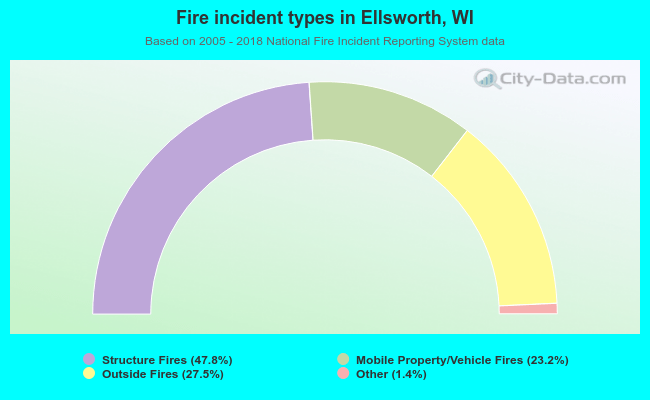 When looking into fire subcategories, the most incidents belonged to: Structure Fires (47.8%), and Outside Fires (27.5%).