Percentage of residents living in poverty in 2022: 9.2%
(8.7% for White Non-Hispanic residents, 12.6% for Black residents, 2.7% for Hispanic or Latino residents, 3.4% for two or more races residents)
According to our research of Ohio and other state lists, there was 1 registered sex offender living in Deer Park, Ohio as of June 07, 2024. The ratio of all residents to sex offenders in Deer Park is 5,729 to 1. The ratio of registered sex offenders to all residents in this city is much lower than the state average.
Crime rates in Deer Park by year
Type
2009
2010
2011
2012
2013
2014
2015
2016
2017
2018
2019
2020
2021
2022
Murders (per 100,000)
0 (0.0)
0 (0.0)
0 (0.0)
0 (0.0)
0 (0.0)
0 (0.0)
1 (17.6)
0 (0.0)
0 (0.0)
0 (0.0)
0 (0.0)
0 (0.0)
0 (0.0)
0 (0.0)
Rapes (per 100,000)
1 (17.5)
0 (0.0)
0 (0.0)
1 (17.5)
1 (17.6)
2 (35.1)
0 (0.0)
1 (17.6)
1 (17.7)
0 (0.0)
1 (17.7)
0 (0.0)
0 (0.0)
0 (0.0)
Robberies (per 100,000)
5 (87.3)
3 (52.3)
1 (17.4)
2 (34.9)
0 (0.0)
1 (17.6)
2 (35.1)
4 (70.5)
0 (0.0)
1 (17.6)
0 (0.0)
0 (0.0)
0 (0.0)
0 (0.0)
Assaults (per 100,000)
5 (87.3)
0 (0.0)
4 (69.7)
8 (139.8)
7 (122.9)
2 (35.1)
8 (140.4)
4 (70.5)
5 (88.3)
1 (17.6)
1 (17.7)
0 (0.0)
0 (0.0)
1 (18.9)
Burglaries (per 100,000)
21 (366.8)
17 (296.4)
10 (174.2)
22 (384.4)
17 (298.5)
8 (140.5)
15 (263.3)
9 (158.7)
4 (70.6)
2 (35.3)
1 (17.7)
3 (54.0)
0 (0.0)
3 (56.6)
Thefts (per 100,000)
105 (1,834)
81 (1,412)
52 (905.9)
82 (1,433)
69 (1,212)
79 (1,388)
54 (948.0)
63 (1,111)
44 (776.7)
33 (581.9)
28 (495.2)
14 (252.0)
1 (18.1)
16 (301.8)
Auto thefts (per 100,000)
5 (87.3)
5 (87.2)
2 (34.8)
8 (139.8)
3 (52.7)
6 (105.4)
4 (70.2)
2 (35.3)
3 (53.0)
2 (35.3)
7 (123.8)
5 (90.0)
0 (0.0)
0 (0.0)
Arson (per 100,000)
1 (17.5)
1 (17.4)
1 (17.4)
3 (52.4)
0 (0.0)
2 (35.1)
1 (17.6)
0 (0.0)
0 (0.0)
0 (0.0)
1 (17.7)
0 (0.0)
0 (0.0)
0 (0.0)
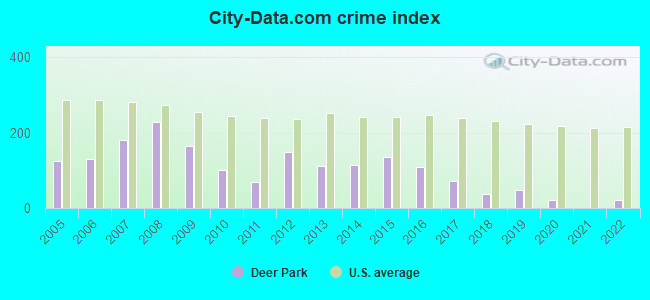
City-Data.com crime index
163.7
99.9
70.4
147.8
112.2
114.2
135.7
107.7
72.0
37.4
48.6
21.1
0.7
19.8
The City-Data.com crime index weighs serious crimes and violent crimes more heavily. Higher means more crime, U.S. average is 246.1. It adjusts for the number of visitors and daily workers commuting into cities.
Latest news from Deer Park, OH collected exclusively by city-data.com from local newspapers, TV, and radio stations
Ancestries: German (27.3%), Irish (11.5%), Russian (7.3%), American (6.0%), English (5.1%), Italian (4.0%).
Current Local Time: EST time zone
Elevation: 870 feet
Land area: 0.86 square miles.
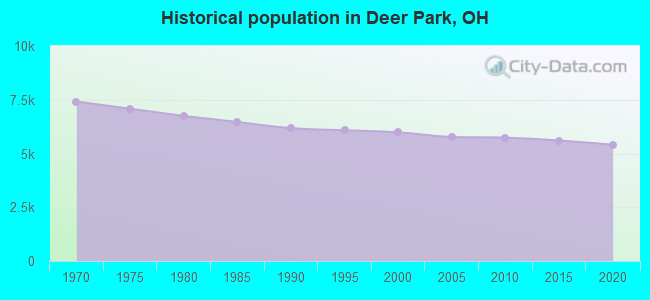
Population density: 6,203 people per square mile (high).
79 residents are foreign born
This city:
1.5%
Ohio:
4.9%
Median real estate property taxes paid for housing units with mortgages in 2022: $3,786 (1.8%) Median real estate property taxes paid for housing units with no mortgage in 2022: $3,829 (2.0%)
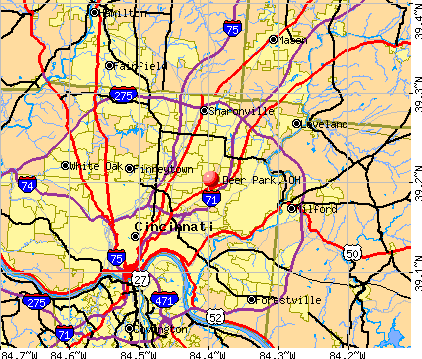
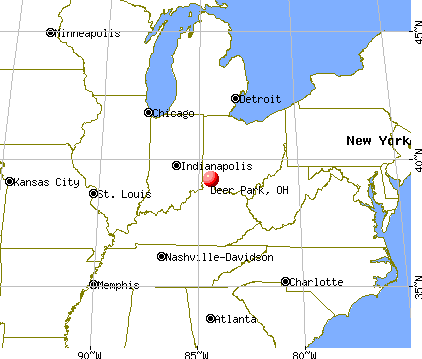
Nearest city with pop. 50,000+: Cincinnati, OH (7.4 miles , pop. 331,285).
Nearest city with pop. 1,000,000+: Chicago, IL (251.1 miles , pop. 2,896,016).
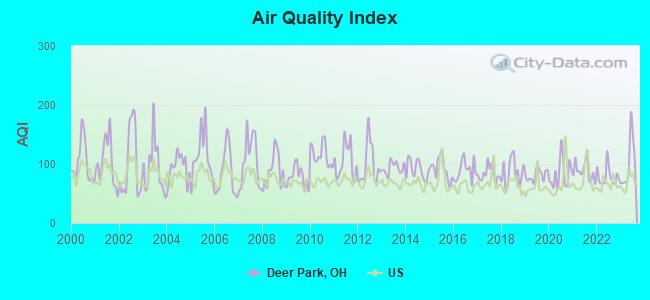
Air Quality Index (AQI) level in 2023 was 101. This is worse than average.
City:
101
U.S.:
73
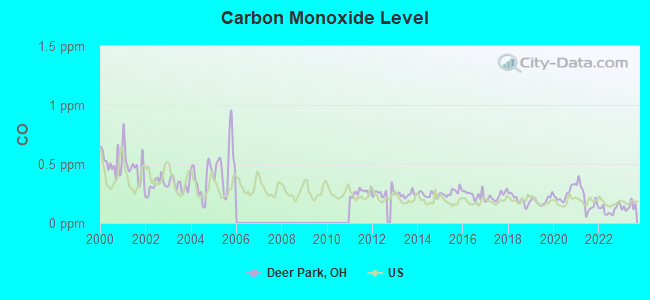
Carbon Monoxide (CO) [ppm] level in 2023 was 0.138. This is significantly better than average.Closest monitor was 3.8 miles away from the city center.
City:
0.138
U.S.:
0.251
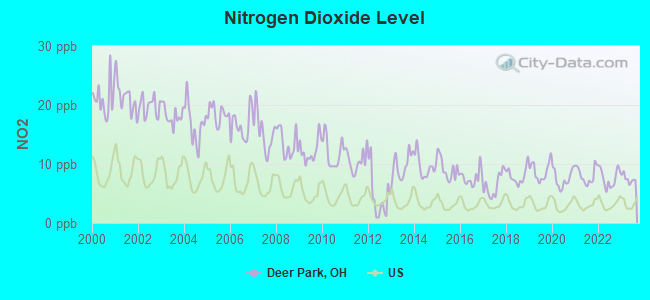
Nitrogen Dioxide (NO2) [ppb] level in 2023 was 7.49. This is significantly worse than average.Closest monitor was 2.2 miles away from the city center.
City:
7.49
U.S.:
5.11
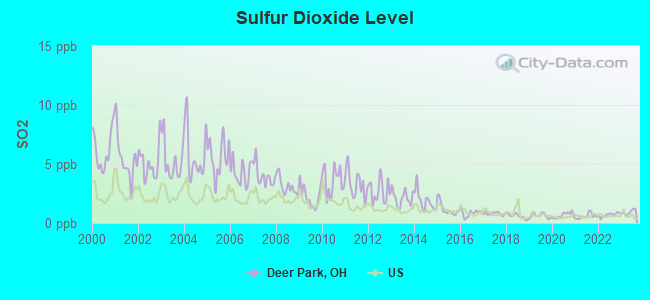
Sulfur Dioxide (SO2) [ppb] level in 2023 was 0.921. This is significantly better than average.Closest monitor was 2.2 miles away from the city center.
City:
0.921
U.S.:
1.515
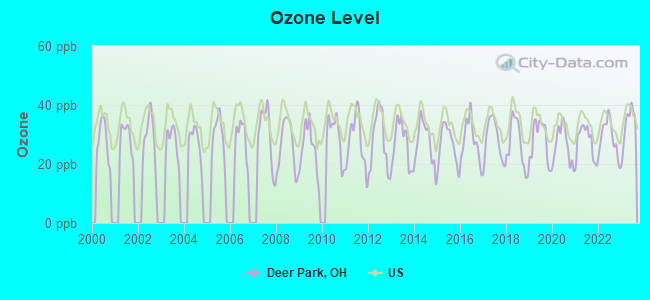
Ozone [ppb] level in 2023 was 33.4. This is about average.Closest monitor was 4.6 miles away from the city center.
City:
33.4
U.S.:
33.3
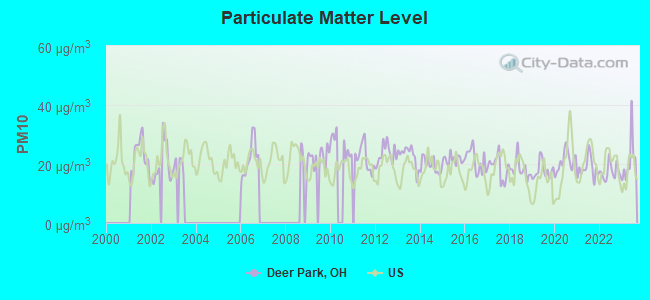
Particulate Matter (PM10) [µg/m3] level in 2023 was 21.3. This is about average.Closest monitor was 3.5 miles away from the city center.
City:
21.3
U.S.:
19.2
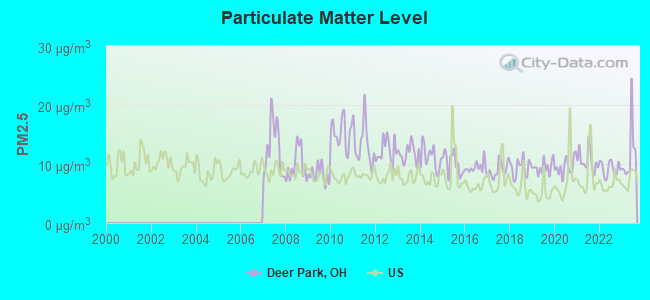
Particulate Matter (PM2.5) [µg/m3] level in 2023 was 11.7. This is significantly worse than average.Closest monitor was 4.5 miles away from the city center.
City:
11.7
U.S.:
8.1
Tornado activity:
Deer Park-area historical tornado activity is slightly above Ohio state average. It is 62% greater than the overall U.S. average.
On 4/3/1974, a category F5 (max. wind speeds 261-318 mph) tornado 12.6 miles away from the Deer Park city center killed 3 peopleand injured 210 people.
On 4/9/1999, a category F4 (max. wind speeds 207-260 mph) tornado 2.3 miles away from the city center killed 4 peopleand injured 65 peopleand caused $85 million in damages.
Earthquake activity:
Deer Park-area historical earthquake activity is significantly above Ohio state average. It is 44% greater than the overall U.S. average.
On 7/27/1980 at 18:52:21, a magnitude 5.2 (5.1 MB, 4.7 MS, 5.0 UK, 5.2 UK, Class: Moderate, Intensity: VI - VII) earthquake occurred 73.3 miles away from the city center On 4/18/2008 at 09:36:59, a magnitude 5.4 (5.1 MB, 4.8 MS, 5.4 MW, 5.2 MW) earthquake occurred 195.1 miles away from the city center On 4/18/2008 at 09:36:59, a magnitude 5.2 (5.2 MW, Depth: 8.9 mi) earthquake occurred 195.1 miles away from Deer Park center On 9/7/1988 at 02:28:09, a magnitude 4.6 (4.5 MB, 4.6 LG, Class: Light, Intensity: IV - V) earthquake occurred 78.5 miles away from the city center On 6/10/1987 at 23:48:54, a magnitude 5.1 (4.9 MB, 4.4 MS, 4.6 MS, 5.1 LG) earthquake occurred 189.3 miles away from Deer Park center On 7/12/1986 at 08:19:37, a magnitude 4.5 (4.5 MB) earthquake occurred 92.2 miles away from Deer Park center Magnitude types: regional Lg-wave magnitude (LG), body-wave magnitude (MB), surface-wave magnitude (MS), moment magnitude (MW)
Natural disasters:
The number of natural disasters in Hamilton County (15) is near the US average (15). Major Disasters (Presidential) Declared: 10 Emergencies Declared: 3
Causes of natural disasters: Floods: 7, Storms: 7, Mudslides: 2, Tornadoes: 2, Blizzard: 1, Heavy Rain: 1, Hurricane: 1, Landslide: 1, Snow: 1, Snowstorm: 1, Tropical Depression: 1, Wind: 1, Other: 1 (Note: some incidents may be assigned to more than one category).
Hospitals and medical centers near Deer Park:
EAST GALBRAITH HEALTH CARE CENTER (Nursing Home, about 1 miles away; CINCINNATI, OH)
EAST GALBRAITH NURSING HOME (Nursing Home, about 1 miles away; CINCINNATI, OH)
SILVERTON DIALYSIS (Dialysis Facility, about 1 miles away; CINCINNATI, OH)
SILVERTON HOMETRAINING DIALYSIS (Dialysis Facility, about 1 miles away; CINCINNATI, OH)
RESIDENCE AT GARDEN GATE, THE (Nursing Home, about 1 miles away; CINCINNATI, OH)
LIBERTY DIALYSIS - KENWOOD (Dialysis Facility, about 1 miles away; KENWOOD, OH)
JEWISH HOSPITAL, LLC Acute Care Hospitals (about 1 miles away; CINCINNATI, OH)
16 miles: HAMILTON (M. L. KING BLVD AT HENRY ST.) . Services: public payphones, free short-term parking, call for taxi service, public transit connection.
Colleges/universities with over 2000 students nearest to Deer Park:
University of Cincinnati-Blue Ash College (about 3 miles; Blue Ash, OH; Full-time enrollment: 3,711)
Xavier University (about 6 miles; Cincinnati, OH; FT enrollment: 6,143)
University of Cincinnati-Main Campus (about 9 miles; Cincinnati, OH; FT enrollment: 28,747)
Cincinnati State Technical and Community College (about 9 miles; Cincinnati, OH; FT enrollment: 8,757)
Northern Kentucky University (about 13 miles; Highland Heights, KY; FT enrollment: 12,059)
University of Cincinnati-Clermont College (about 14 miles; Batavia, OH; FT enrollment: 2,739)
Miami University-Hamilton (about 15 miles; Hamilton, OH; FT enrollment: 2,906)
Churches in Deer Park include: Calvary Baptist Church (A), Saint John the Evangelist Roman Catholic Church (B), Church of God of Prophecy (C), Deer Park Baptist Church (D). Display/hide their locations on the map
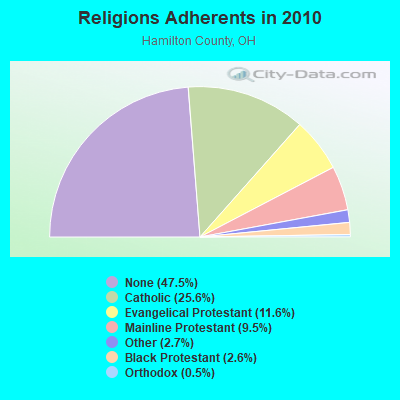
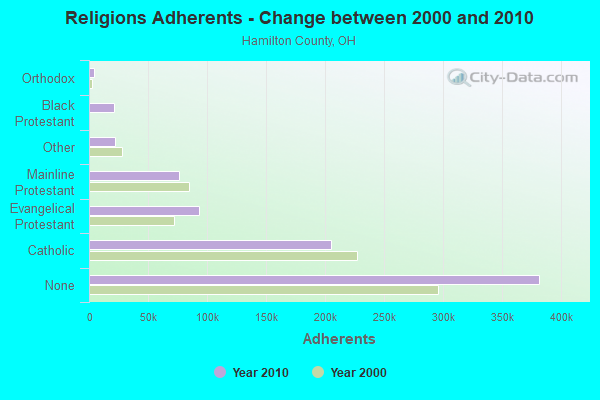
Religion statistics for Deer Park, OH (based on Hamilton County data)
Religion
Adherents
Congregations
Catholic
205,094
83
Evangelical Protestant
93,166
269
Mainline Protestant
76,354
188
Other
21,699
64
Black Protestant
20,814
55
Orthodox
3,879
7
None
381,368
-
Source: Clifford Grammich, Kirk Hadaway, Richard Houseal, Dale E.Jones, Alexei Krindatch, Richie Stanley and Richard H.Taylor. 2012. 2010 U.S.Religion Census: Religious Congregations & Membership Study. Association of Statisticians of American Religious Bodies. Jones, Dale E., et al. 2002. Congregations and Membership in the United States 2000. Nashville, TN: Glenmary Research Center. Graphs represent county-level data
Matson & Beech Aves (Lat: 39.196444 Lon: -84.427167), Call Sign: KCY571, Licensee ID: L00045982, Assigned Frequencies: 158.760 MHz, Grant Date: 09/03/2003, Expiration Date: 11/21/2013, Cancellation Date: 01/25/2014, Registrant: City Of Deer Park, Matson & Beech Aves, Deer Park, OH 45236
4250 Matson Ave (Lat: 39.196444 Lon: -84.427167), Call Sign: KUU437, Licensee ID: L00045982, Assigned Frequencies: 460.350 MHz, Grant Date: 04/06/2005, Expiration Date: 04/30/2015, Cancellation Date: 07/04/2015, Registrant: City Of Deer Park, Beech & Matson Ave, Deer Park, OH 45236, Phone: (513) 791-8056
4250 Matson Ave (Lat: 39.196444 Lon: -84.427167), Call Sign: WBE390, Licensee ID: L00045982, Assigned Frequencies: 465.350 MHz, Grant Date: 04/06/2005, Expiration Date: 04/26/2015, Cancellation Date: 06/27/2015, Registrant: City Of Deer Park, Beech & Matson Ave, Deer Park, OH 45236, Phone: (513) 791-8056
Lat: 39.196417 Lon: -84.427167, Call Sign: WQUJ626, Licensee ID: L00045982, Assigned Frequencies: 158.865 MHz, Grant Date: 07/26/2014, Expiration Date: 07/26/2024, Certifier: Michael F Schlie, Registrant: City Of Deer Park, 7777 Blue Ash Road, Deer Park, OH 45236, Phone: (513) 791-8056, Fax: (513) 794-8875, Email:
FCC Registered Amateur Radio Licenses:
1
Call Sign: N8FBE, Licensee ID: L00724369, Grant Date: 12/12/2017, Expiration Date: 01/09/2028, Certifier: David R Wood, Registrant: David R Wood, 7715 Moss Ct, Deer Park, OH 45236
Home Mortgage Disclosure Act Aggregated Statistics For Year 2009 (Based on 1 full and 1 partial tracts)
A) FHA, FSA/RHS & VA Home Purchase Loans
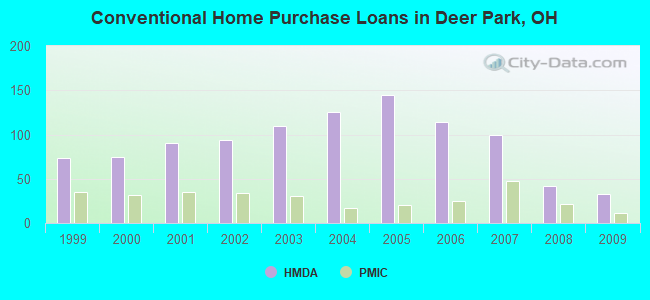
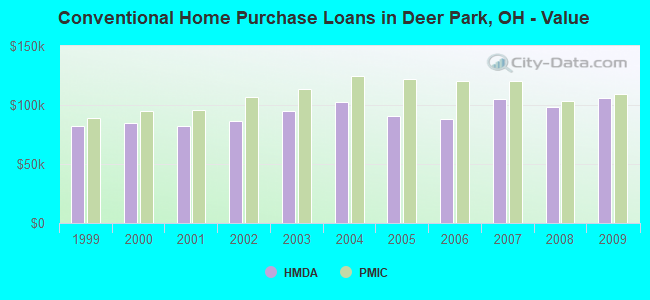
B) Conventional Home Purchase Loans
C) Refinancings
D) Home Improvement Loans
F) Non-occupant Loans on < 5 Family Dwellings (A B C & D)
Number
Average Value
Number
Average Value
Number
Average Value
Number
Average Value
Number
Average Value
LOANS ORIGINATED
71
$119,811
33
$105,768
146
$106,865
4
$39,902
10
$81,997
APPLICATIONS APPROVED, NOT ACCEPTED
2
$91,820
1
$13,450
10
$92,768
1
$40,000
2
$65,525
APPLICATIONS DENIED
5
$131,816
2
$80,500
55
$110,407
8
$41,940
5
$114,788
APPLICATIONS WITHDRAWN
4
$113,658
3
$89,333
20
$118,051
1
$25,000
1
$80,000
FILES CLOSED FOR INCOMPLETENESS
0
$0
0
$0
8
$125,762
0
$0
0
$0
Aggregated Statistics For Year 2008 (Based on 1 full and 1 partial tracts)
A) FHA, FSA/RHS & VA Home Purchase Loans
B) Conventional Home Purchase Loans
C) Refinancings
D) Home Improvement Loans
E) Loans on Dwellings For 5+ Families
F) Non-occupant Loans on < 5 Family Dwellings (A B C & D)
G) Loans On Manufactured Home Dwelling (A B C & D)
Number
Average Value
Number
Average Value
Number
Average Value
Number
Average Value
Number
Average Value
Number
Average Value
Number
Average Value
LOANS ORIGINATED
38
$119,128
42
$98,444
88
$106,396
15
$34,221
0
$0
21
$91,584
1
$44,000
APPLICATIONS APPROVED, NOT ACCEPTED
2
$106,305
7
$93,521
14
$111,157
4
$41,602
0
$0
0
$0
1
$19,000
APPLICATIONS DENIED
2
$115,150
6
$105,550
71
$108,861
16
$21,805
1
$64,720
5
$80,060
2
$187,500
APPLICATIONS WITHDRAWN
4
$126,518
3
$97,780
15
$112,511
1
$79,850
0
$0
1
$75,640
0
$0
FILES CLOSED FOR INCOMPLETENESS
1
$102,000
0
$0
3
$88,767
0
$0
0
$0
0
$0
0
$0
Aggregated Statistics For Year 2007 (Based on 1 full and 1 partial tracts)
A) FHA, FSA/RHS & VA Home Purchase Loans
B) Conventional Home Purchase Loans
C) Refinancings
D) Home Improvement Loans
E) Loans on Dwellings For 5+ Families
F) Non-occupant Loans on < 5 Family Dwellings (A B C & D)
Number
Average Value
Number
Average Value
Number
Average Value
Number
Average Value
Number
Average Value
Number
Average Value
LOANS ORIGINATED
10
$125,644
99
$105,476
98
$93,616
18
$16,611
3
$251,590
20
$89,443
APPLICATIONS APPROVED, NOT ACCEPTED
1
$160,000
11
$78,030
22
$87,855
3
$43,967
0
$0
4
$87,782
APPLICATIONS DENIED
5
$134,540
20
$103,351
70
$106,179
13
$35,621
0
$0
6
$79,672
APPLICATIONS WITHDRAWN
0
$0
9
$102,369
29
$105,313
2
$29,500
1
$129,440
2
$133,885
FILES CLOSED FOR INCOMPLETENESS
0
$0
2
$108,305
7
$115,681
1
$2,520
0
$0
0
$0
Aggregated Statistics For Year 2006 (Based on 1 full and 1 partial tracts)
A) FHA, FSA/RHS & VA Home Purchase Loans
B) Conventional Home Purchase Loans
C) Refinancings
D) Home Improvement Loans
E) Loans on Dwellings For 5+ Families
F) Non-occupant Loans on < 5 Family Dwellings (A B C & D)
G) Loans On Manufactured Home Dwelling (A B C & D)
Number
Average Value
Number
Average Value
Number
Average Value
Number
Average Value
Number
Average Value
Number
Average Value
Number
Average Value
LOANS ORIGINATED
13
$118,016
114
$88,391
136
$91,681
30
$24,886
3
$2,022,243
25
$95,822
0
$0
APPLICATIONS APPROVED, NOT ACCEPTED
0
$0
15
$103,555
22
$89,107
6
$15,843
0
$0
5
$91,166
1
$55,000
APPLICATIONS DENIED
3
$72,843
11
$92,761
85
$107,571
17
$22,376
0
$0
4
$80,932
1
$40,340
APPLICATIONS WITHDRAWN
0
$0
10
$104,298
41
$108,918
6
$35,470
0
$0
3
$62,557
0
$0
FILES CLOSED FOR INCOMPLETENESS
0
$0
5
$98,842
11
$105,435
0
$0
0
$0
1
$83,210
0
$0
Aggregated Statistics For Year 2005 (Based on 1 full and 1 partial tracts)
A) FHA, FSA/RHS & VA Home Purchase Loans
B) Conventional Home Purchase Loans
C) Refinancings
D) Home Improvement Loans
E) Loans on Dwellings For 5+ Families
F) Non-occupant Loans on < 5 Family Dwellings (A B C & D)
G) Loans On Manufactured Home Dwelling (A B C & D)
Number
Average Value
Number
Average Value
Number
Average Value
Number
Average Value
Number
Average Value
Number
Average Value
Number
Average Value
LOANS ORIGINATED
16
$137,586
145
$90,837
140
$98,515
24
$34,732
3
$152,683
30
$93,207
0
$0
APPLICATIONS APPROVED, NOT ACCEPTED
1
$118,000
11
$101,156
27
$91,145
6
$39,365
0
$0
2
$111,785
0
$0
APPLICATIONS DENIED
4
$125,798
24
$91,732
83
$106,233
17
$23,089
0
$0
7
$92,823
1
$155,000
APPLICATIONS WITHDRAWN
1
$142,000
10
$89,460
56
$100,254
11
$70,035
0
$0
5
$99,538
0
$0
FILES CLOSED FOR INCOMPLETENESS
1
$98,340
8
$138,099
17
$105,330
1
$41,000
0
$0
2
$65,140
0
$0
Aggregated Statistics For Year 2004 (Based on 1 full and 1 partial tracts)
A) FHA, FSA/RHS & VA Home Purchase Loans
B) Conventional Home Purchase Loans
C) Refinancings
D) Home Improvement Loans
E) Loans on Dwellings For 5+ Families
F) Non-occupant Loans on < 5 Family Dwellings (A B C & D)
G) Loans On Manufactured Home Dwelling (A B C & D)
Number
Average Value
Number
Average Value
Number
Average Value
Number
Average Value
Number
Average Value
Number
Average Value
Number
Average Value
LOANS ORIGINATED
13
$115,003
125
$102,178
181
$90,410
29
$33,752
1
$393,350
31
$94,264
0
$0
APPLICATIONS APPROVED, NOT ACCEPTED
1
$38,660
14
$116,482
31
$87,775
10
$21,972
0
$0
6
$99,742
1
$38,660
APPLICATIONS DENIED
0
$0
15
$110,714
98
$107,794
23
$28,863
0
$0
2
$105,500
0
$0
APPLICATIONS WITHDRAWN
4
$102,152
10
$129,931
59
$99,208
8
$62,346
1
$403,440
10
$136,659
0
$0
FILES CLOSED FOR INCOMPLETENESS
0
$0
3
$115,793
19
$100,262
1
$5,000
0
$0
3
$72,843
0
$0
Aggregated Statistics For Year 2003 (Based on 1 full and 1 partial tracts)
A) FHA, FSA/RHS & VA Home Purchase Loans
B) Conventional Home Purchase Loans
C) Refinancings
D) Home Improvement Loans
F) Non-occupant Loans on < 5 Family Dwellings (A B C & D)
Number
Average Value
Number
Average Value
Number
Average Value
Number
Average Value
Number
Average Value
LOANS ORIGINATED
23
$120,959
110
$95,292
391
$85,793
43
$21,624
48
$86,036
APPLICATIONS APPROVED, NOT ACCEPTED
4
$117,065
12
$70,386
55
$89,617
7
$10,210
3
$27,357
APPLICATIONS DENIED
0
$0
8
$71,949
67
$97,755
21
$10,459
4
$41,082
APPLICATIONS WITHDRAWN
0
$0
6
$96,118
52
$94,278
1
$25,000
2
$55,895
FILES CLOSED FOR INCOMPLETENESS
1
$79,850
3
$103,663
22
$96,044
1
$31,940
2
$64,520
Aggregated Statistics For Year 2002 (Based on 1 full and 1 partial tracts)
A) FHA, FSA/RHS & VA Home Purchase Loans
B) Conventional Home Purchase Loans
C) Refinancings
D) Home Improvement Loans
F) Non-occupant Loans on < 5 Family Dwellings (A B C & D)
Number
Average Value
Number
Average Value
Number
Average Value
Number
Average Value
Number
Average Value
LOANS ORIGINATED
25
$104,739
94
$86,297
290
$85,643
29
$14,671
40
$88,725
APPLICATIONS APPROVED, NOT ACCEPTED
2
$89,045
9
$93,741
50
$77,719
9
$33,293
0
$0
APPLICATIONS DENIED
3
$87,883
10
$88,932
66
$88,688
18
$11,309
2
$45,805
APPLICATIONS WITHDRAWN
3
$121,313
10
$84,687
45
$88,876
2
$5,465
4
$93,670
FILES CLOSED FOR INCOMPLETENESS
2
$98,665
6
$79,173
14
$96,401
1
$15,000
1
$66,000
Aggregated Statistics For Year 2001 (Based on 1 full and 1 partial tracts)
A) FHA, FSA/RHS & VA Home Purchase Loans
B) Conventional Home Purchase Loans
C) Refinancings
D) Home Improvement Loans
E) Loans on Dwellings For 5+ Families
F) Non-occupant Loans on < 5 Family Dwellings (A B C & D)
Number
Average Value
Number
Average Value
Number
Average Value
Number
Average Value
Number
Average Value
Number
Average Value
LOANS ORIGINATED
33
$105,943
90
$82,161
256
$84,373
23
$19,863
1
$453,870
27
$79,640
APPLICATIONS APPROVED, NOT ACCEPTED
3
$81,267
10
$84,710
47
$79,732
9
$10,722
0
$0
2
$103,770
APPLICATIONS DENIED
4
$101,302
9
$85,263
86
$87,852
19
$15,785
0
$0
4
$50,692
APPLICATIONS WITHDRAWN
3
$112,007
6
$77,577
39
$74,747
2
$40,860
0
$0
1
$117,000
FILES CLOSED FOR INCOMPLETENESS
0
$0
1
$74,800
13
$96,693
3
$10,870
0
$0
0
$0
Aggregated Statistics For Year 2000 (Based on 1 full and 1 partial tracts)
A) FHA, FSA/RHS & VA Home Purchase Loans
B) Conventional Home Purchase Loans
C) Refinancings
D) Home Improvement Loans
E) Loans on Dwellings For 5+ Families
F) Non-occupant Loans on < 5 Family Dwellings (A B C & D)
Number
Average Value
Number
Average Value
Number
Average Value
Number
Average Value
Number
Average Value
Number
Average Value
LOANS ORIGINATED
41
$97,676
75
$84,502
75
$69,955
45
$14,134
1
$78,170
14
$70,823
APPLICATIONS APPROVED, NOT ACCEPTED
3
$75,083
5
$73,348
19
$62,228
13
$8,658
0
$0
0
$0
APPLICATIONS DENIED
2
$90,680
14
$83,346
30
$79,422
22
$10,027
0
$0
0
$0
APPLICATIONS WITHDRAWN
2
$102,000
6
$116,148
18
$66,169
4
$27,792
0
$0
0
$0
FILES CLOSED FOR INCOMPLETENESS
2
$71,440
2
$99,500
5
$73,816
1
$5,000
0
$0
0
$0
Aggregated Statistics For Year 1999 (Based on 1 full and 1 partial tracts)
A) FHA, FSA/RHS & VA Home Purchase Loans
B) Conventional Home Purchase Loans
C) Refinancings
D) Home Improvement Loans
E) Loans on Dwellings For 5+ Families
F) Non-occupant Loans on < 5 Family Dwellings (A B C & D)
Detailed PMIC statistics for the following Tracts:0237.01
, 0237.02
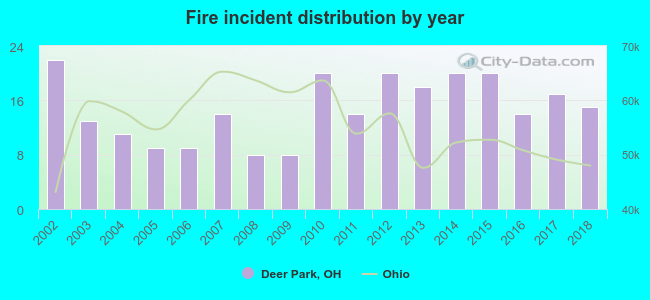
2002 - 2018 National Fire Incident Reporting System (NFIRS) incidents
Based on the data from the years 2002 - 2018 the average number of fire incidents per year is 15. The highest number of fires - 22 took place in 2002, and the least - 8 in 2008. The data has a declining trend.
When looking into fire subcategories, the most incidents belonged to: Structure Fires (58.7%), and Outside Fires (29.0%).
Fire incident types reported to NFIRS in Deer Park, OH


 Recent articles from our blog. Our writers, many of them Ph.D. graduates or candidates, create easy-to-read articles on a wide variety of topics.

 (7.4 miles


 Based on the data from the years 2002 - 2018 the average number of fire incidents per year is 15. The highest number of fires - 22 took place in 2002, and the least - 8 in 2008. The data has a declining trend.
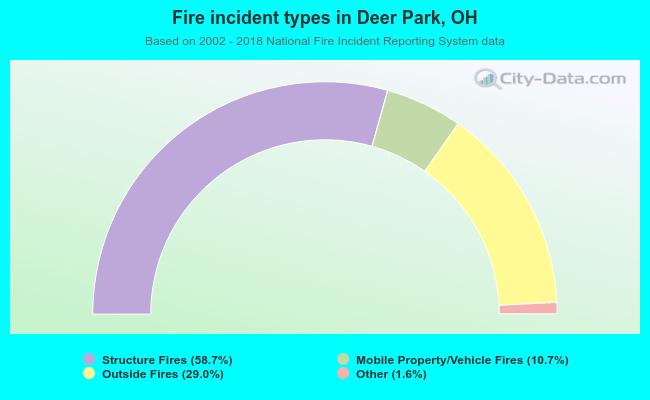 When looking into fire subcategories, the most incidents belonged to: Structure Fires (58.7%), and Outside Fires (29.0%).